| Param | Original file | Final file |
|---|---|---|
| Filename | modeM0/AS1A11_046T04_9000004792_33426cztM0_level2.evt | modeM0/AS1A11_046T04_9000004792_33426cztM0_level2_quad_clean.evt |
| Size (bytes) | 1,538,853,120 | 288,092,160 |
| Size | 1.4 GB | 274.7 MB |
| Events in quadrant A | 8,974,566 | 1,963,692 |
| Events in quadrant B | 11,531,753 | 1,935,444 |
| Events in quadrant C | 8,645,908 | 1,904,465 |
| Events in quadrant D | 16,315,454 | 1,757,997 |
| Mode M0 | |||
|---|---|---|---|
| Quadrant | BADHDUFLAG | Total packets | Discarded packets |
| A | 0 | 35584 | 5 |
| B | 0 | 45114 | 4 |
| C | 0 | 35420 | 4 |
| D | 0 | 60693 | 4 |
| Mode M9 | |||
|---|---|---|---|
| Quadrant | BADHDUFLAG | Total packets | Discarded packets |
| A | 0 | 83 | 0 |
| B | 0 | 83 | 0 |
| C | 0 | 83 | 0 |
| D | 0 | 83 | 0 |
| Mode SS | |||
|---|---|---|---|
| Quadrant | BADHDUFLAG | Total packets | Discarded packets |
| A | 0 | 344 | 0 |
| B | 0 | 344 | 0 |
| C | 0 | 344 | 0 |
| D | 0 | 344 | 0 |
| Quadrant | Total seconds | Saturated seconds | Saturation percentage |
|---|---|---|---|
| A | 16897 | 14 | 0.082855% |
| B | 16897 | 864 | 5.113334% |
| C | 16897 | 80 | 0.473457% |
| D | 16897 | 935 | 5.533527% |
Noise dominated data is calculated using 1-second bins in cleaned event files. If a bin has >2000 counts, and if more than 50% of those come from <1% of pixels, then it is considered to be noise-dominated and hence unusable.
| Quadrant | # 1 sec bins | Bins with >0 counts | Bins with >2000 counts | High rate bins dominated by noise | Noise dominated (total time) | Noise dominated (detector-on time) | Marked lightcurve |
|---|---|---|---|---|---|---|---|
| A | 25177 | 16901 | 0 | 0 | 0.00% | 0.00% |  |
| B | 25177 | 16901 | 663 | 663 | 2.63% | 3.92% | 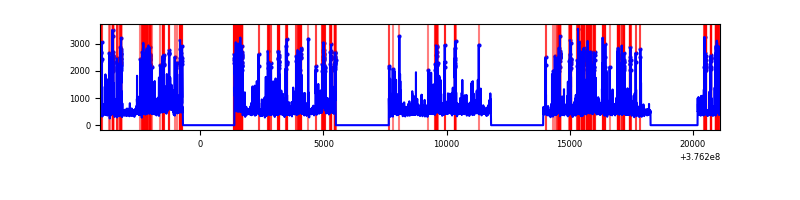 |
| C | 25177 | 16901 | 69 | 69 | 0.27% | 0.41% | 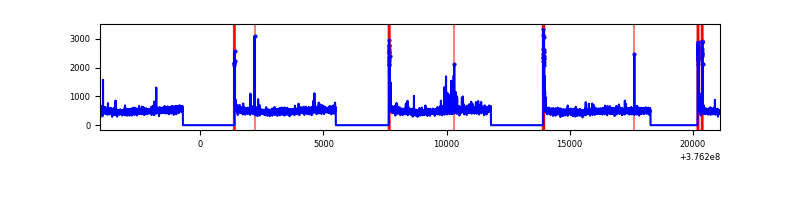 |
| D | 25177 | 16901 | 801 | 801 | 3.18% | 4.74% | 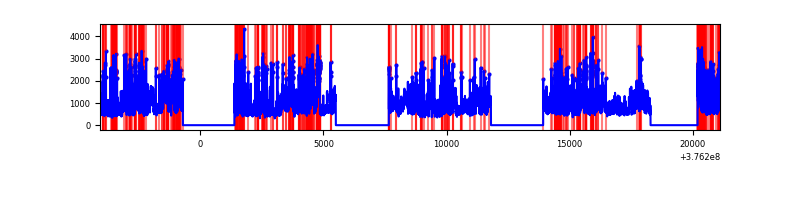 |
Top three noisy pixels from each quadrant. If the there are fewer than three noisy pixels in the level2.evt file, extra rows are filled as -1
| Pixel properties | Quadrant properties | ||||||
|---|---|---|---|---|---|---|---|
| Quadrant | DetID | PixID | Counts | Sigma | Mean | Median | Sigma |
| A | 15 | 47 | 1189226 | 3040.64 | 2008 | 1973 | 390.5 |
| A | 13 | 254 | 30887 | 74.05 | 2008 | 1973 | 390.5 |
| A | 13 | 6 | 24354 | 57.32 | 2008 | 1973 | 390.5 |
| B | 5 | 172 | 2774728 | 7713.65 | 1951 | 1903 | 359.5 |
| B | 5 | 255 | 450703 | 1248.5 | 1951 | 1903 | 359.5 |
| B | 0 | 213 | 300068 | 829.46 | 1951 | 1903 | 359.5 |
| C | 15 | 214 | 730483 | 1698.8 | 1907 | 1918 | 428.9 |
| C | 0 | 10 | 275592 | 638.13 | 1907 | 1918 | 428.9 |
| C | 9 | 187 | 82433 | 187.74 | 1907 | 1918 | 428.9 |
| D | 8 | 195 | 4817872 | 10475.8 | 1892 | 1838 | 459.7 |
| D | 2 | 250 | 1725138 | 3748.51 | 1892 | 1838 | 459.7 |
| D | 13 | 249 | 517052 | 1120.69 | 1892 | 1838 | 459.7 |
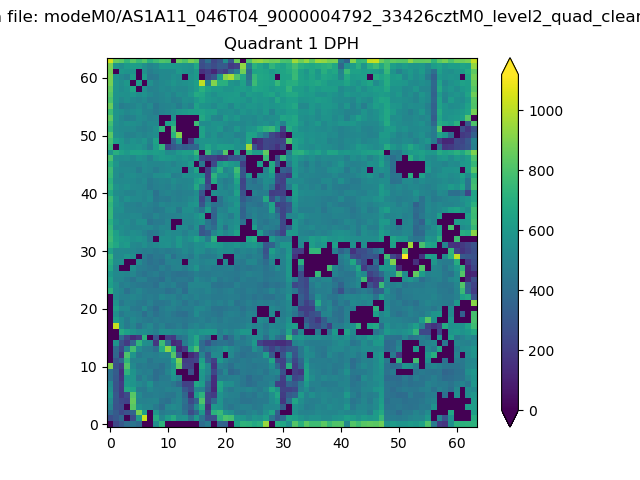
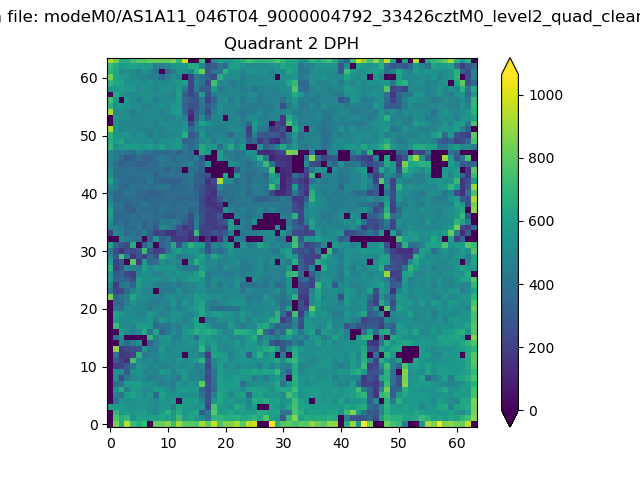
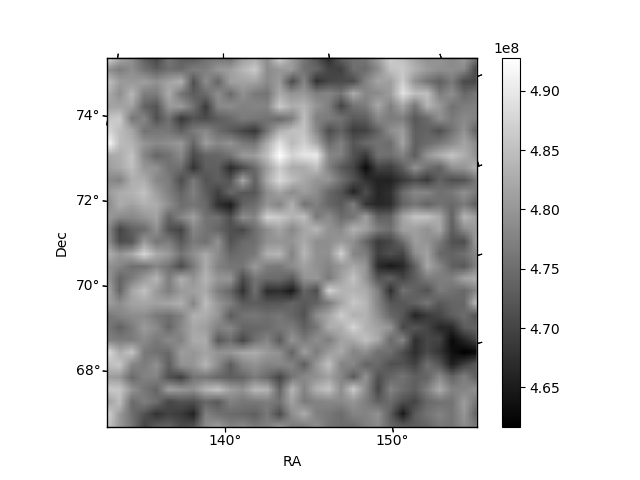
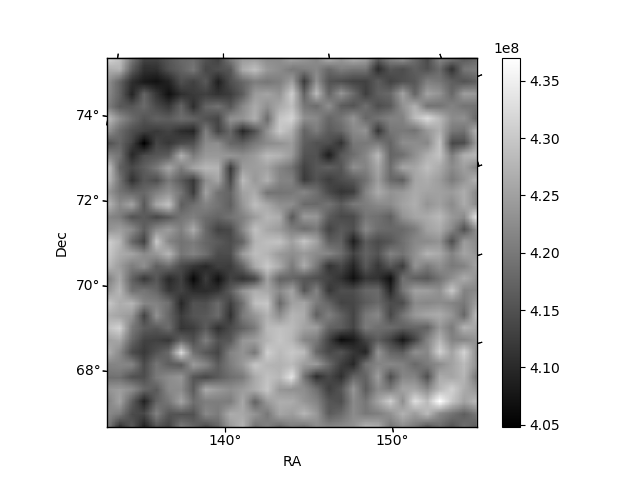
Histogram calculated using DETX and DETY for each event in the final _common_clean file
| Quadrant A |  |
 |
Quadrant B |
|---|---|---|---|
| Quadrant D | 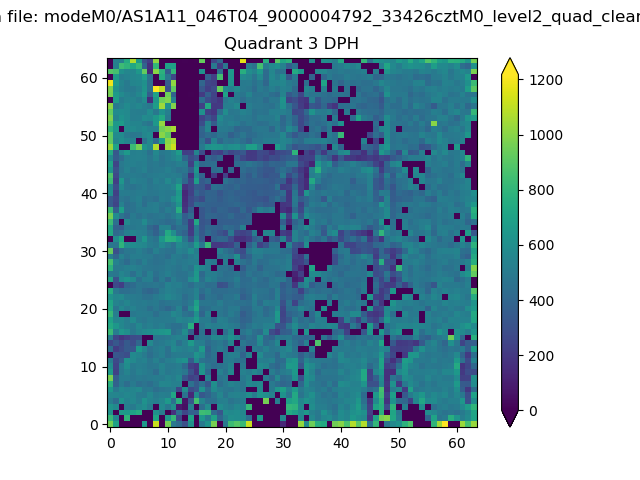 |
 |
Quadrant C |
| Plot type | Count rate plots | Images |
|---|---|---|
| Comparison with Poisson distribution Blue bars denote a histogram of data divided into 1 sec bins. Red curve is a Poisson curve with rate = median count rate of data. |
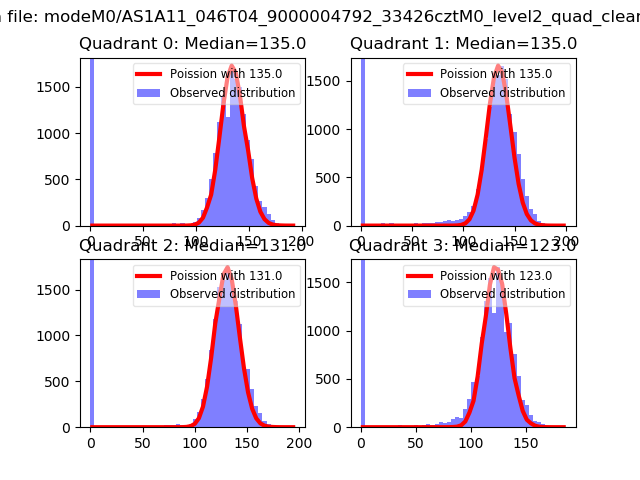 |
 |
| Quadrant-wise count rates Data is divided into 100 sec bins |
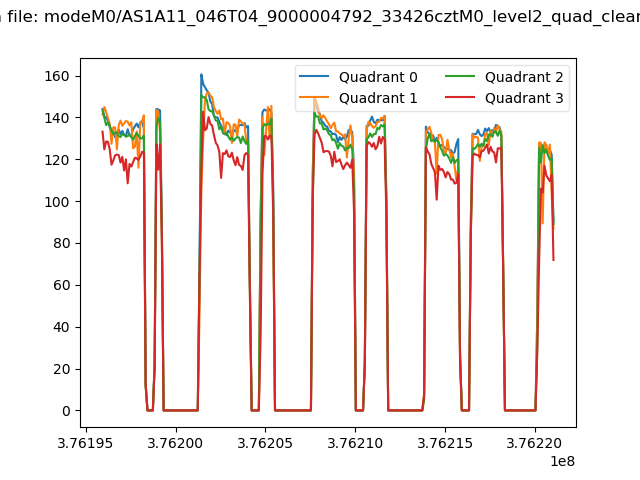 |
|
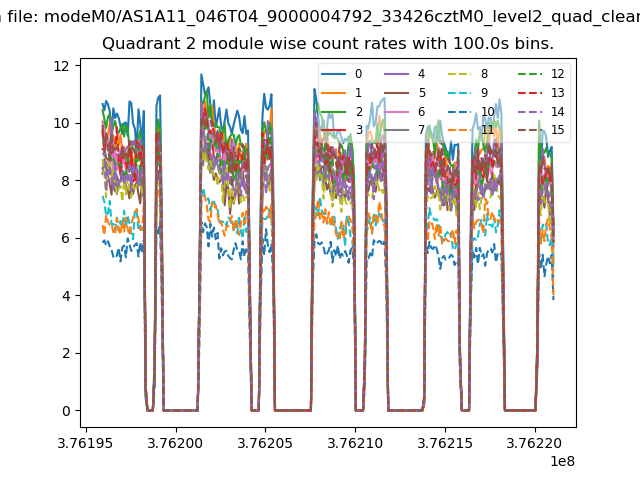
| Module-wise count rates for Quadrant A Data is divided into 100 sec bins |
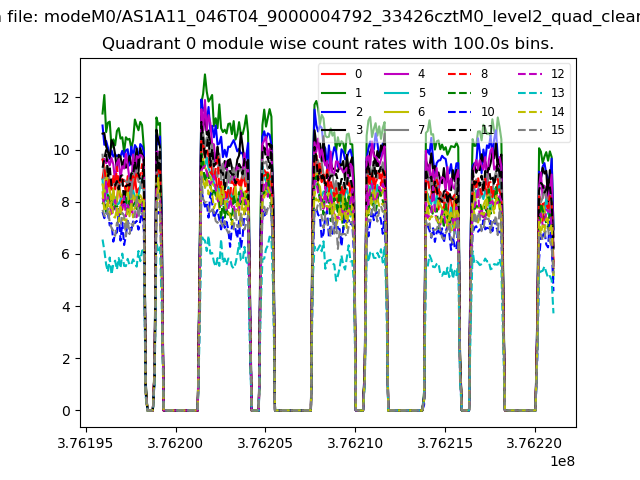 |
 |
| Module-wise count rates for Quadrant B Data is divided into 100 sec bins |
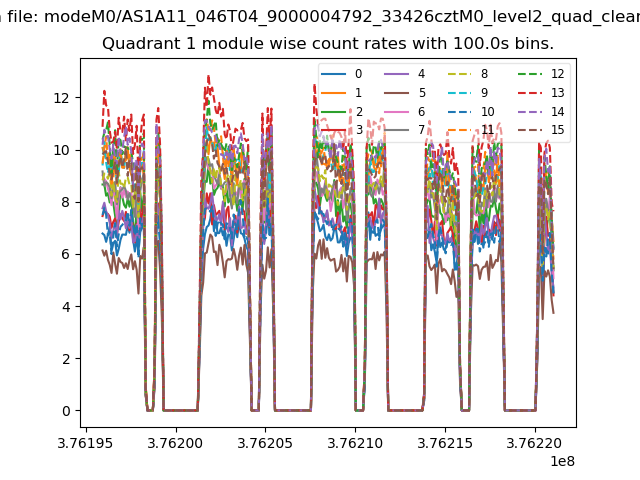 |
 |
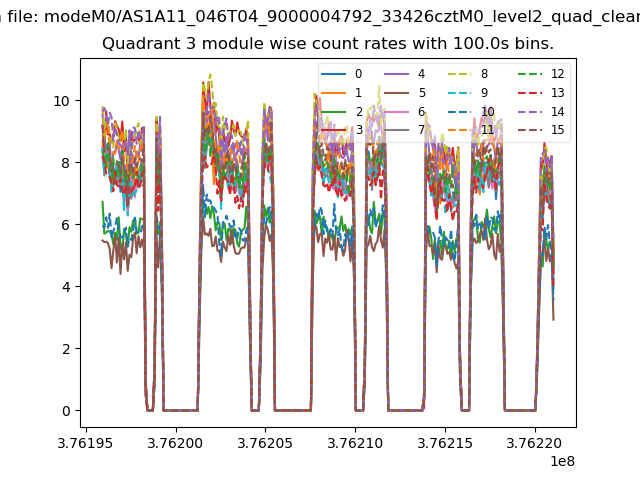
| Module-wise count rates for Quadrant C Data is divided into 100 sec bins |
 |
 |
| Module-wise count rates for Quadrant D Data is divided into 100 sec bins |
 |
 |
| Parameter | Plot |
|---|---|
| CZT HV Monitor | 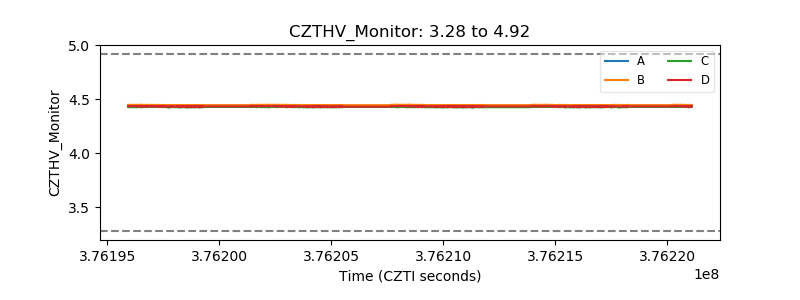 |
| D_VDD | 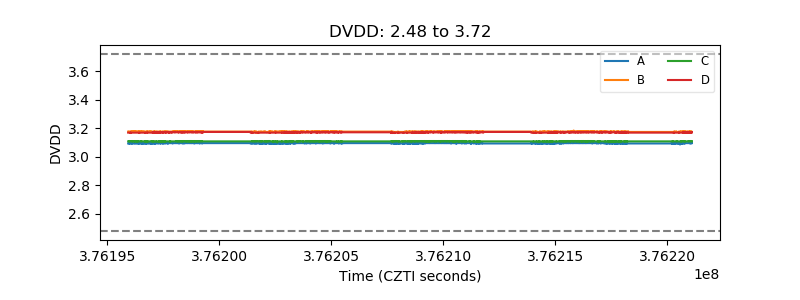 |
| Temperature 1 | 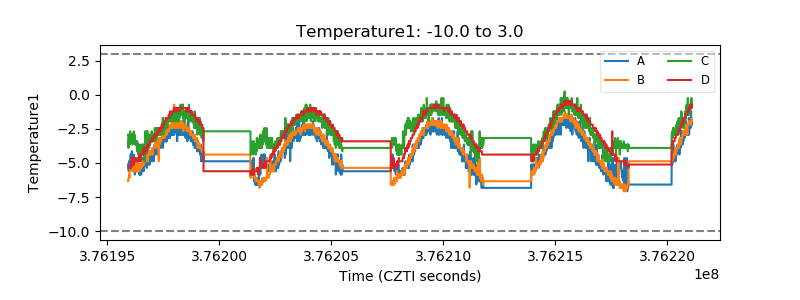 |
| Veto HV Monitor |  |
| Veto LLD | 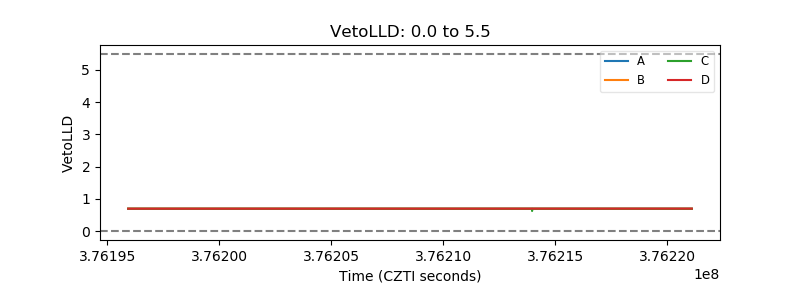 |
| Alpha Counter | 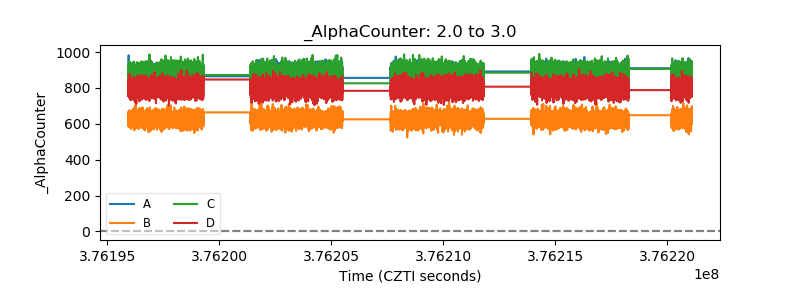 |
| _CPM_Rate | 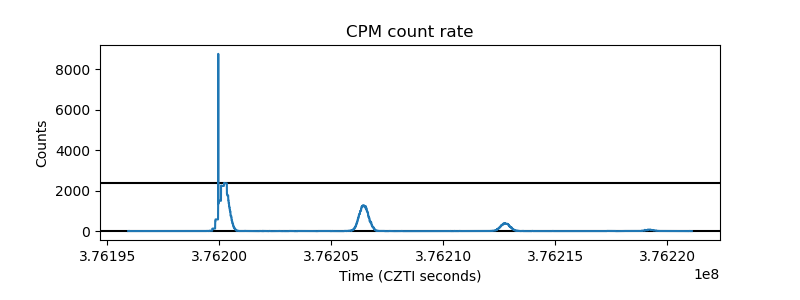 |
| CZT Counter |  |
| +2.5 Volts monitor |  |
| +5 Volts monitor |  |
| _ROLL_ROT | 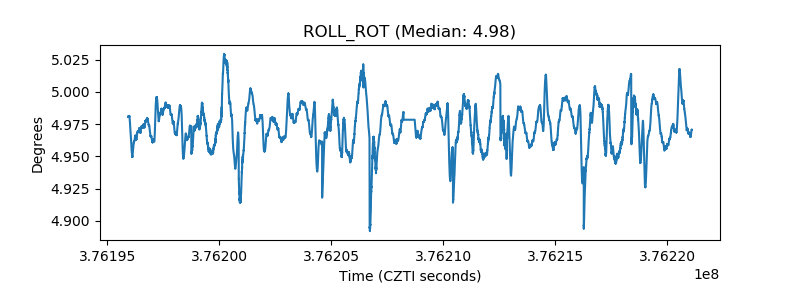 |
| _Roll_DEC | 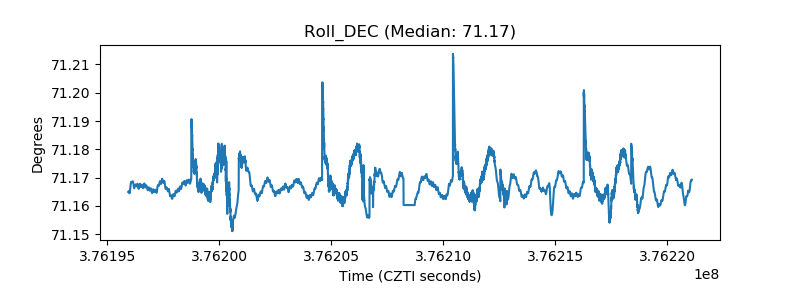 |
| _Roll_RA |  |
| Veto Counter | 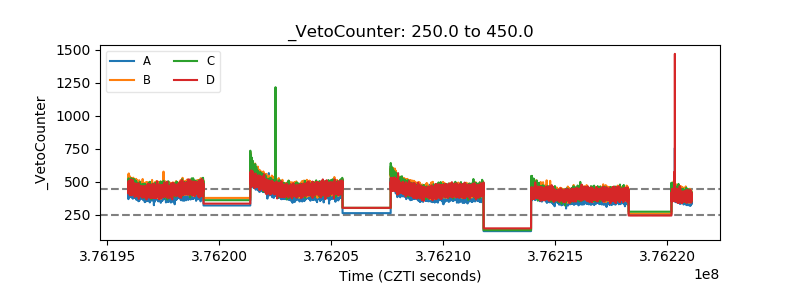 |