| Param | Original file | Final file |
|---|---|---|
| Filename | modeM0/AS1A11_046T04_9000004792_33427cztM0_level2.evt | modeM0/AS1A11_046T04_9000004792_33427cztM0_level2_quad_clean.evt |
| Size (bytes) | 513,239,040 | 92,168,640 |
| Size | 489.5 MB | 87.9 MB |
| Events in quadrant A | 2,822,485 | 627,576 |
| Events in quadrant B | 3,992,424 | 601,889 |
| Events in quadrant C | 3,106,984 | 605,206 |
| Events in quadrant D | 5,244,958 | 567,441 |
| Mode M0 | |||
|---|---|---|---|
| Quadrant | BADHDUFLAG | Total packets | Discarded packets |
| A | 0 | 11342 | 3 |
| B | 0 | 15477 | 2 |
| C | 0 | 12541 | 2 |
| D | 0 | 19356 | 2 |
| Mode M9 | |||
|---|---|---|---|
| Quadrant | BADHDUFLAG | Total packets | Discarded packets |
| A | 0 | 17 | 0 |
| B | 0 | 17 | 0 |
| C | 0 | 17 | 0 |
| D | 0 | 18 | 0 |
| Mode SS | |||
|---|---|---|---|
| Quadrant | BADHDUFLAG | Total packets | Discarded packets |
| A | 0 | 112 | 0 |
| B | 0 | 112 | 0 |
| C | 0 | 112 | 0 |
| D | 0 | 112 | 0 |
| Quadrant | Total seconds | Saturated seconds | Saturation percentage |
|---|---|---|---|
| A | 5565 | 10 | 0.179695% |
| B | 5565 | 385 | 6.918239% |
| C | 5565 | 97 | 1.743037% |
| D | 5565 | 291 | 5.229111% |
Noise dominated data is calculated using 1-second bins in cleaned event files. If a bin has >2000 counts, and if more than 50% of those come from <1% of pixels, then it is considered to be noise-dominated and hence unusable.
| Quadrant | # 1 sec bins | Bins with >0 counts | Bins with >2000 counts | High rate bins dominated by noise | Noise dominated (total time) | Noise dominated (detector-on time) | Marked lightcurve |
|---|---|---|---|---|---|---|---|
| A | 7118 | 5566 | 0 | 0 | 0.00% | 0.00% | 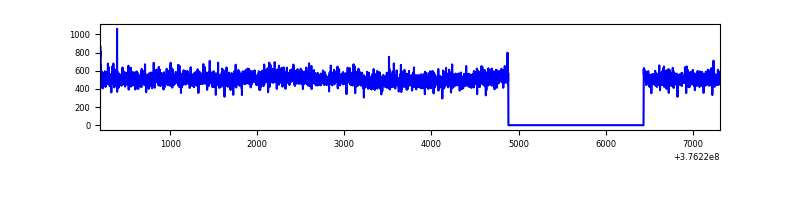 |
| B | 7117 | 5565 | 301 | 301 | 4.23% | 5.41% | 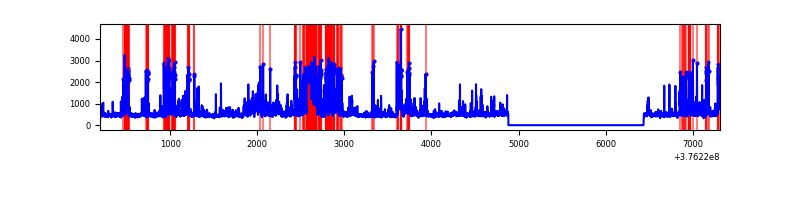 |
| C | 7118 | 5566 | 86 | 86 | 1.21% | 1.55% | 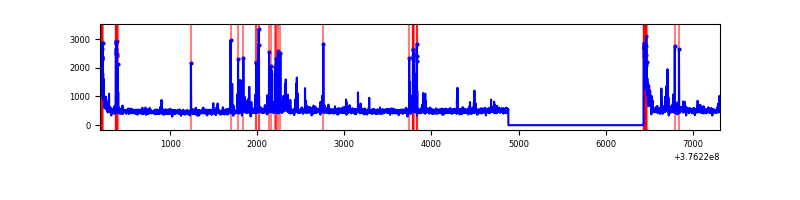 |
| D | 7118 | 5566 | 269 | 269 | 3.78% | 4.83% | 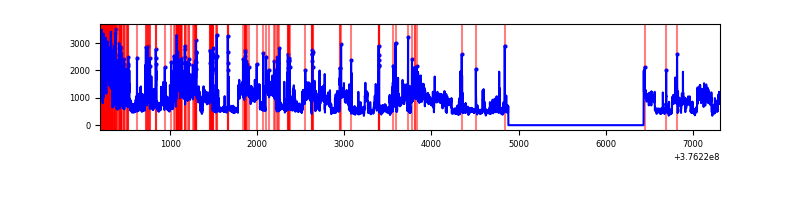 |
Top three noisy pixels from each quadrant. If the there are fewer than three noisy pixels in the level2.evt file, extra rows are filled as -1
| Pixel properties | Quadrant properties | ||||||
|---|---|---|---|---|---|---|---|
| Quadrant | DetID | PixID | Counts | Sigma | Mean | Median | Sigma |
| A | 15 | 47 | 344245 | 2707.28 | 637 | 623 | 126.9 |
| A | 13 | 6 | 10729 | 79.62 | 637 | 623 | 126.9 |
| A | 13 | 254 | 9555 | 70.37 | 637 | 623 | 126.9 |
| B | 5 | 172 | 1105282 | 9435.83 | 613 | 598 | 117.1 |
| B | 0 | 213 | 168502 | 1434.18 | 613 | 598 | 117.1 |
| B | 5 | 255 | 115444 | 980.98 | 613 | 598 | 117.1 |
| C | 15 | 214 | 244260 | 1729.77 | 609 | 614 | 140.9 |
| C | 0 | 10 | 200771 | 1421.02 | 609 | 614 | 140.9 |
| C | 14 | 254 | 112897 | 797.16 | 609 | 614 | 140.9 |
| D | 8 | 195 | 1556423 | 10482.53 | 604 | 587 | 148.4 |
| D | 2 | 250 | 515676 | 3470.44 | 604 | 587 | 148.4 |
| D | 13 | 153 | 180709 | 1213.58 | 604 | 587 | 148.4 |
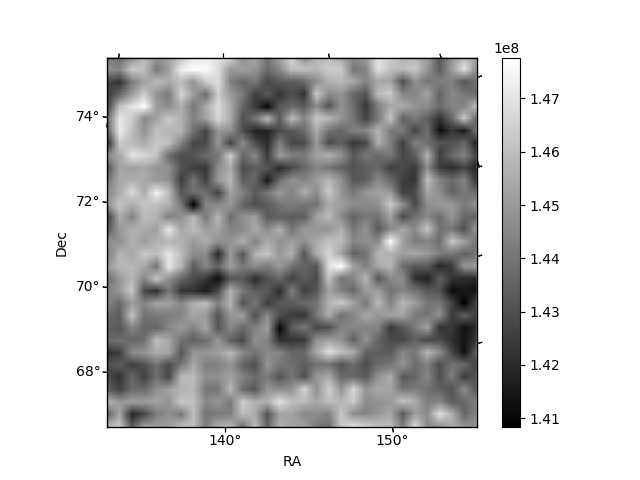
Histogram calculated using DETX and DETY for each event in the final _common_clean file
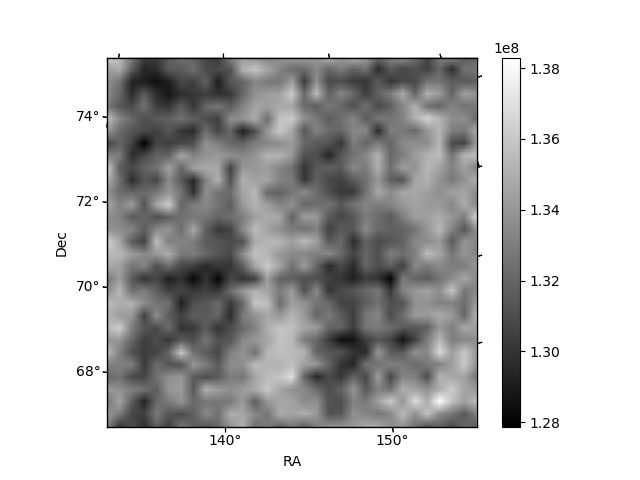
| Quadrant A | 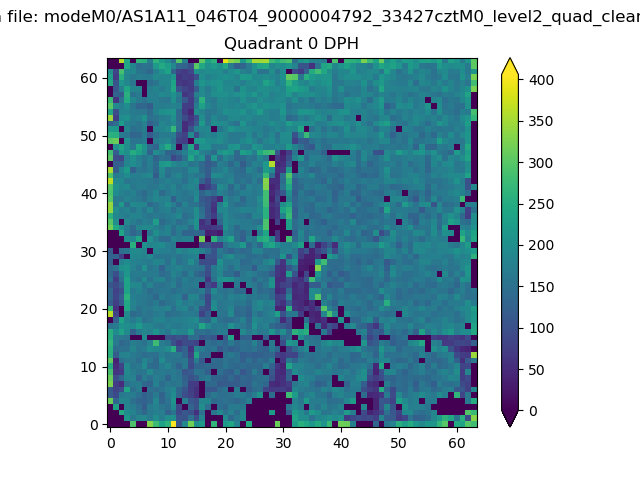 |
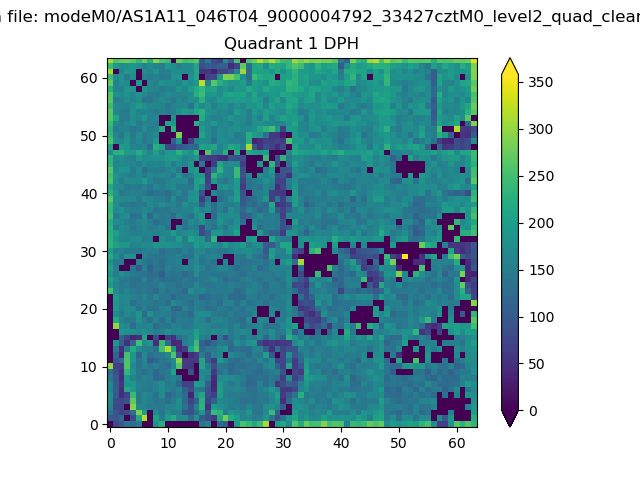 |
Quadrant B |
|---|---|---|---|
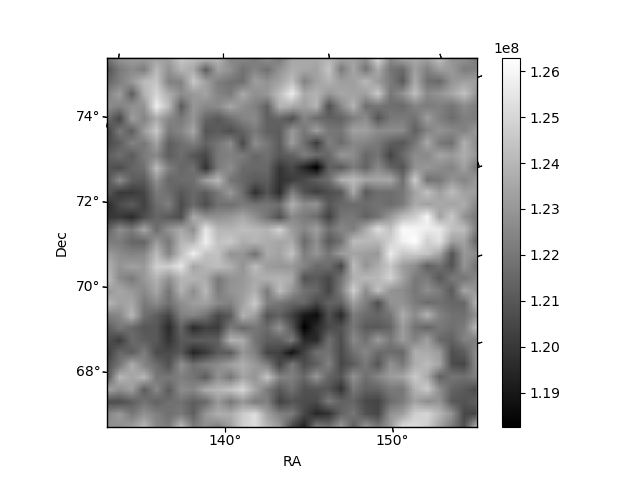
| Quadrant D | 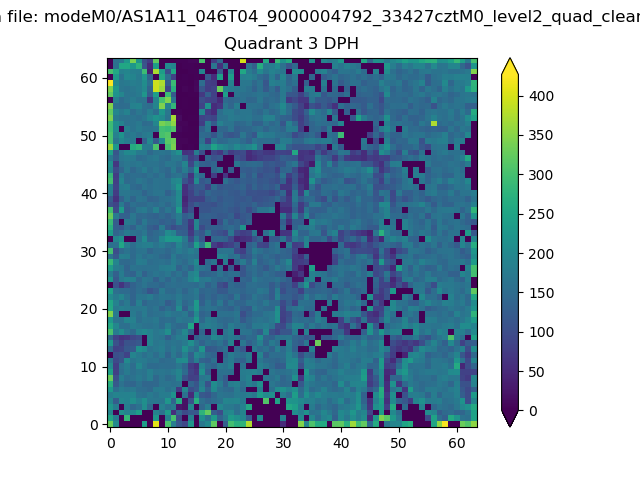 |
 |
Quadrant C |
| Plot type | Count rate plots | Images |
|---|---|---|
| Comparison with Poisson distribution Blue bars denote a histogram of data divided into 1 sec bins. Red curve is a Poisson curve with rate = median count rate of data. |
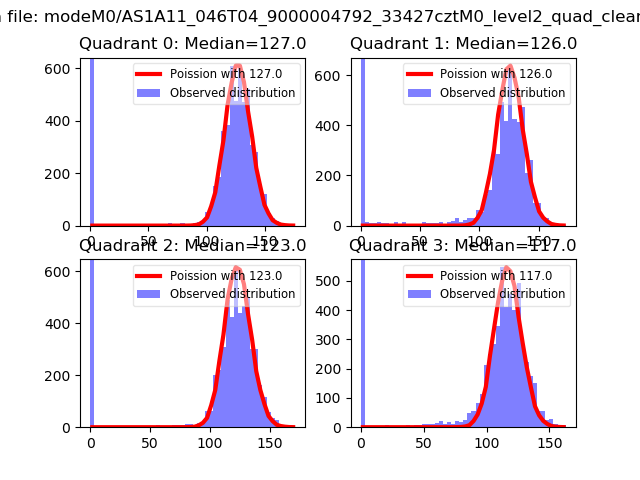 |
 |
| Quadrant-wise count rates Data is divided into 100 sec bins |
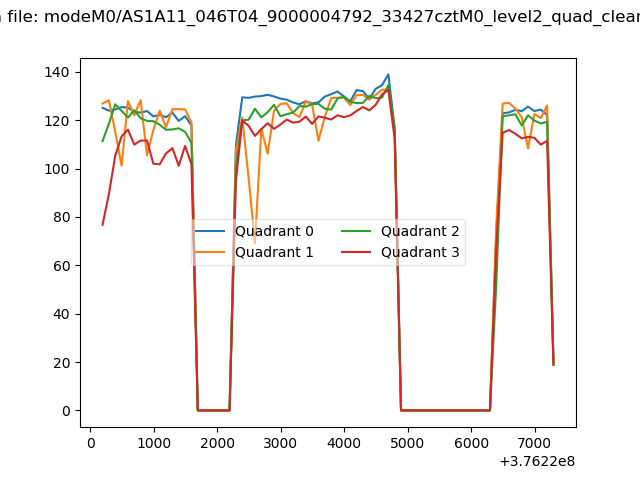 |
|
| Module-wise count rates for Quadrant A Data is divided into 100 sec bins |
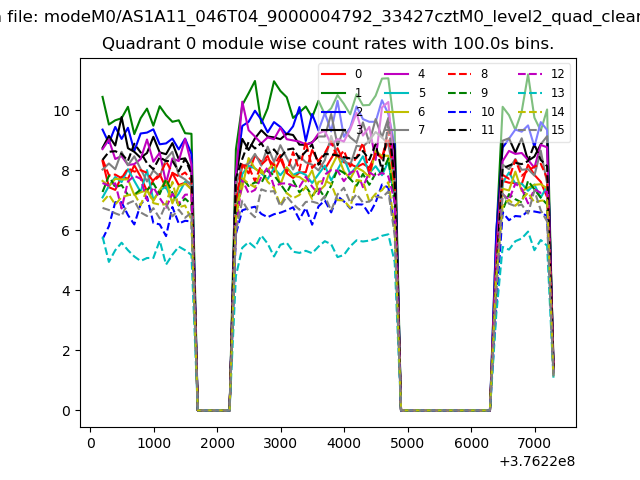 |
 |
| Module-wise count rates for Quadrant B Data is divided into 100 sec bins |
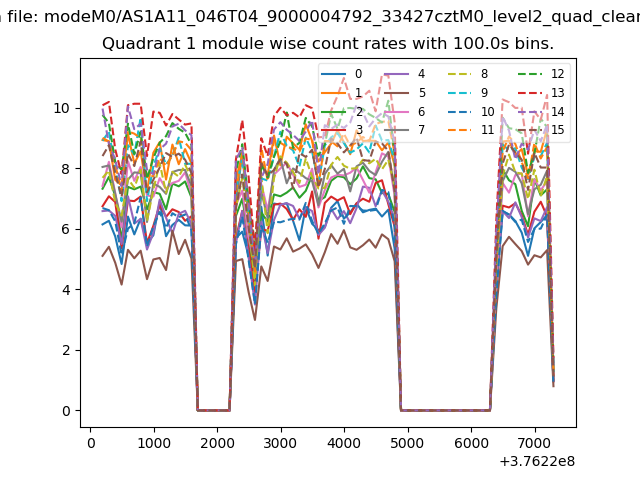 |
 |
| Module-wise count rates for Quadrant C Data is divided into 100 sec bins |
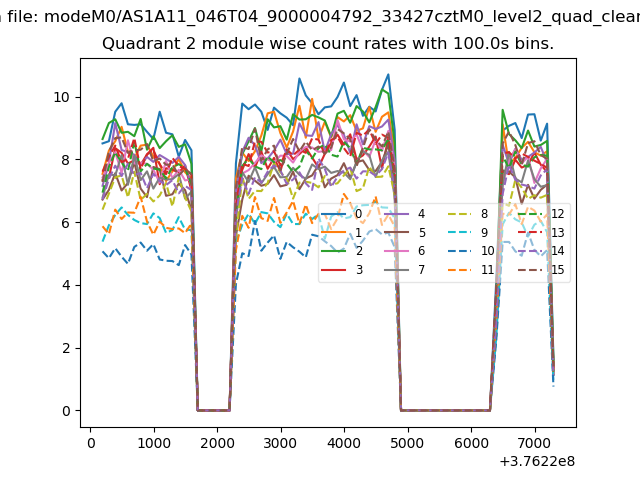 |
 |
| Module-wise count rates for Quadrant D Data is divided into 100 sec bins |
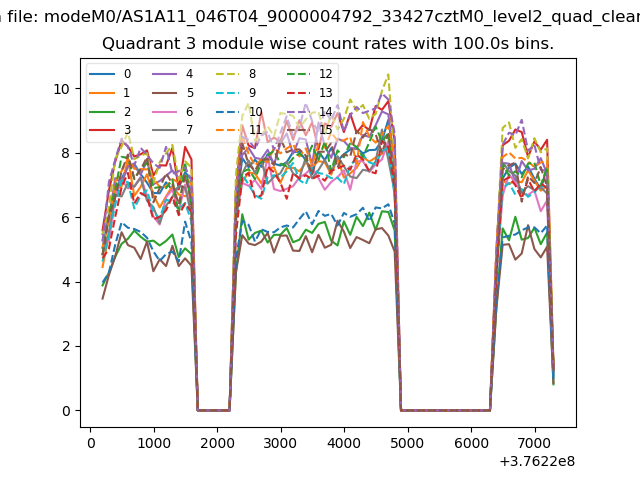 |
 |
| Parameter | Plot |
|---|---|
| CZT HV Monitor | 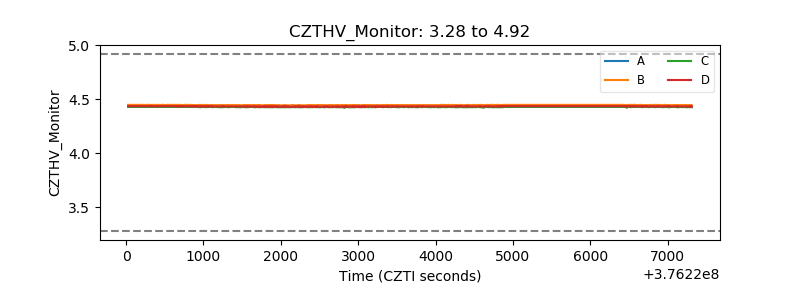 |
| D_VDD | 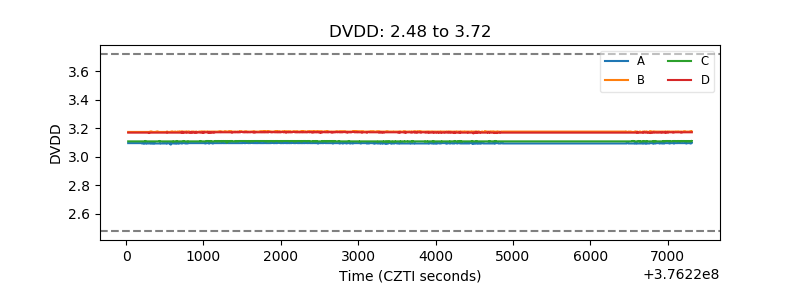 |
| Temperature 1 | 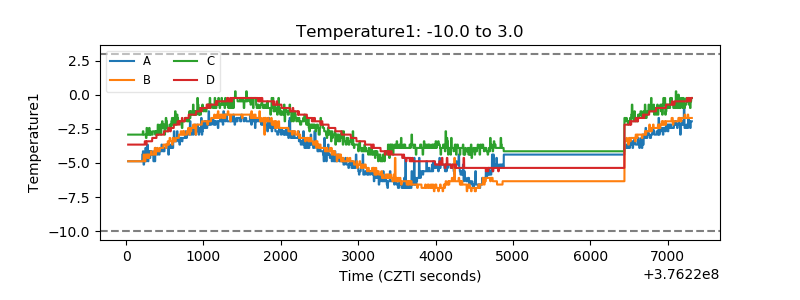 |
| Veto HV Monitor | 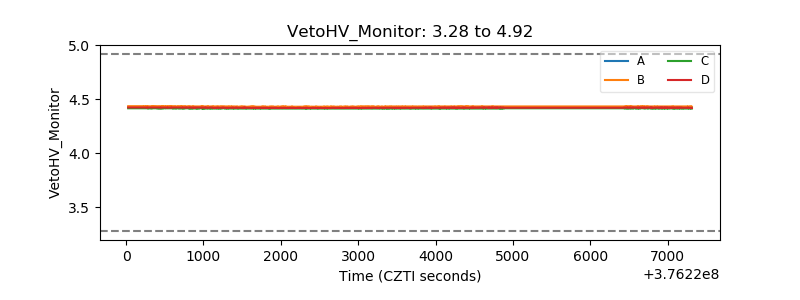 |
| Veto LLD | 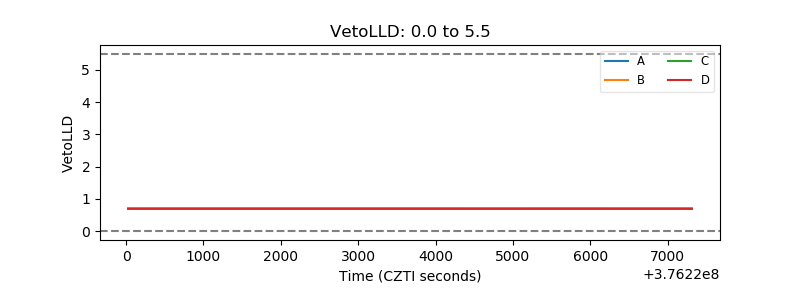 |
| Alpha Counter | 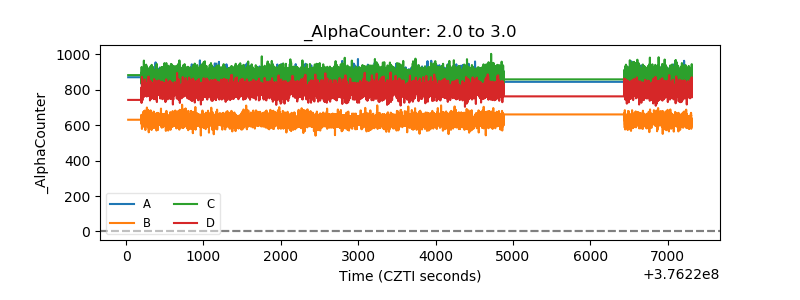 |
| _CPM_Rate | 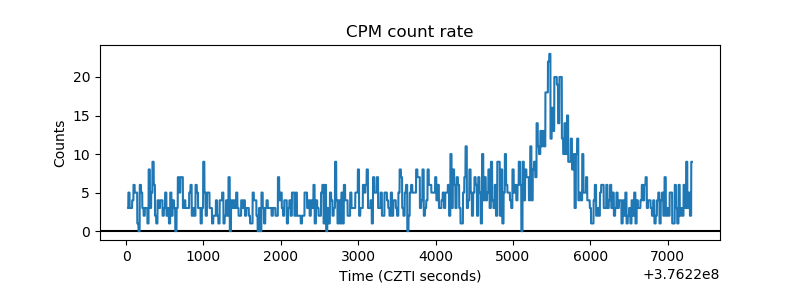 |
| CZT Counter | 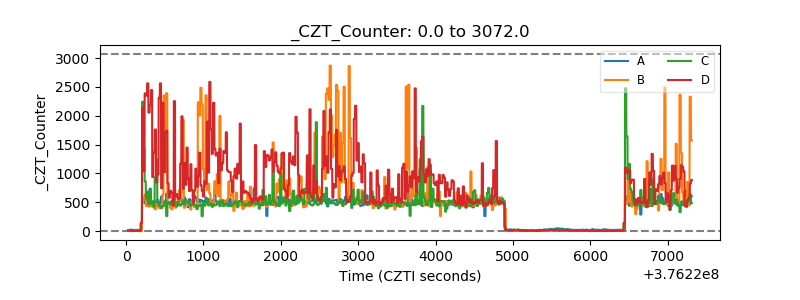 |
| +2.5 Volts monitor |  |
| +5 Volts monitor |  |
| _ROLL_ROT | 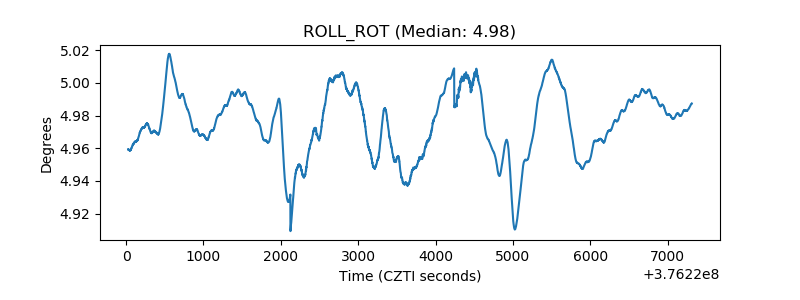 |
| _Roll_DEC | 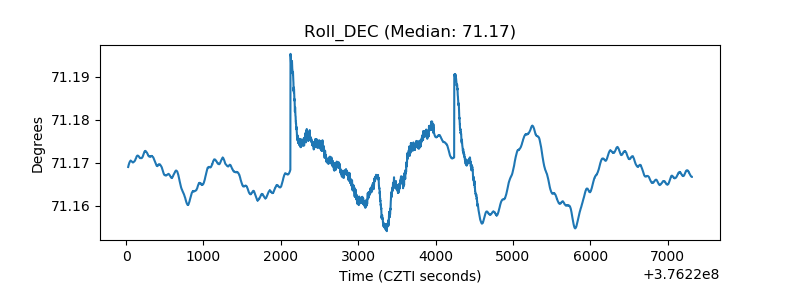 |
| _Roll_RA | 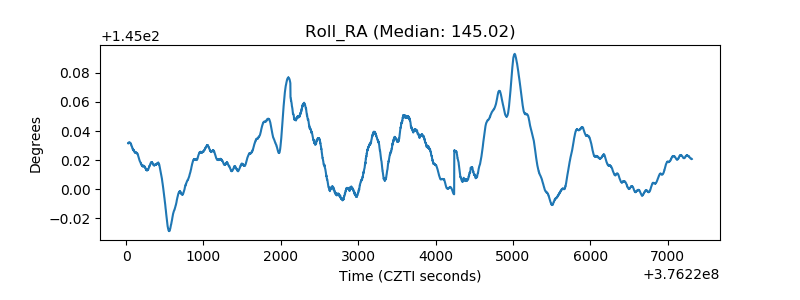 |
| Veto Counter | 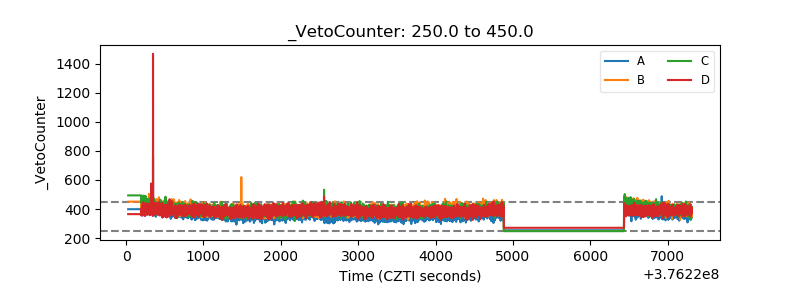 |