| Param | Original file | Final file |
|---|---|---|
| Filename | modeM0/AS1A11_046T04_9000004792_33429cztM0_level2.evt | modeM0/AS1A11_046T04_9000004792_33429cztM0_level2_quad_clean.evt |
| Size (bytes) | 571,438,080 | 84,818,880 |
| Size | 545.0 MB | 80.9 MB |
| Events in quadrant A | 2,972,650 | 565,060 |
| Events in quadrant B | 4,367,244 | 539,888 |
| Events in quadrant C | 3,021,062 | 548,818 |
| Events in quadrant D | 6,551,563 | 507,767 |
| Mode M0 | |||
|---|---|---|---|
| Quadrant | BADHDUFLAG | Total packets | Discarded packets |
| A | 0 | 12029 | 2 |
| B | 0 | 16817 | 1 |
| C | 0 | 12401 | 1 |
| D | 0 | 23512 | 1 |
| Mode M9 | |||
|---|---|---|---|
| Quadrant | BADHDUFLAG | Total packets | Discarded packets |
| A | 0 | 13 | 0 |
| B | 0 | 13 | 0 |
| C | 0 | 13 | 0 |
| D | 0 | 13 | 0 |
| Mode SS | |||
|---|---|---|---|
| Quadrant | BADHDUFLAG | Total packets | Discarded packets |
| A | 0 | 118 | 0 |
| B | 0 | 118 | 0 |
| C | 0 | 118 | 0 |
| D | 0 | 118 | 0 |
| Quadrant | Total seconds | Saturated seconds | Saturation percentage |
|---|---|---|---|
| A | 5819 | 3 | 0.051555% |
| B | 5819 | 446 | 7.664547% |
| C | 5819 | 29 | 0.498367% |
| D | 5819 | 514 | 8.833133% |
Noise dominated data is calculated using 1-second bins in cleaned event files. If a bin has >2000 counts, and if more than 50% of those come from <1% of pixels, then it is considered to be noise-dominated and hence unusable.
| Quadrant | # 1 sec bins | Bins with >0 counts | Bins with >2000 counts | High rate bins dominated by noise | Noise dominated (total time) | Noise dominated (detector-on time) | Marked lightcurve |
|---|---|---|---|---|---|---|---|
| A | 7102 | 5820 | 0 | 0 | 0.00% | 0.00% | 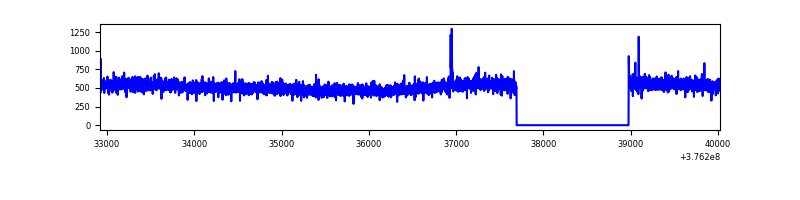 |
| B | 7102 | 5820 | 349 | 349 | 4.91% | 6.00% | 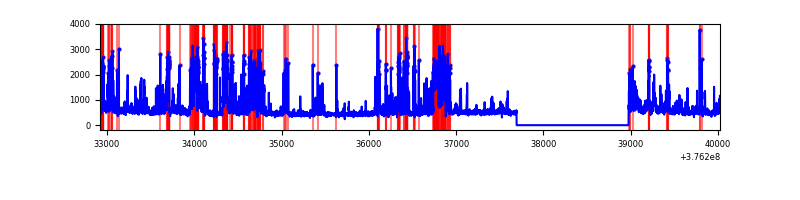 |
| C | 7102 | 5820 | 29 | 29 | 0.41% | 0.50% | 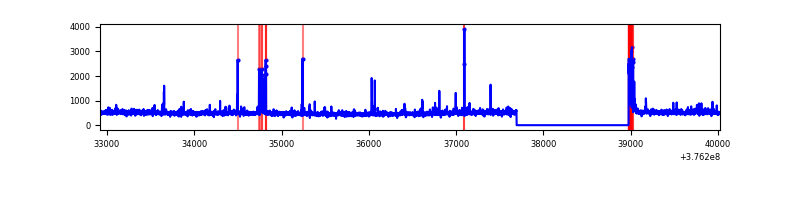 |
| D | 7102 | 5820 | 462 | 462 | 6.51% | 7.94% | 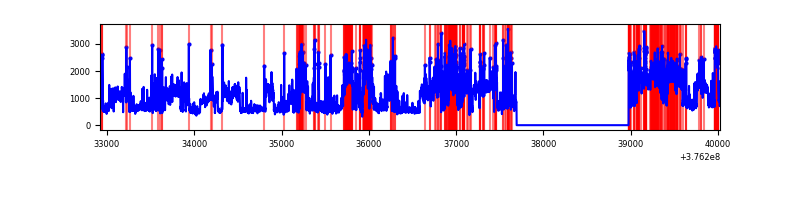 |
Top three noisy pixels from each quadrant. If the there are fewer than three noisy pixels in the level2.evt file, extra rows are filled as -1
| Pixel properties | Quadrant properties | ||||||
|---|---|---|---|---|---|---|---|
| Quadrant | DetID | PixID | Counts | Sigma | Mean | Median | Sigma |
| A | 15 | 47 | 367820 | 2707.08 | 669 | 656 | 135.6 |
| A | 13 | 254 | 11201 | 77.75 | 669 | 656 | 135.6 |
| A | 7 | 16 | 9542 | 65.52 | 669 | 656 | 135.6 |
| B | 5 | 172 | 1287161 | 10366.51 | 646 | 629 | 124.1 |
| B | 5 | 255 | 179018 | 1437.41 | 646 | 629 | 124.1 |
| B | 0 | 213 | 153358 | 1230.65 | 646 | 629 | 124.1 |
| C | 15 | 214 | 250901 | 1674.71 | 646 | 649 | 149.4 |
| C | 1 | 23 | 91290 | 606.58 | 646 | 649 | 149.4 |
| C | 0 | 10 | 82986 | 551.01 | 646 | 649 | 149.4 |
| D | 8 | 195 | 2563810 | 16411.52 | 634 | 617 | 156.2 |
| D | 1 | 52 | 420467 | 2688.2 | 634 | 617 | 156.2 |
| D | 13 | 249 | 280612 | 1792.74 | 634 | 617 | 156.2 |
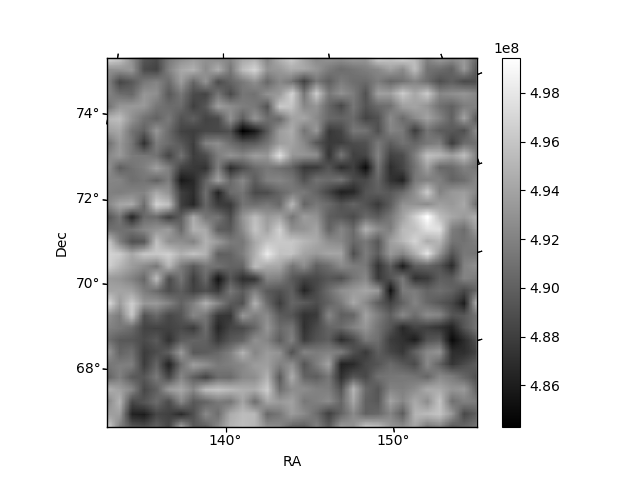
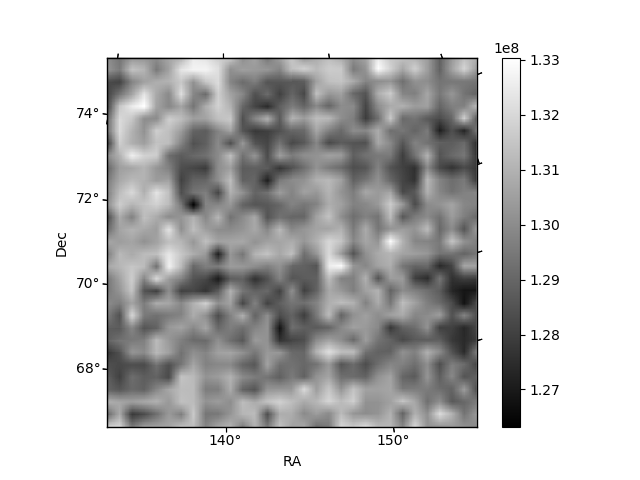
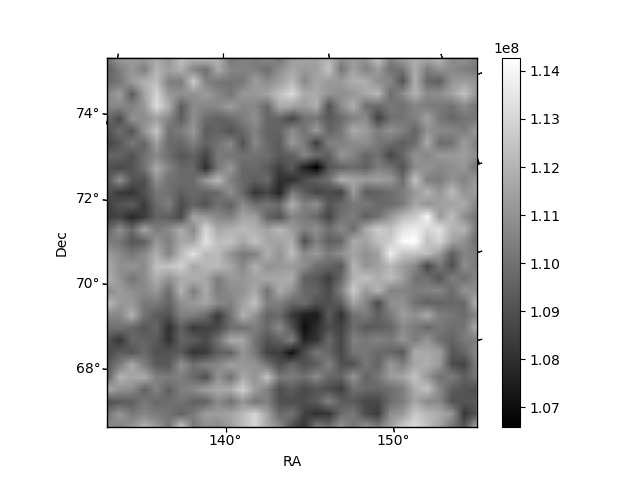
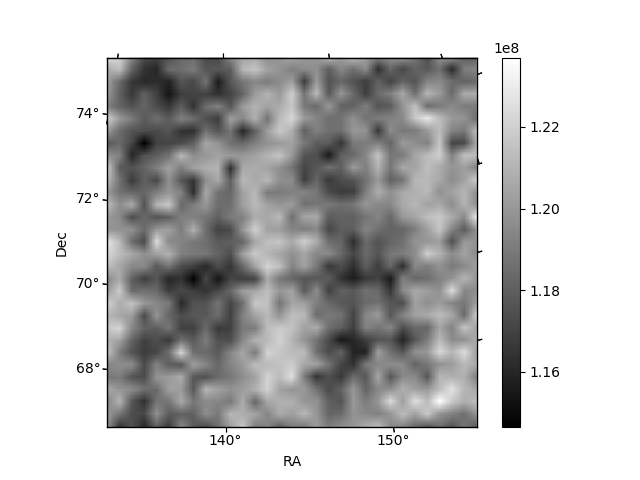
Histogram calculated using DETX and DETY for each event in the final _common_clean file
| Quadrant A | 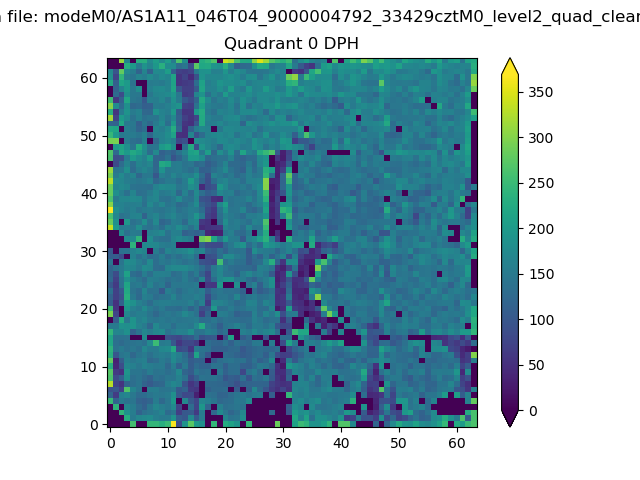 |
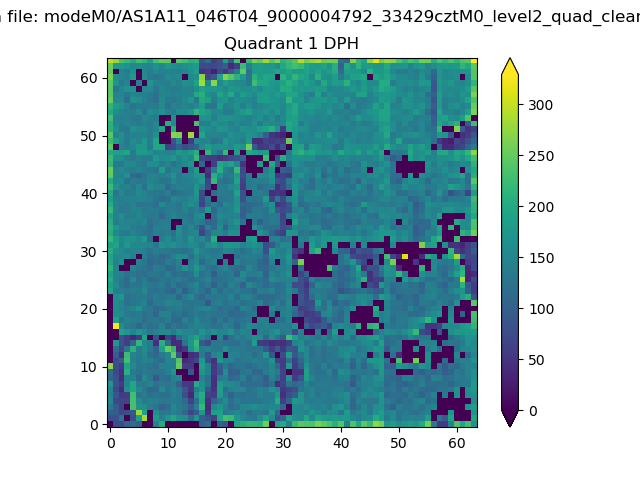 |
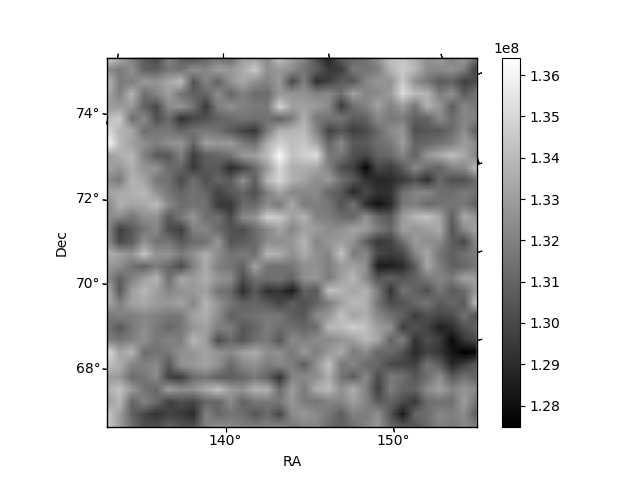
Quadrant B |
|---|---|---|---|
| Quadrant D | 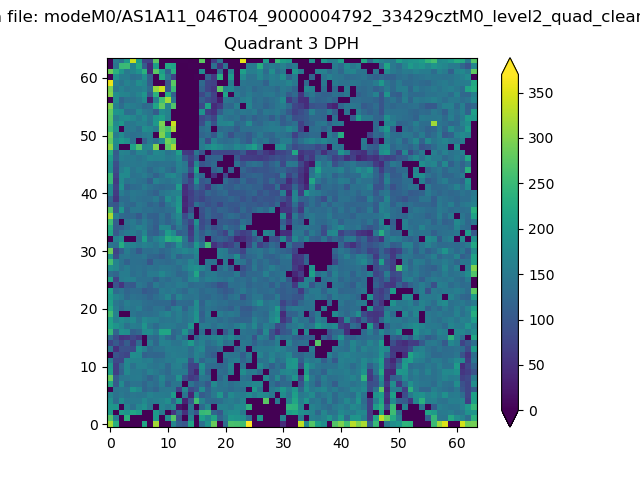 |
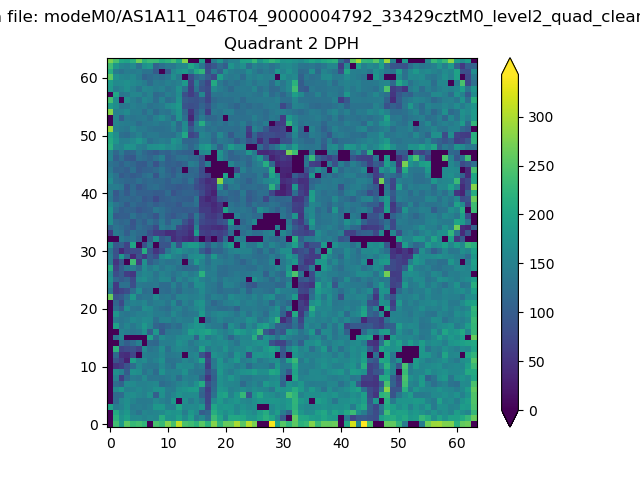 |
Quadrant C |
| Plot type | Count rate plots | Images |
|---|---|---|
| Comparison with Poisson distribution Blue bars denote a histogram of data divided into 1 sec bins. Red curve is a Poisson curve with rate = median count rate of data. |
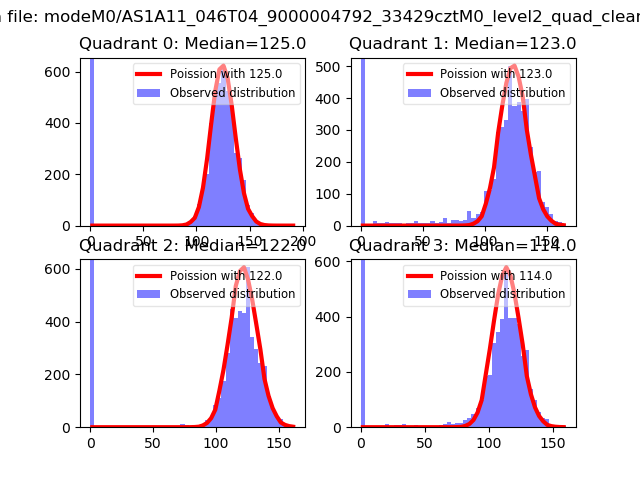 |
 |
| Quadrant-wise count rates Data is divided into 100 sec bins |
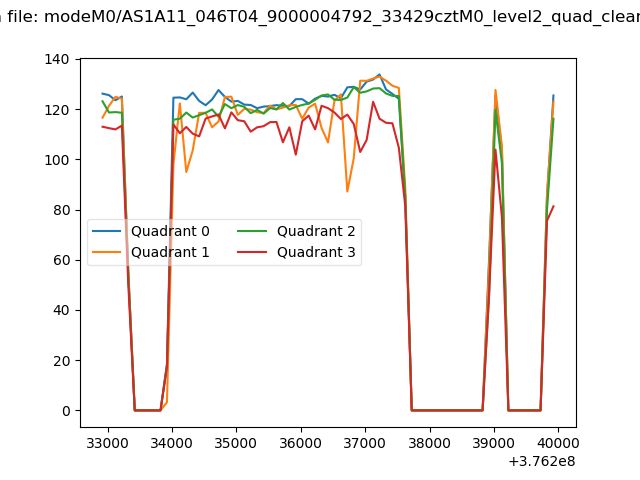 |
|
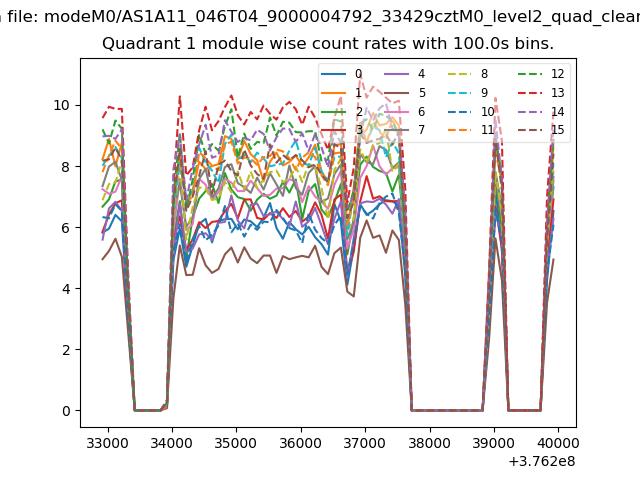
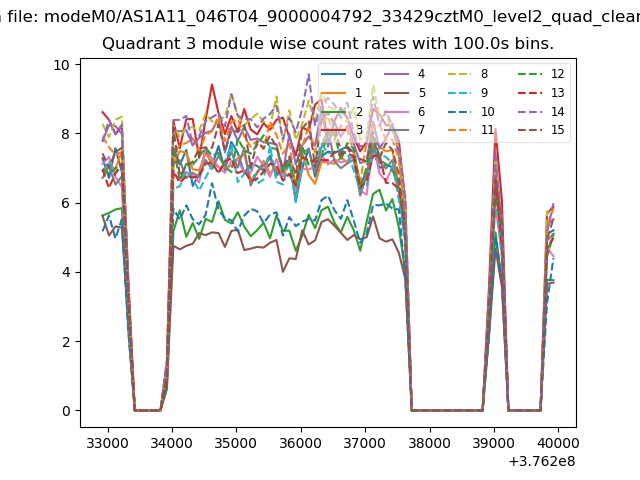
| Module-wise count rates for Quadrant A Data is divided into 100 sec bins |
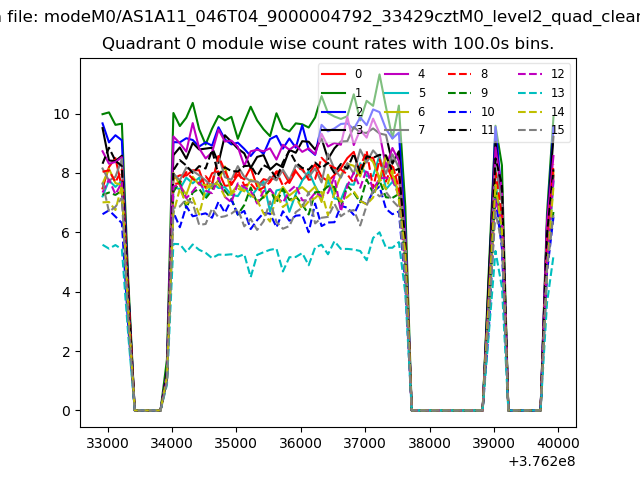 |
 |
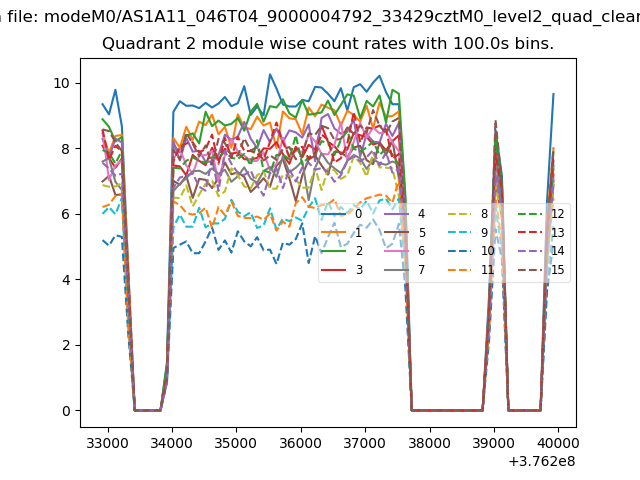
| Module-wise count rates for Quadrant B Data is divided into 100 sec bins |
 |
 |
| Module-wise count rates for Quadrant C Data is divided into 100 sec bins |
 |
 |
| Module-wise count rates for Quadrant D Data is divided into 100 sec bins |
 |
 |
| Parameter | Plot |
|---|---|
| CZT HV Monitor |  |
| D_VDD | 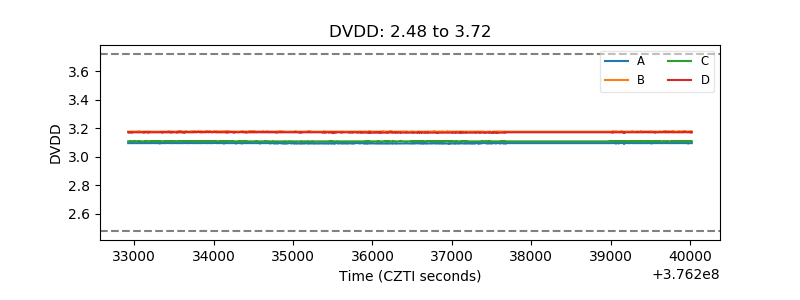 |
| Temperature 1 | 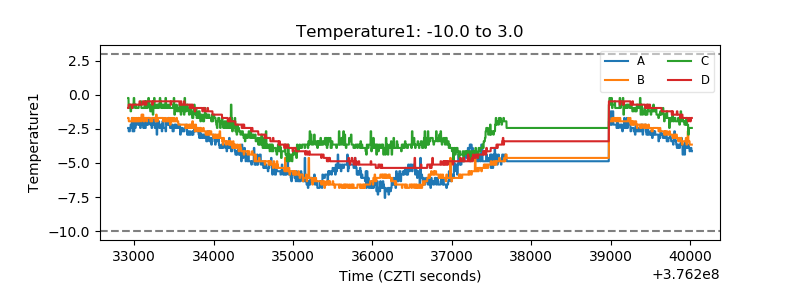 |
| Veto HV Monitor | 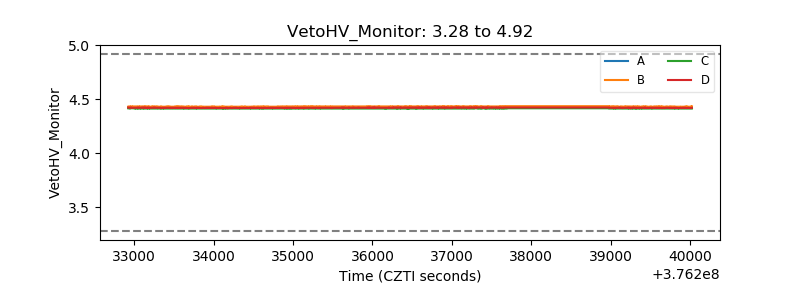 |
| Veto LLD | 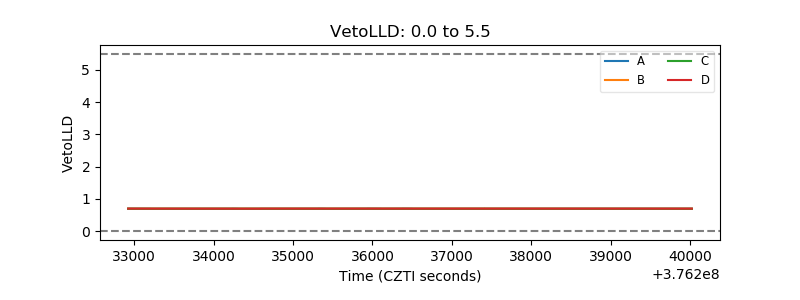 |
| Alpha Counter | 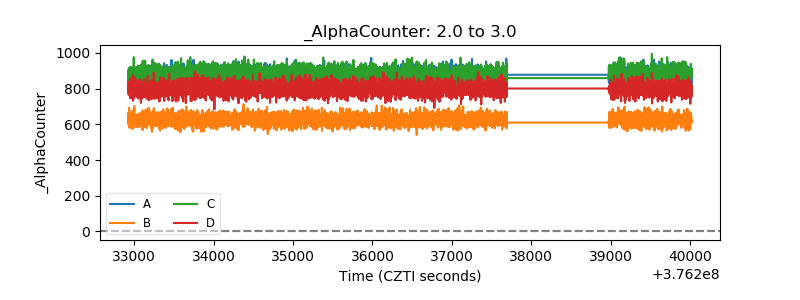 |
| _CPM_Rate | 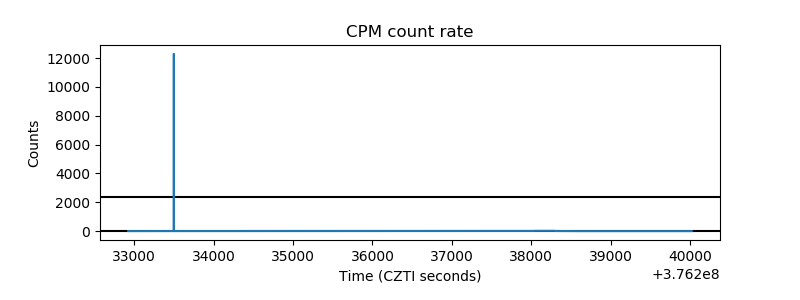 |
| CZT Counter | 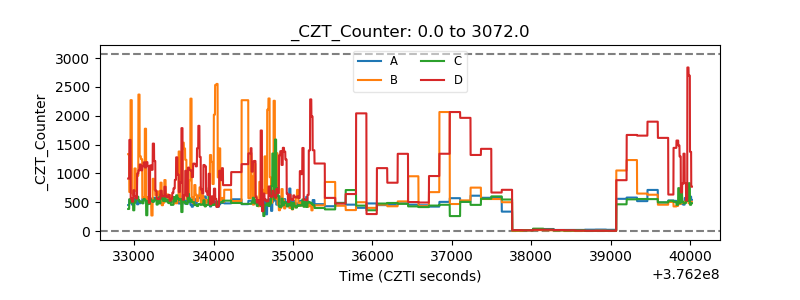 |
| +2.5 Volts monitor |  |
| +5 Volts monitor |  |
| _ROLL_ROT |  |
| _Roll_DEC |  |
| _Roll_RA | 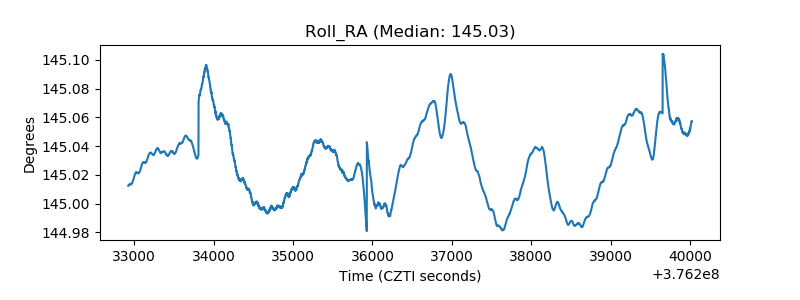 |
| Veto Counter |  |