| Param | Original file | Final file |
|---|---|---|
| Filename | modeM0/AS1A11_046T04_9000004792_33431cztM0_level2.evt | modeM0/AS1A11_046T04_9000004792_33431cztM0_level2_quad_clean.evt |
| Size (bytes) | 879,402,240 | 142,202,880 |
| Size | 838.7 MB | 135.6 MB |
| Events in quadrant A | 4,362,935 | 958,708 |
| Events in quadrant B | 6,108,805 | 936,717 |
| Events in quadrant C | 4,680,220 | 936,714 |
| Events in quadrant D | 10,882,915 | 858,746 |
| Mode M0 | |||
|---|---|---|---|
| Quadrant | BADHDUFLAG | Total packets | Discarded packets |
| A | 0 | 18204 | 3 |
| B | 0 | 23999 | 2 |
| C | 0 | 19455 | 2 |
| D | 0 | 38573 | 2 |
| Mode M9 | |||
|---|---|---|---|
| Quadrant | BADHDUFLAG | Total packets | Discarded packets |
| A | 0 | 14 | 0 |
| B | 0 | 14 | 0 |
| C | 0 | 14 | 0 |
| D | 0 | 15 | 0 |
| Mode SS | |||
|---|---|---|---|
| Quadrant | BADHDUFLAG | Total packets | Discarded packets |
| A | 0 | 178 | 0 |
| B | 0 | 178 | 0 |
| C | 0 | 178 | 0 |
| D | 0 | 178 | 0 |
| Quadrant | Total seconds | Saturated seconds | Saturation percentage |
|---|---|---|---|
| A | 8876 | 11 | 0.123930% |
| B | 8876 | 386 | 4.348806% |
| C | 8876 | 68 | 0.766111% |
| D | 8876 | 1036 | 11.671924% |
Noise dominated data is calculated using 1-second bins in cleaned event files. If a bin has >2000 counts, and if more than 50% of those come from <1% of pixels, then it is considered to be noise-dominated and hence unusable.
| Quadrant | # 1 sec bins | Bins with >0 counts | Bins with >2000 counts | High rate bins dominated by noise | Noise dominated (total time) | Noise dominated (detector-on time) | Marked lightcurve |
|---|---|---|---|---|---|---|---|
| A | 10248 | 8877 | 0 | 0 | 0.00% | 0.00% | 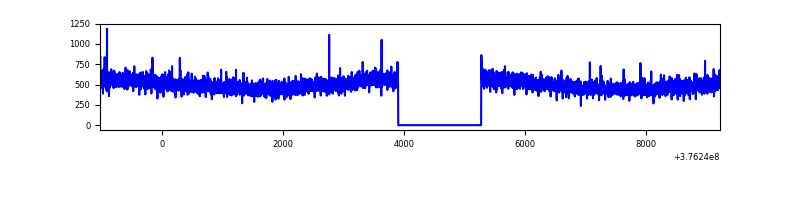 |
| B | 10248 | 8877 | 272 | 272 | 2.65% | 3.06% | 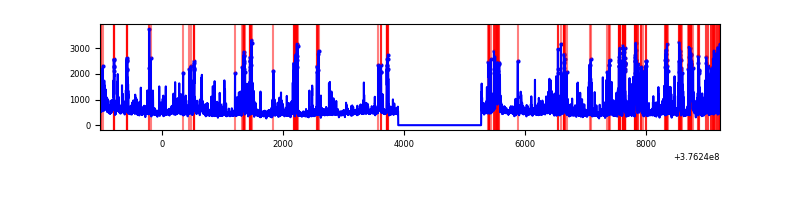 |
| C | 10248 | 8877 | 59 | 59 | 0.58% | 0.66% |  |
| D | 10248 | 8877 | 986 | 986 | 9.62% | 11.11% | 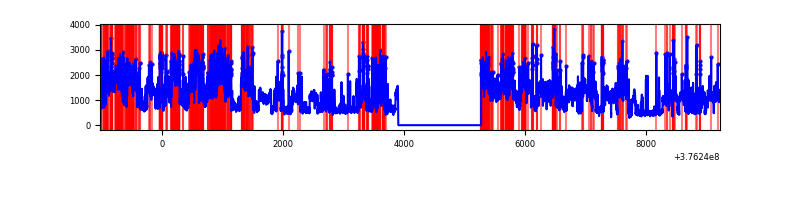 |
Top three noisy pixels from each quadrant. If the there are fewer than three noisy pixels in the level2.evt file, extra rows are filled as -1
| Pixel properties | Quadrant properties | ||||||
|---|---|---|---|---|---|---|---|
| Quadrant | DetID | PixID | Counts | Sigma | Mean | Median | Sigma |
| A | 15 | 47 | 498939 | 2506.66 | 993 | 971 | 198.7 |
| A | 13 | 6 | 17694 | 84.18 | 993 | 971 | 198.7 |
| A | 13 | 254 | 16545 | 78.4 | 993 | 971 | 198.7 |
| B | 5 | 255 | 1174441 | 6274.77 | 981 | 955 | 187.0 |
| B | 5 | 172 | 623138 | 3326.89 | 981 | 955 | 187.0 |
| B | 0 | 213 | 198896 | 1058.41 | 981 | 955 | 187.0 |
| C | 15 | 214 | 376646 | 1678.82 | 964 | 970 | 223.8 |
| C | 1 | 23 | 232071 | 1032.75 | 964 | 970 | 223.8 |
| C | 14 | 254 | 108817 | 481.95 | 964 | 970 | 223.8 |
| D | 8 | 195 | 4126203 | 17956.53 | 932 | 904 | 229.7 |
| D | 1 | 52 | 1300831 | 5658.3 | 932 | 904 | 229.7 |
| D | 13 | 249 | 647481 | 2814.41 | 932 | 904 | 229.7 |
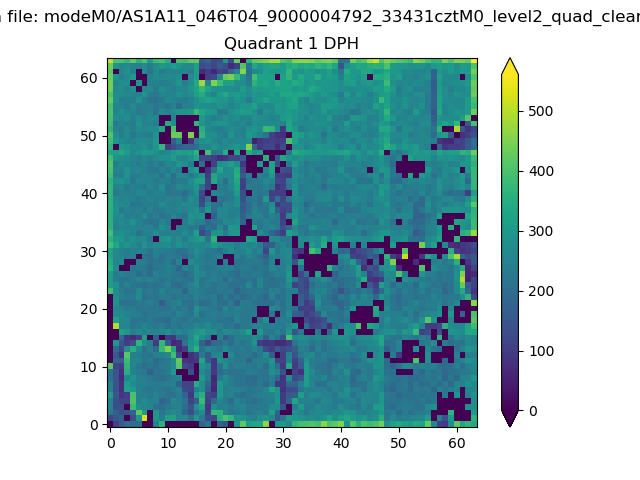
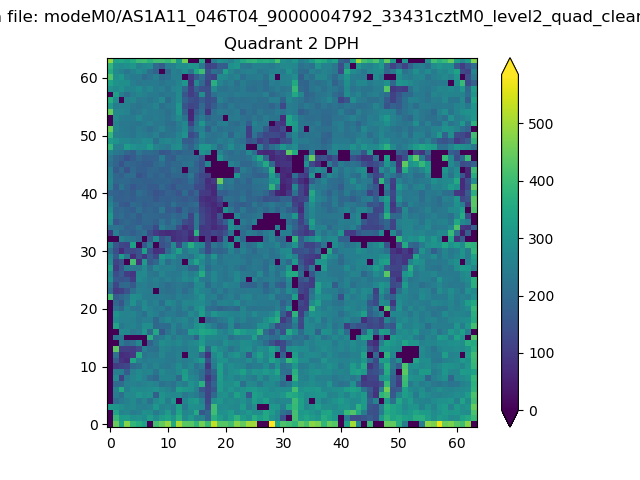
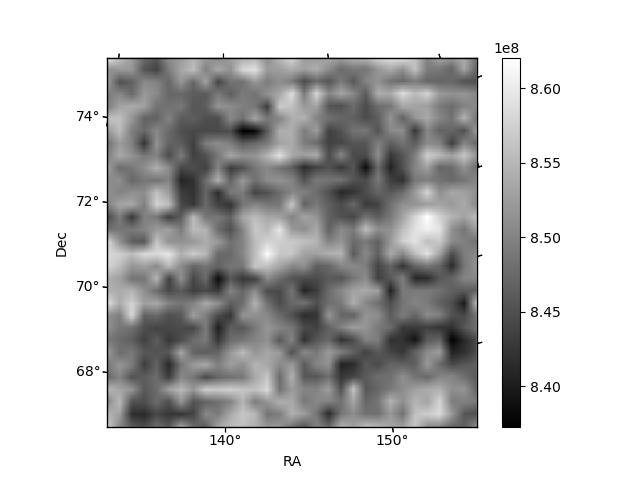
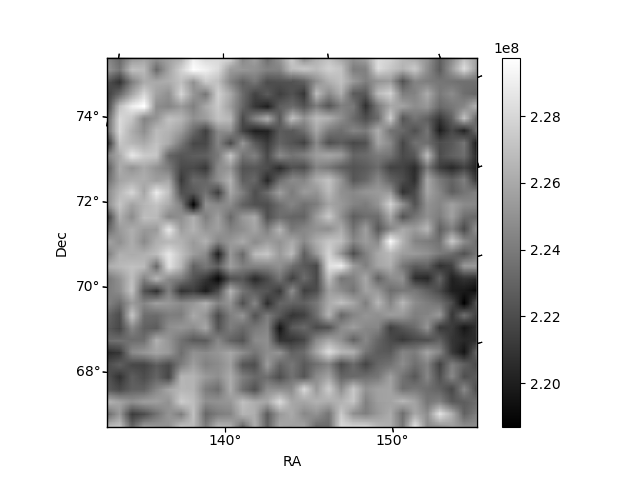
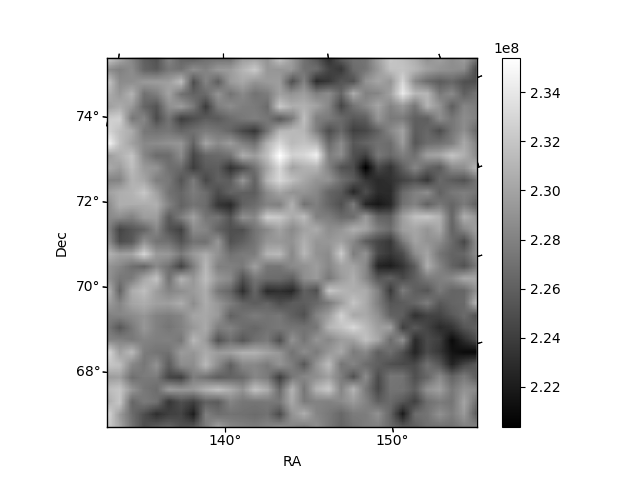
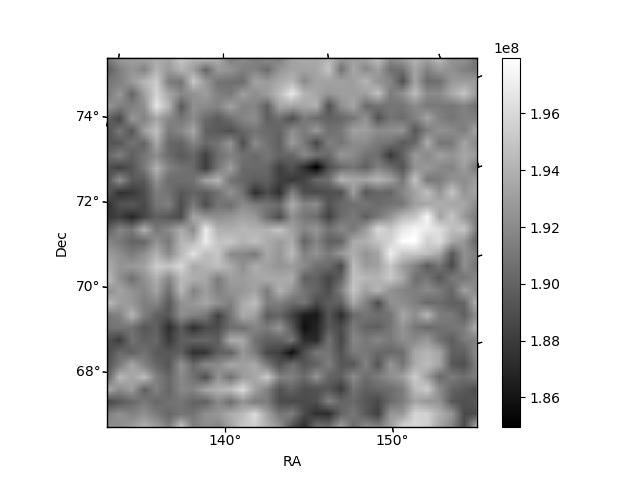
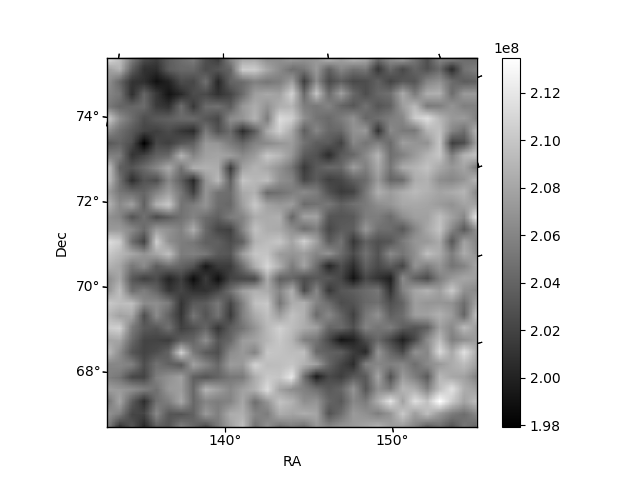
Histogram calculated using DETX and DETY for each event in the final _common_clean file
| Quadrant A | 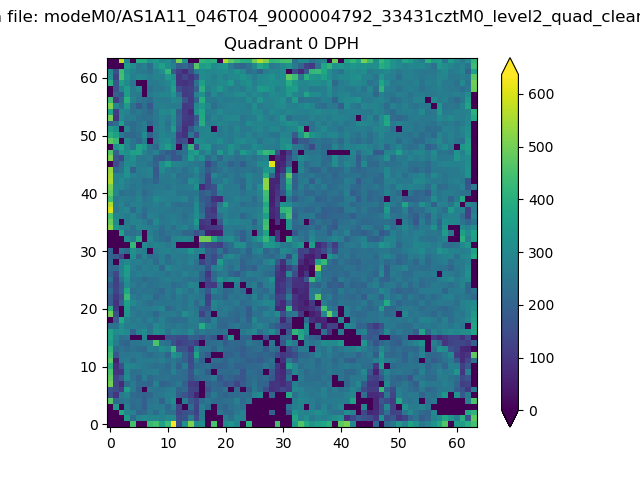 |
 |
Quadrant B |
|---|---|---|---|
| Quadrant D | 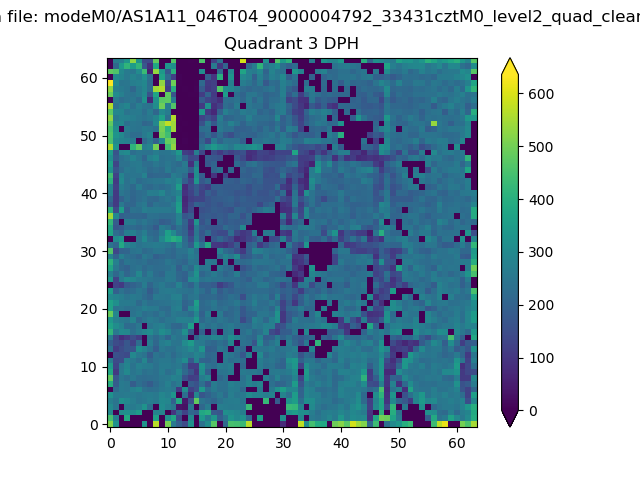 |
 |
Quadrant C |
| Plot type | Count rate plots | Images |
|---|---|---|
| Comparison with Poisson distribution Blue bars denote a histogram of data divided into 1 sec bins. Red curve is a Poisson curve with rate = median count rate of data. |
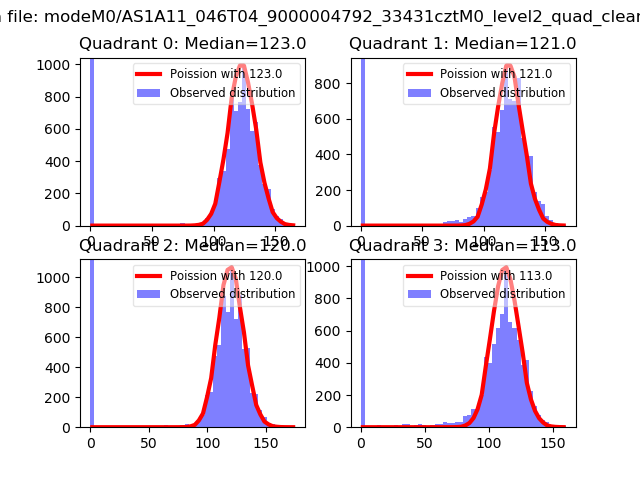 |
 |
| Quadrant-wise count rates Data is divided into 100 sec bins |
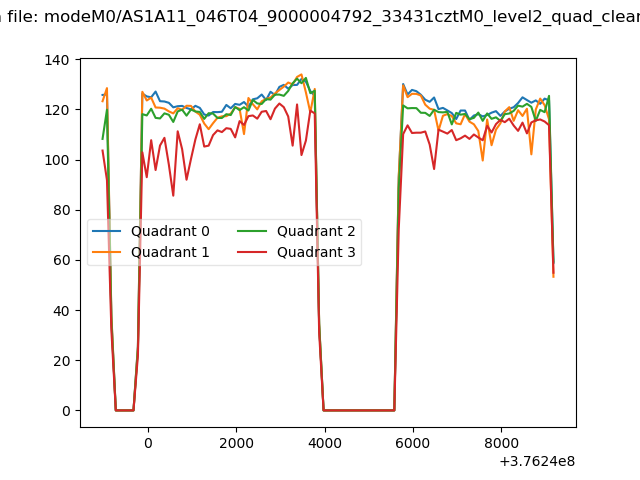 |
|
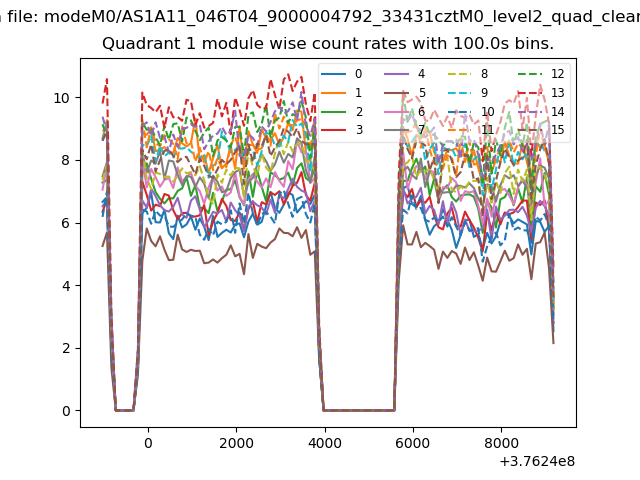
| Module-wise count rates for Quadrant A Data is divided into 100 sec bins |
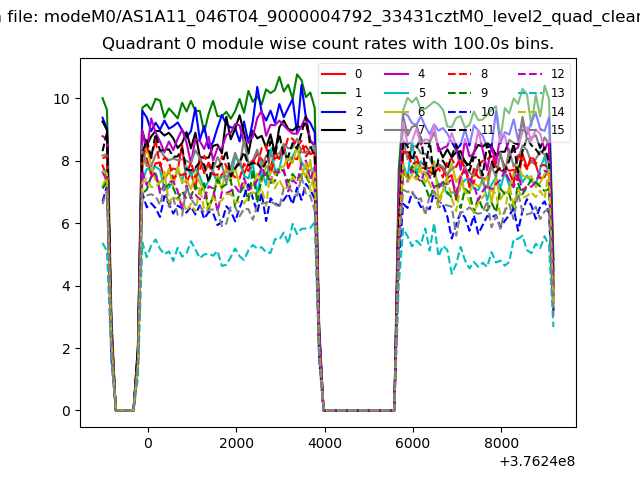 |
 |
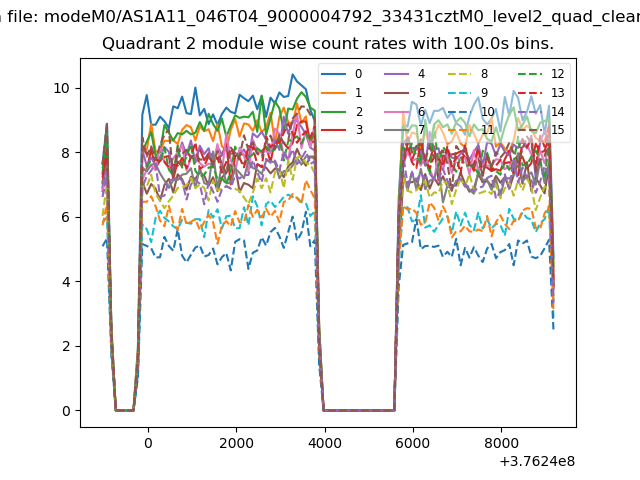
| Module-wise count rates for Quadrant B Data is divided into 100 sec bins |
 |
 |
| Module-wise count rates for Quadrant C Data is divided into 100 sec bins |
 |
 |
| Module-wise count rates for Quadrant D Data is divided into 100 sec bins |
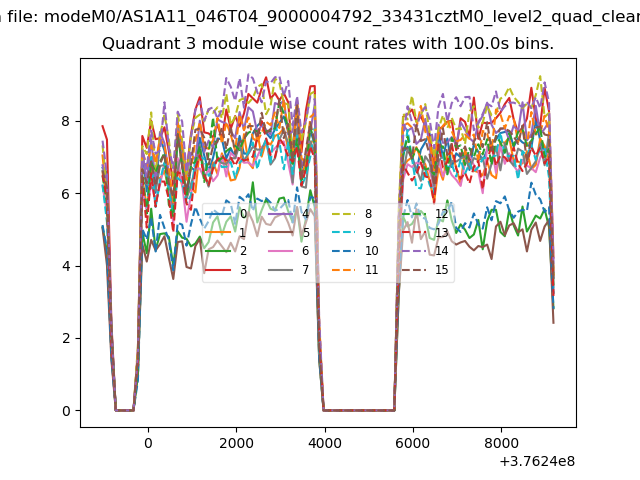 |
 |
| Parameter | Plot |
|---|---|
| CZT HV Monitor | 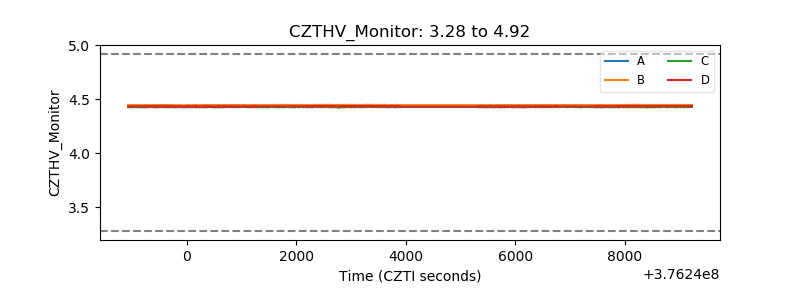 |
| D_VDD | 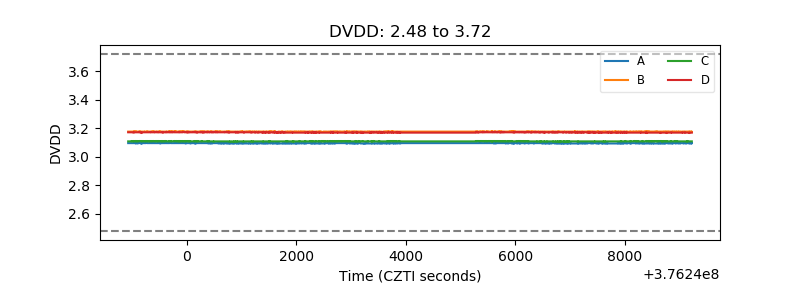 |
| Temperature 1 | 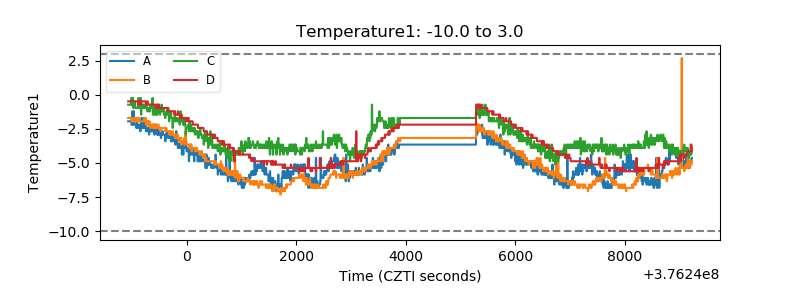 |
| Veto HV Monitor | 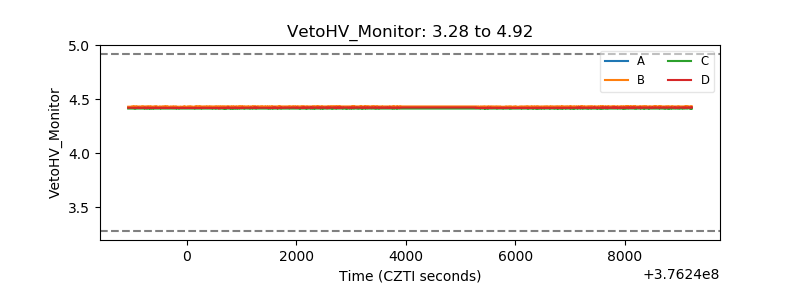 |
| Veto LLD | 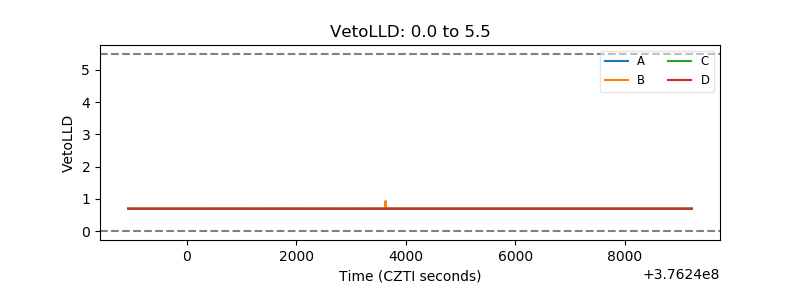 |
| Alpha Counter | 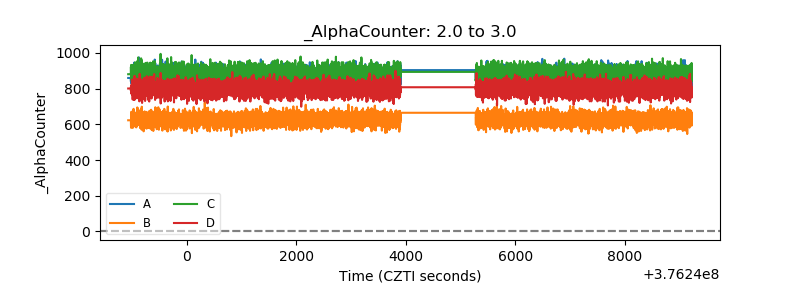 |
| _CPM_Rate | 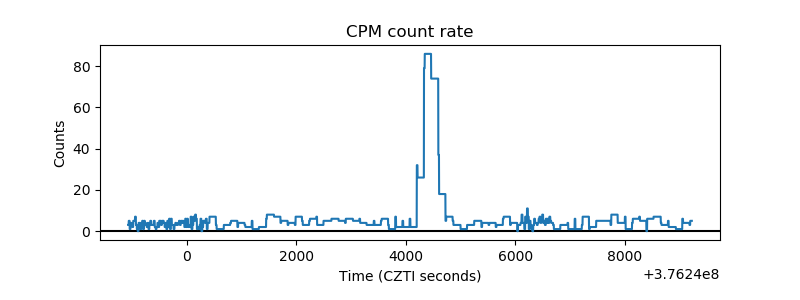 |
| CZT Counter | 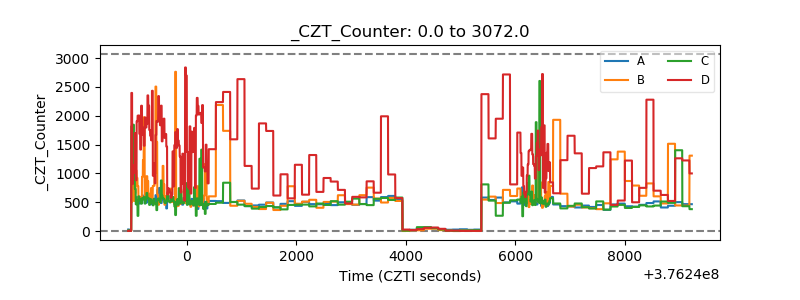 |
| +2.5 Volts monitor |  |
| +5 Volts monitor |  |
| _ROLL_ROT | 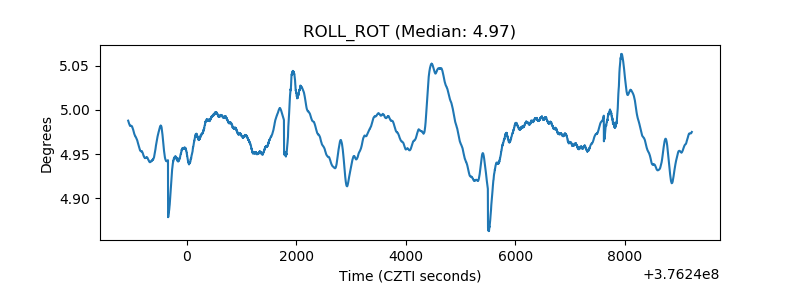 |
| _Roll_DEC | 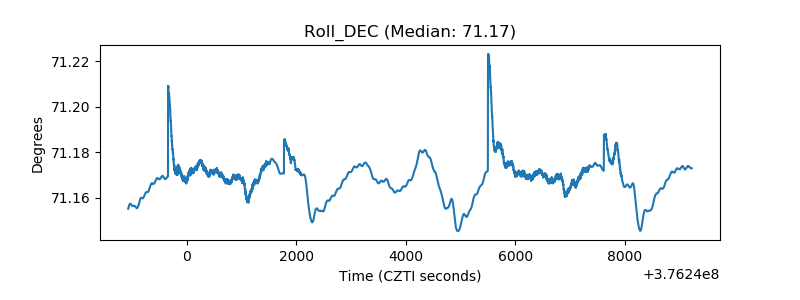 |
| _Roll_RA |  |
| Veto Counter | 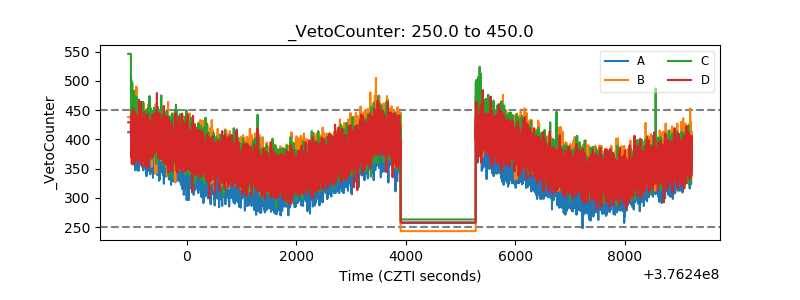 |