| Param | Original file | Final file |
|---|---|---|
| Filename | modeM0/AS1A11_046T04_9000004792_33432cztM0_level2.evt | modeM0/AS1A11_046T04_9000004792_33432cztM0_level2_quad_clean.evt |
| Size (bytes) | 631,497,600 | 123,477,120 |
| Size | 602.2 MB | 117.8 MB |
| Events in quadrant A | 3,460,489 | 844,227 |
| Events in quadrant B | 4,911,506 | 817,390 |
| Events in quadrant C | 3,566,368 | 836,068 |
| Events in quadrant D | 6,730,851 | 772,044 |
| Mode M0 | |||
|---|---|---|---|
| Quadrant | BADHDUFLAG | Total packets | Discarded packets |
| A | 0 | 14270 | 3 |
| B | 0 | 19033 | 2 |
| C | 0 | 14718 | 2 |
| D | 0 | 24874 | 2 |
| Mode M9 | |||
|---|---|---|---|
| Quadrant | BADHDUFLAG | Total packets | Discarded packets |
| A | 0 | 30 | 0 |
| B | 0 | 30 | 0 |
| C | 0 | 30 | 0 |
| D | 0 | 30 | 0 |
| Mode SS | |||
|---|---|---|---|
| Quadrant | BADHDUFLAG | Total packets | Discarded packets |
| A | 0 | 140 | 0 |
| B | 0 | 140 | 0 |
| C | 0 | 140 | 0 |
| D | 0 | 140 | 0 |
| Quadrant | Total seconds | Saturated seconds | Saturation percentage |
|---|---|---|---|
| A | 6736 | 7 | 0.103919% |
| B | 6736 | 516 | 7.660333% |
| C | 6736 | 48 | 0.712589% |
| D | 6736 | 397 | 5.893705% |
Noise dominated data is calculated using 1-second bins in cleaned event files. If a bin has >2000 counts, and if more than 50% of those come from <1% of pixels, then it is considered to be noise-dominated and hence unusable.
| Quadrant | # 1 sec bins | Bins with >0 counts | Bins with >2000 counts | High rate bins dominated by noise | Noise dominated (total time) | Noise dominated (detector-on time) | Marked lightcurve |
|---|---|---|---|---|---|---|---|
| A | 9780 | 6738 | 0 | 0 | 0.00% | 0.00% | 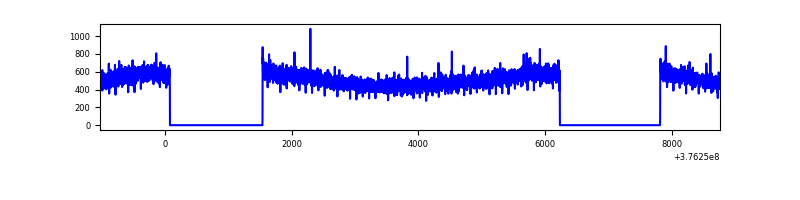 |
| B | 9780 | 6738 | 409 | 409 | 4.18% | 6.07% | 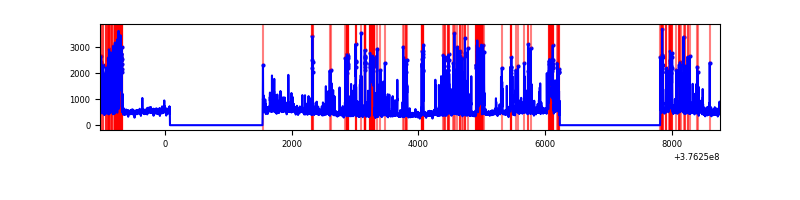 |
| C | 9780 | 6738 | 30 | 30 | 0.31% | 0.45% | 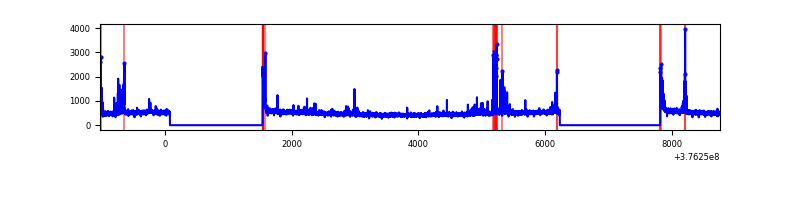 |
| D | 9780 | 6738 | 327 | 327 | 3.34% | 4.85% | 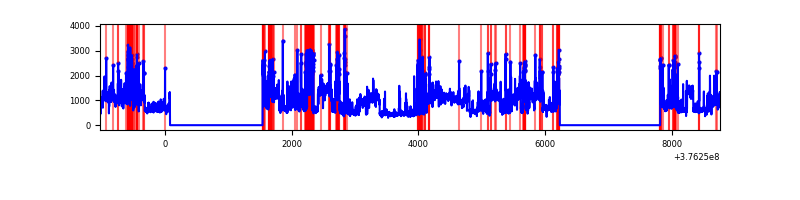 |
Top three noisy pixels from each quadrant. If the there are fewer than three noisy pixels in the level2.evt file, extra rows are filled as -1
| Pixel properties | Quadrant properties | ||||||
|---|---|---|---|---|---|---|---|
| Quadrant | DetID | PixID | Counts | Sigma | Mean | Median | Sigma |
| A | 15 | 47 | 406249 | 2591.92 | 782 | 768 | 156.4 |
| A | 13 | 6 | 19820 | 121.78 | 782 | 768 | 156.4 |
| A | 13 | 254 | 12653 | 75.97 | 782 | 768 | 156.4 |
| B | 5 | 255 | 1103341 | 7641.96 | 754 | 734 | 144.3 |
| B | 5 | 172 | 616894 | 4270.49 | 754 | 734 | 144.3 |
| B | 0 | 219 | 97865 | 673.2 | 754 | 734 | 144.3 |
| C | 15 | 214 | 289205 | 1650.79 | 755 | 758 | 174.7 |
| C | 1 | 23 | 109927 | 624.78 | 755 | 758 | 174.7 |
| C | 14 | 254 | 97284 | 552.42 | 755 | 758 | 174.7 |
| D | 8 | 195 | 2490778 | 13732.55 | 740 | 717 | 181.3 |
| D | 13 | 249 | 346923 | 1909.31 | 740 | 717 | 181.3 |
| D | 2 | 250 | 295847 | 1627.62 | 740 | 717 | 181.3 |
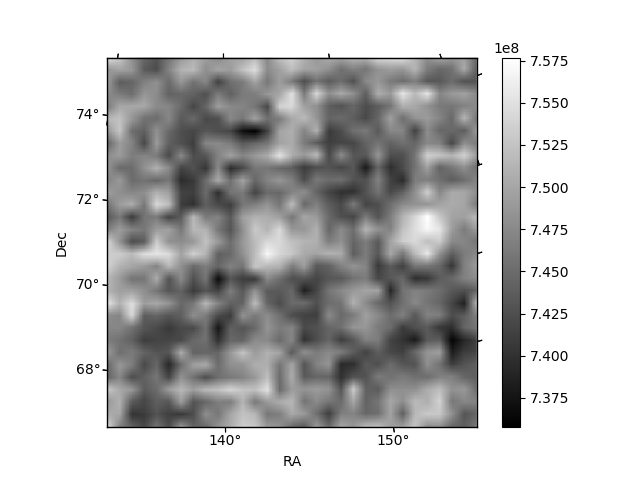
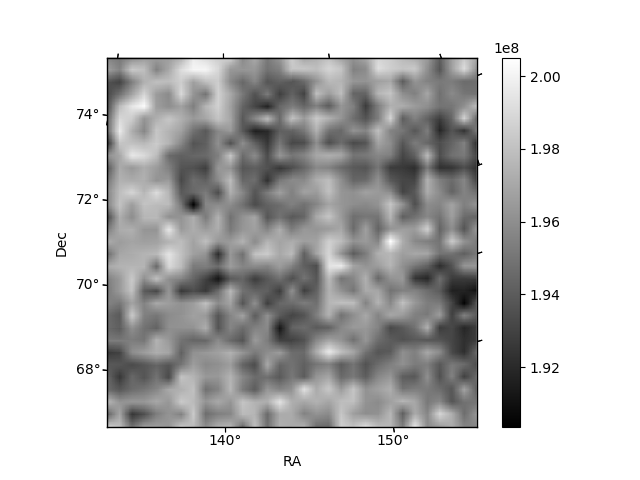
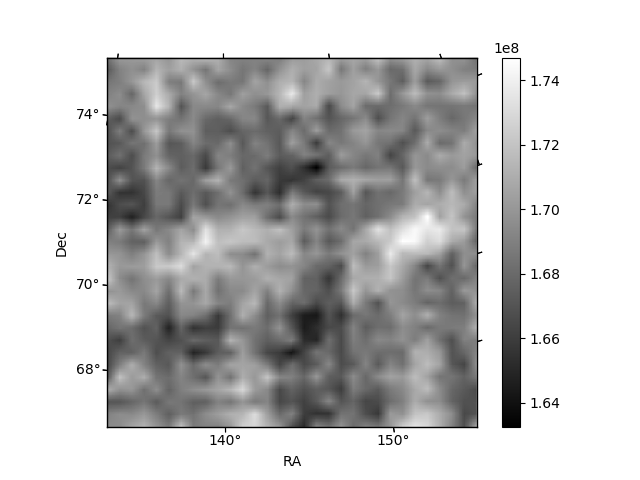
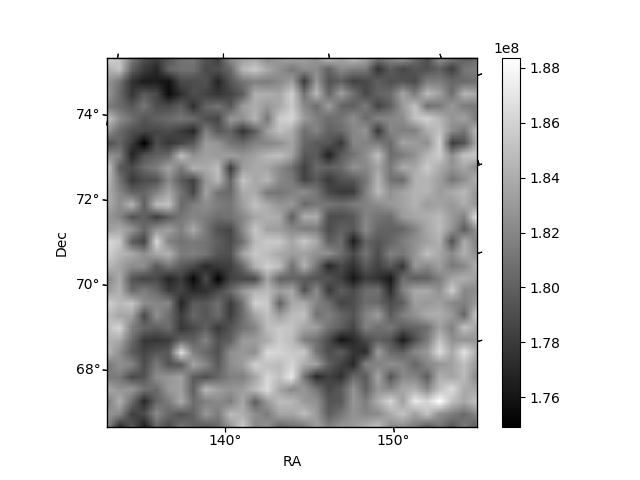
Histogram calculated using DETX and DETY for each event in the final _common_clean file
| Quadrant A | 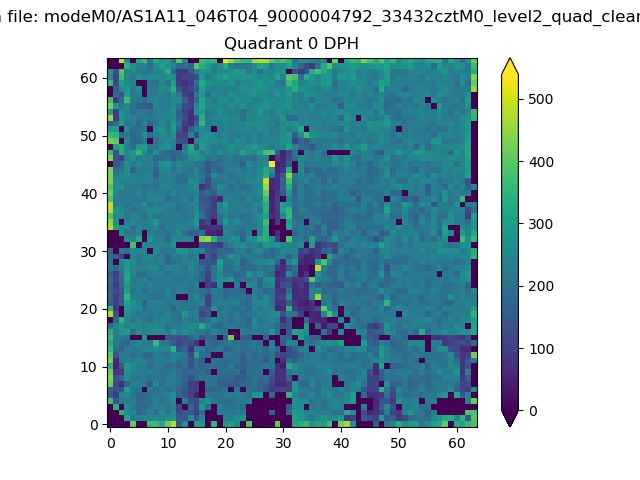 |
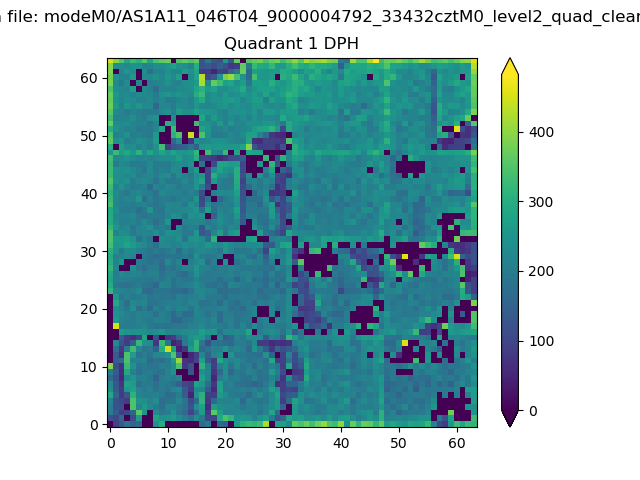 |
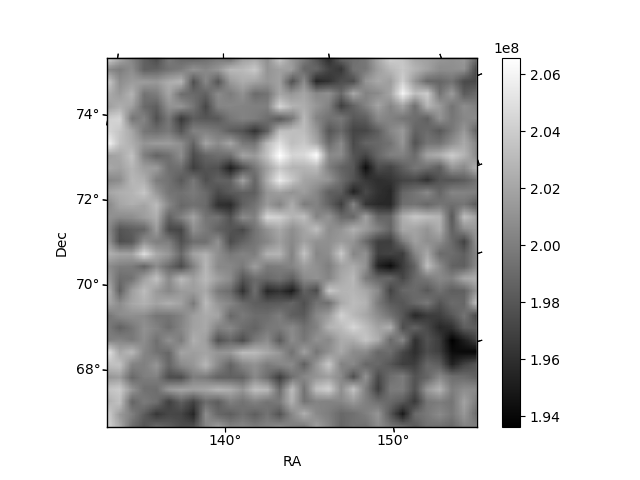
Quadrant B |
|---|---|---|---|
| Quadrant D | 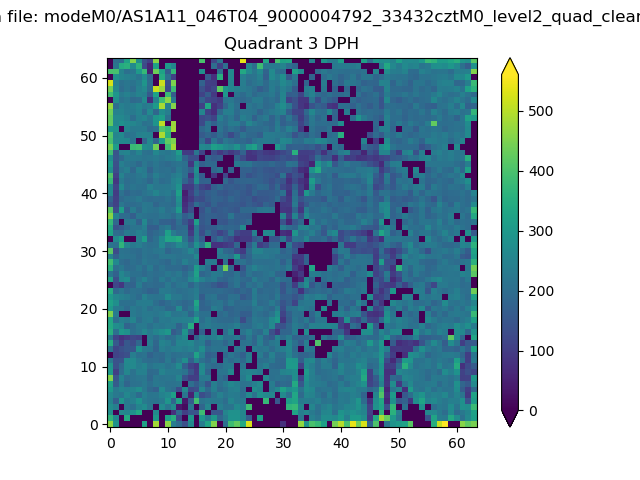 |
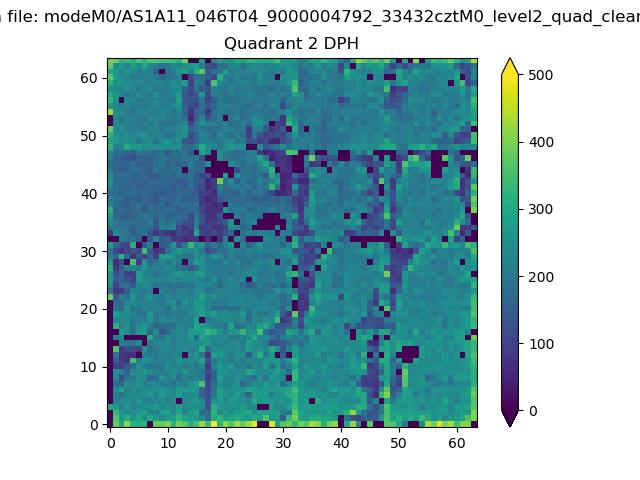 |
Quadrant C |
| Plot type | Count rate plots | Images |
|---|---|---|
| Comparison with Poisson distribution Blue bars denote a histogram of data divided into 1 sec bins. Red curve is a Poisson curve with rate = median count rate of data. |
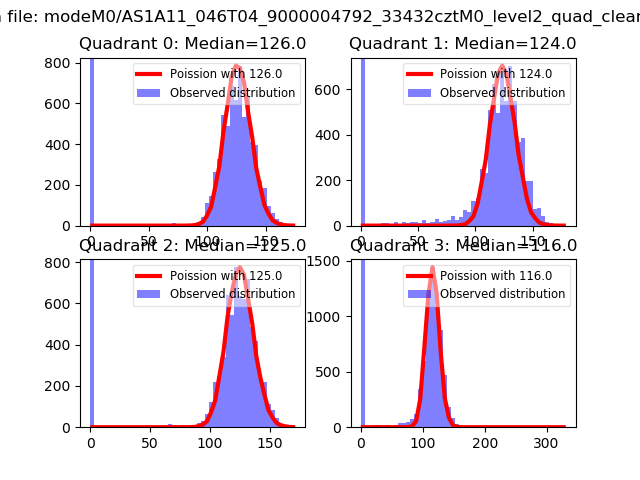 |
 |
| Quadrant-wise count rates Data is divided into 100 sec bins |
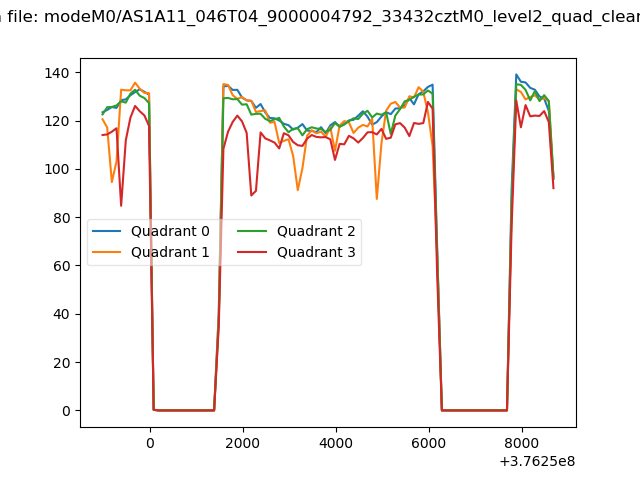 |
|
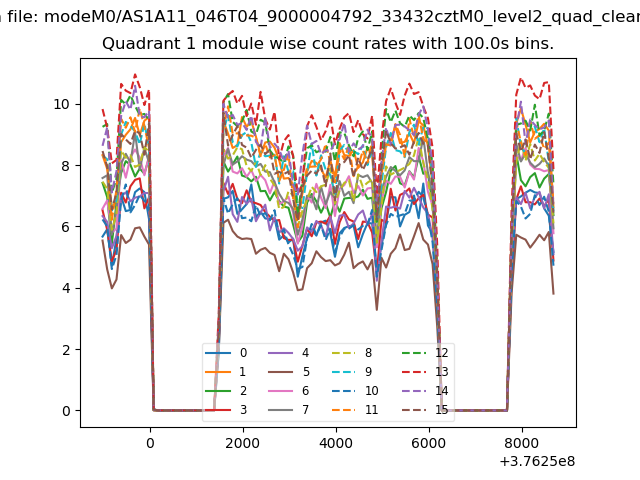
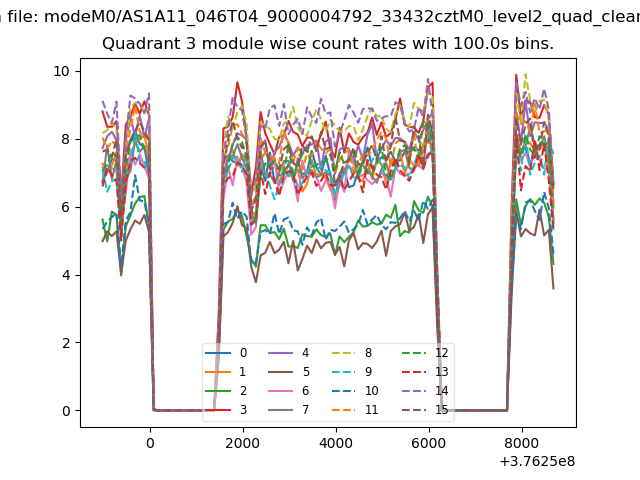
| Module-wise count rates for Quadrant A Data is divided into 100 sec bins |
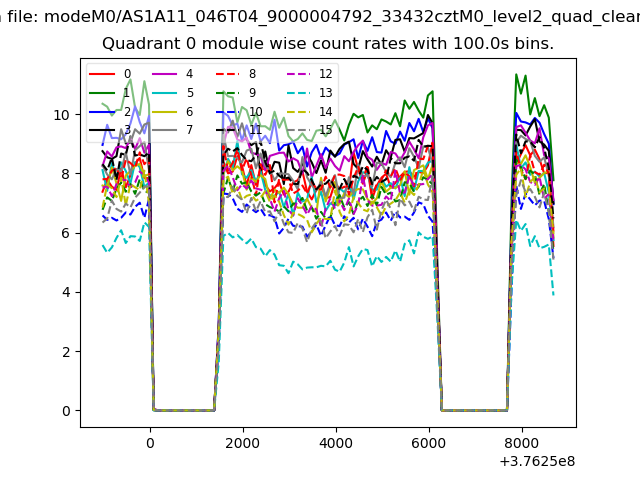 |
 |
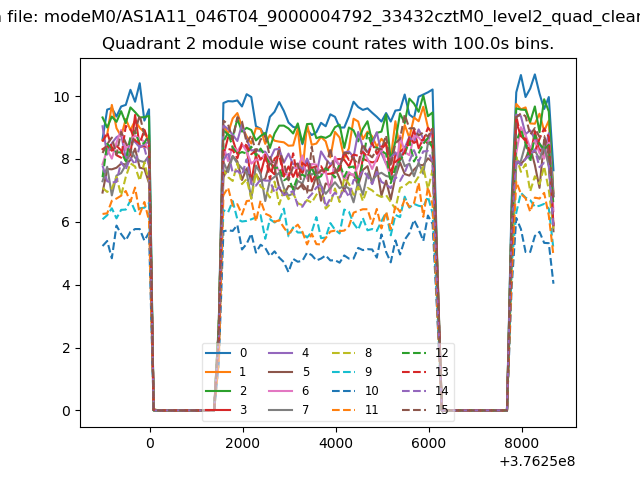
| Module-wise count rates for Quadrant B Data is divided into 100 sec bins |
 |
 |
| Module-wise count rates for Quadrant C Data is divided into 100 sec bins |
 |
 |
| Module-wise count rates for Quadrant D Data is divided into 100 sec bins |
 |
 |
| Parameter | Plot |
|---|---|
| CZT HV Monitor | 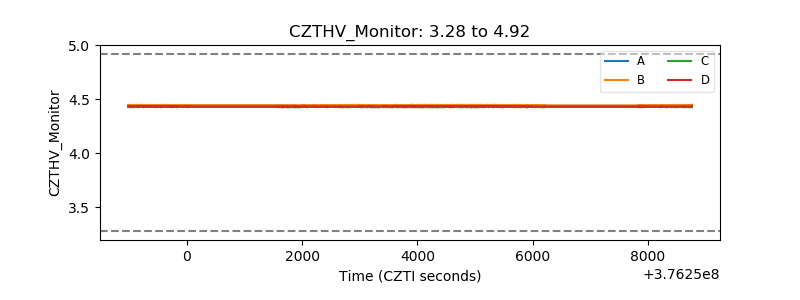 |
| D_VDD | 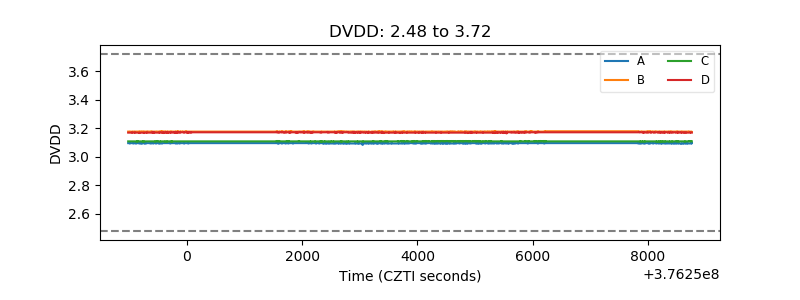 |
| Temperature 1 | 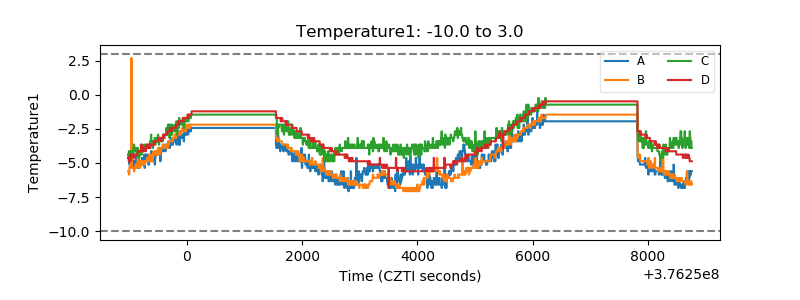 |
| Veto HV Monitor | 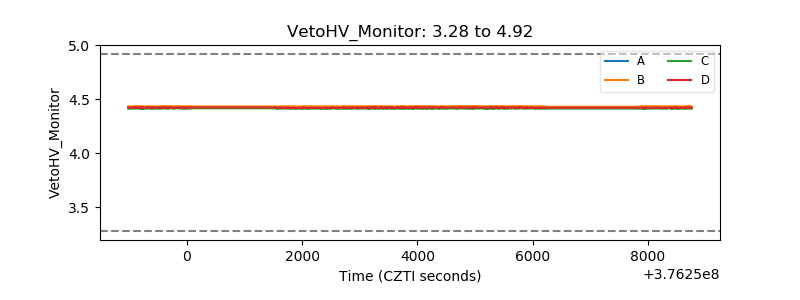 |
| Veto LLD | 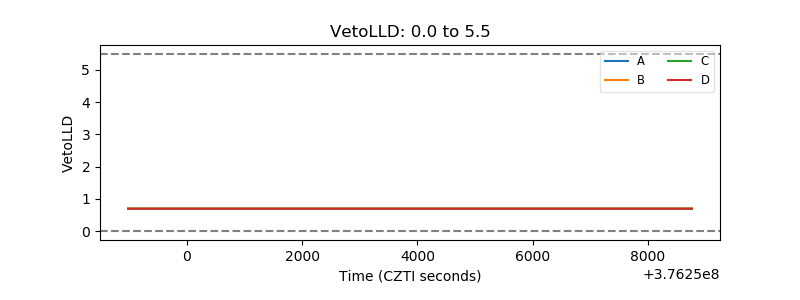 |
| Alpha Counter | 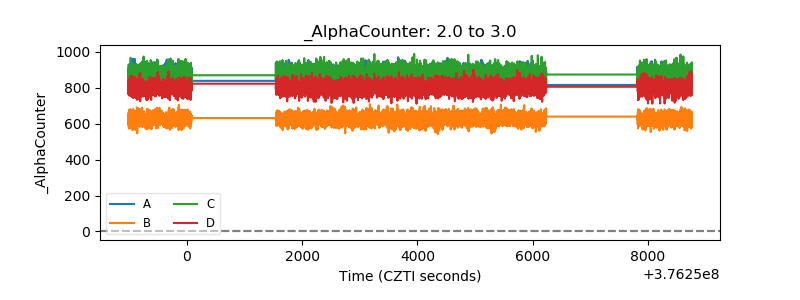 |
| _CPM_Rate | 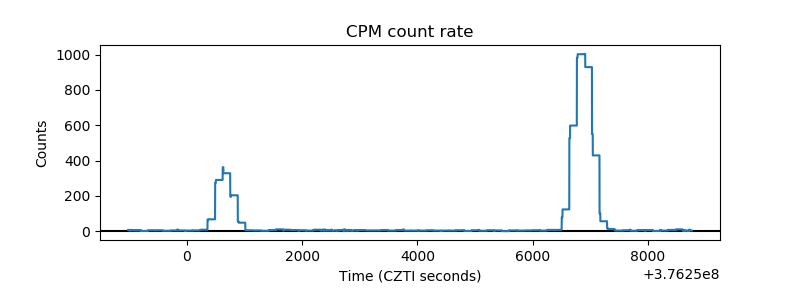 |
| CZT Counter | 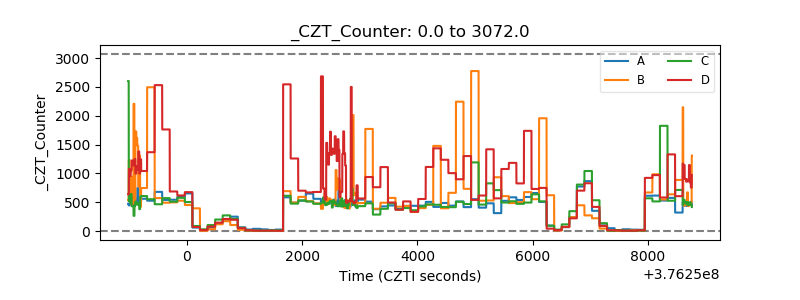 |
| +2.5 Volts monitor |  |
| +5 Volts monitor |  |
| _ROLL_ROT | 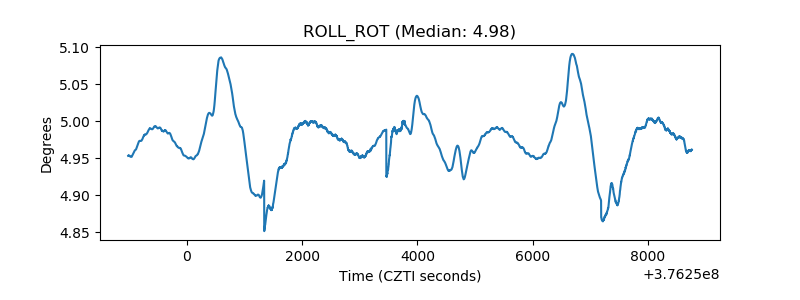 |
| _Roll_DEC | 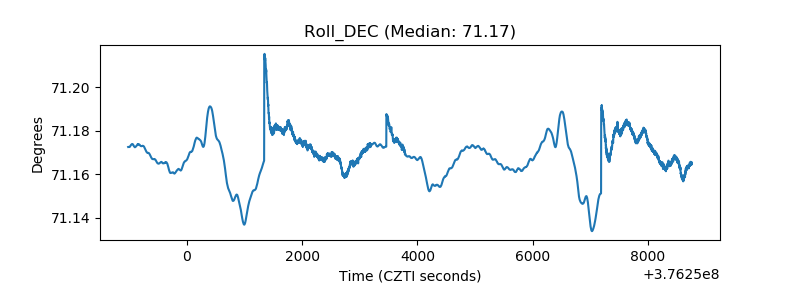 |
| _Roll_RA | 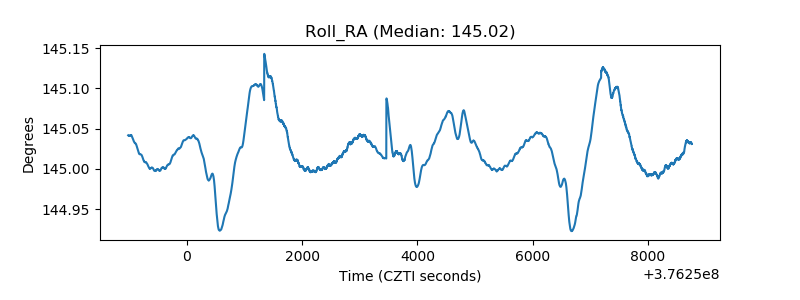 |
| Veto Counter | 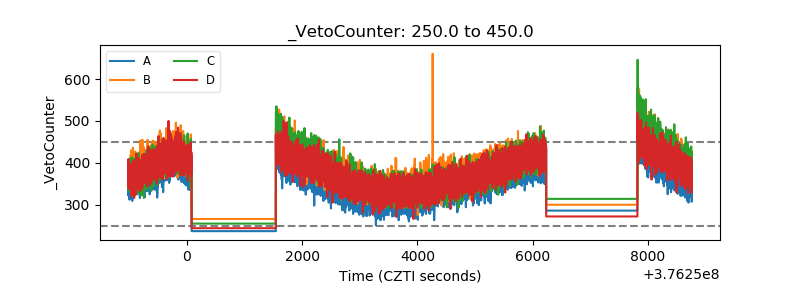 |