| Param | Original file | Final file |
|---|---|---|
| Filename | modeM0/AS1A11_046T04_9000004792_33433cztM0_level2.evt | modeM0/AS1A11_046T04_9000004792_33433cztM0_level2_quad_clean.evt |
| Size (bytes) | 494,406,720 | 101,232,000 |
| Size | 471.5 MB | 96.5 MB |
| Events in quadrant A | 2,700,010 | 687,317 |
| Events in quadrant B | 3,356,359 | 684,211 |
| Events in quadrant C | 2,998,384 | 683,310 |
| Events in quadrant D | 5,550,317 | 630,770 |
| Mode M0 | |||
|---|---|---|---|
| Quadrant | BADHDUFLAG | Total packets | Discarded packets |
| A | 0 | 11266 | 3 |
| B | 0 | 13596 | 2 |
| C | 0 | 12341 | 2 |
| D | 0 | 20185 | 2 |
| Mode M9 | |||
|---|---|---|---|
| Quadrant | BADHDUFLAG | Total packets | Discarded packets |
| A | 0 | 28 | 0 |
| B | 0 | 28 | 0 |
| C | 0 | 28 | 0 |
| D | 0 | 29 | 0 |
| Mode SS | |||
|---|---|---|---|
| Quadrant | BADHDUFLAG | Total packets | Discarded packets |
| A | 0 | 110 | 0 |
| B | 0 | 110 | 0 |
| C | 0 | 110 | 0 |
| D | 0 | 110 | 0 |
| Quadrant | Total seconds | Saturated seconds | Saturation percentage |
|---|---|---|---|
| A | 5432 | 5 | 0.092047% |
| B | 5432 | 208 | 3.829161% |
| C | 5432 | 92 | 1.693667% |
| D | 5432 | 404 | 7.437408% |
Noise dominated data is calculated using 1-second bins in cleaned event files. If a bin has >2000 counts, and if more than 50% of those come from <1% of pixels, then it is considered to be noise-dominated and hence unusable.
| Quadrant | # 1 sec bins | Bins with >0 counts | Bins with >2000 counts | High rate bins dominated by noise | Noise dominated (total time) | Noise dominated (detector-on time) | Marked lightcurve |
|---|---|---|---|---|---|---|---|
| A | 7104 | 5433 | 0 | 0 | 0.00% | 0.00% | 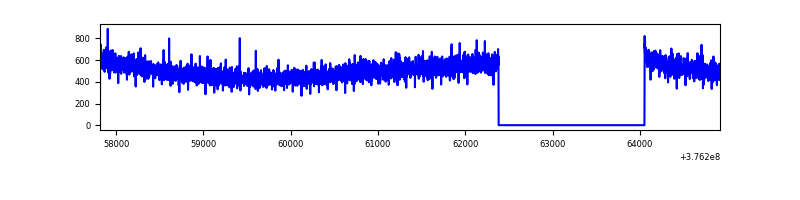 |
| B | 7104 | 5432 | 143 | 143 | 2.01% | 2.63% | 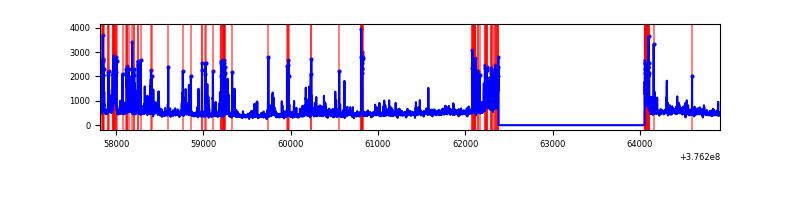 |
| C | 7104 | 5433 | 71 | 71 | 1.00% | 1.31% | 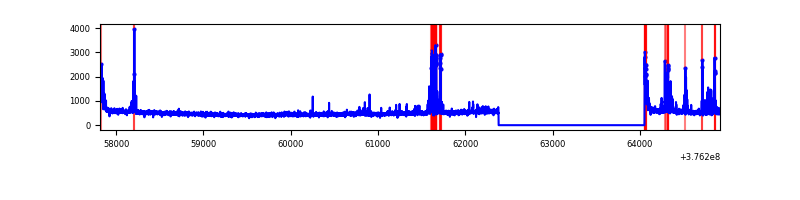 |
| D | 7103 | 5432 | 397 | 397 | 5.59% | 7.31% | 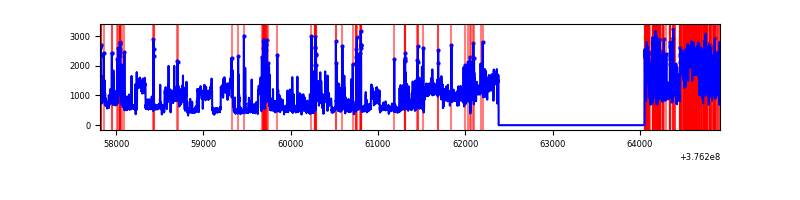 |
Top three noisy pixels from each quadrant. If the there are fewer than three noisy pixels in the level2.evt file, extra rows are filled as -1
| Pixel properties | Quadrant properties | ||||||
|---|---|---|---|---|---|---|---|
| Quadrant | DetID | PixID | Counts | Sigma | Mean | Median | Sigma |
| A | 15 | 47 | 294008 | 2382.28 | 618 | 605 | 123.2 |
| A | 13 | 6 | 11773 | 90.68 | 618 | 605 | 123.2 |
| A | 13 | 254 | 9491 | 72.15 | 618 | 605 | 123.2 |
| B | 5 | 172 | 458048 | 3900.34 | 610 | 594 | 117.3 |
| B | 5 | 255 | 325798 | 2772.75 | 610 | 594 | 117.3 |
| B | 0 | 219 | 58285 | 491.88 | 610 | 594 | 117.3 |
| C | 1 | 23 | 254252 | 1819.59 | 602 | 606 | 139.4 |
| C | 15 | 214 | 234465 | 1677.65 | 602 | 606 | 139.4 |
| C | 0 | 10 | 84128 | 599.17 | 602 | 606 | 139.4 |
| D | 8 | 195 | 1841738 | 12780.18 | 588 | 571 | 144.1 |
| D | 1 | 52 | 602632 | 4179.11 | 588 | 571 | 144.1 |
| D | 13 | 249 | 308150 | 2135.01 | 588 | 571 | 144.1 |
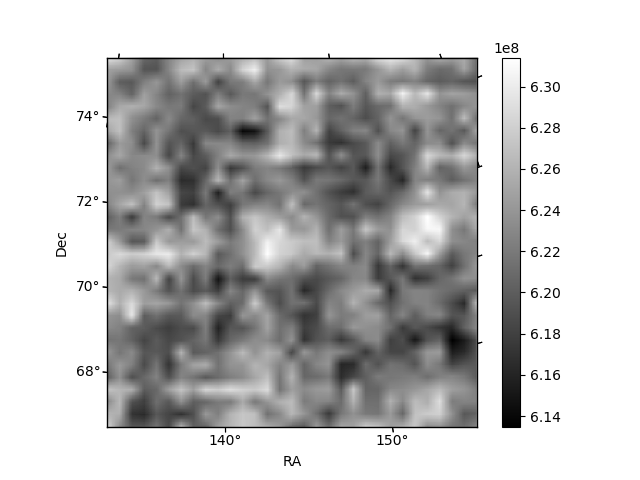
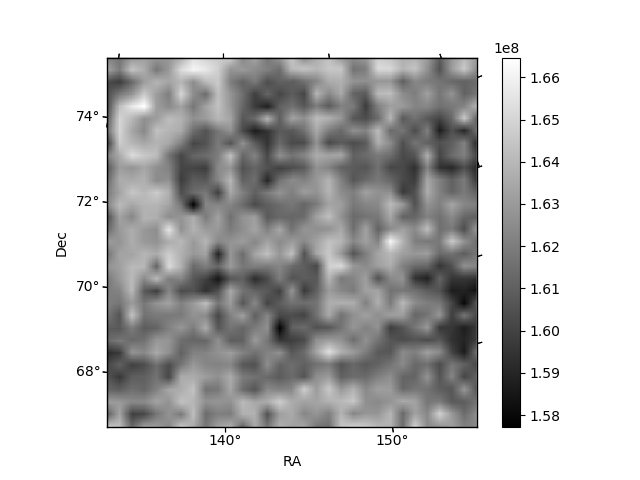
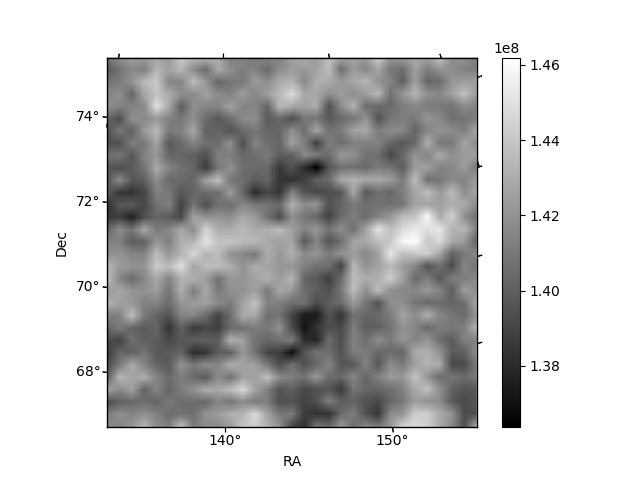
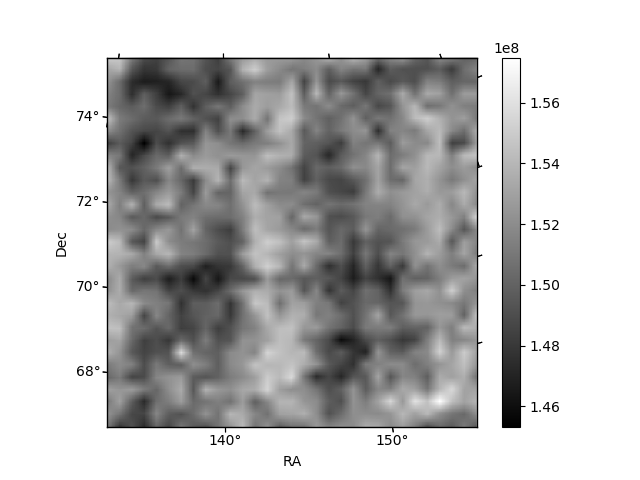
Histogram calculated using DETX and DETY for each event in the final _common_clean file
| Quadrant A | 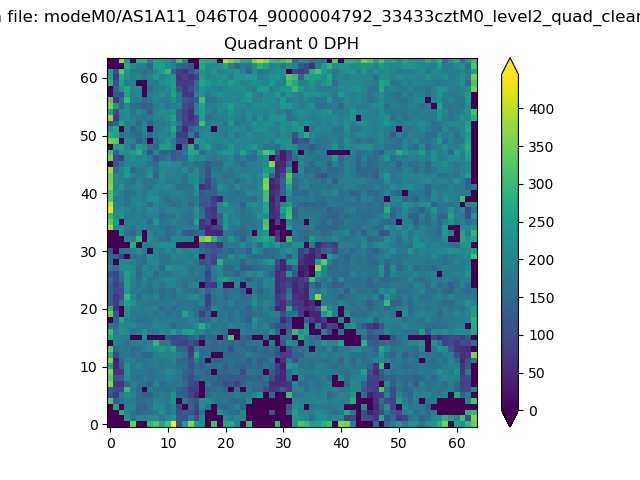 |
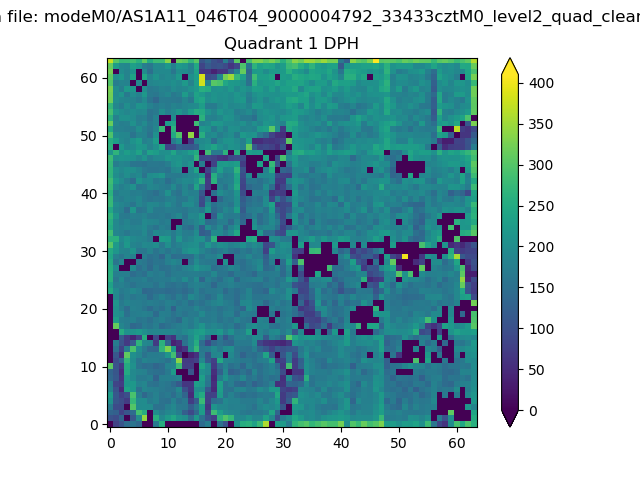 |
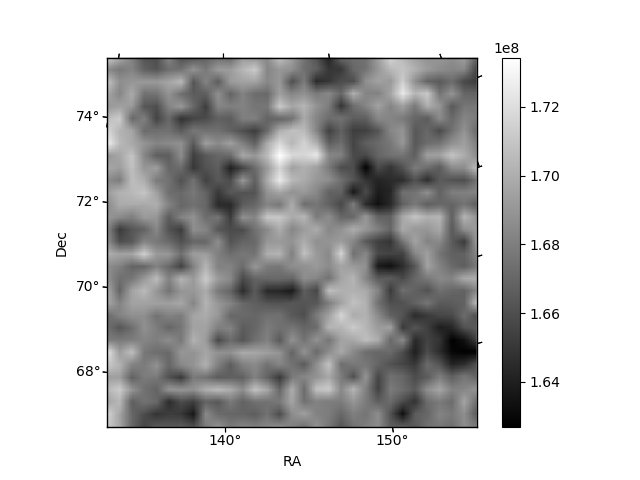
Quadrant B |
|---|---|---|---|
| Quadrant D | 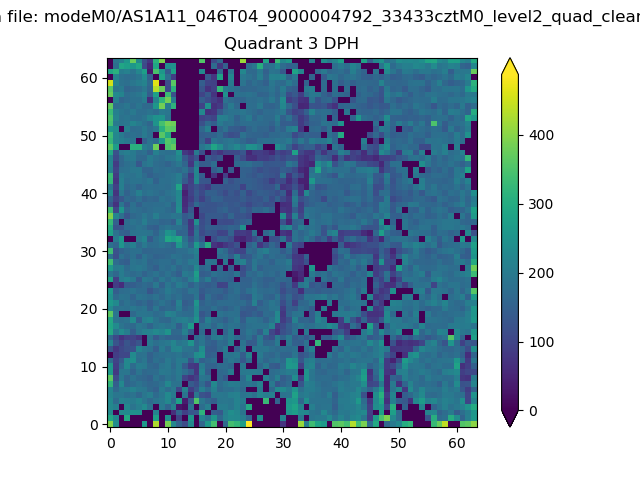 |
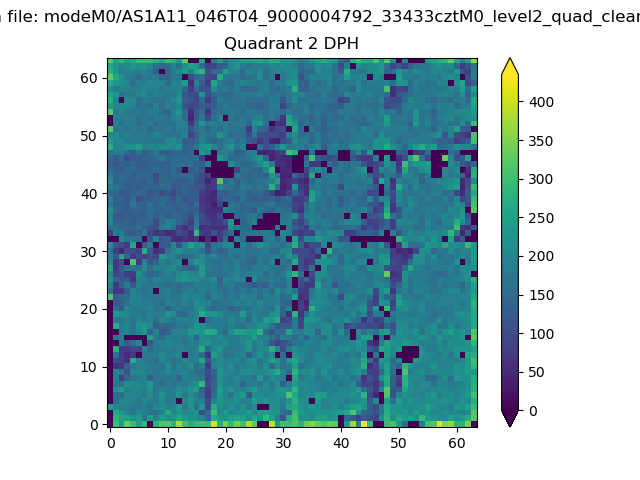 |
Quadrant C |
| Plot type | Count rate plots | Images |
|---|---|---|
| Comparison with Poisson distribution Blue bars denote a histogram of data divided into 1 sec bins. Red curve is a Poisson curve with rate = median count rate of data. |
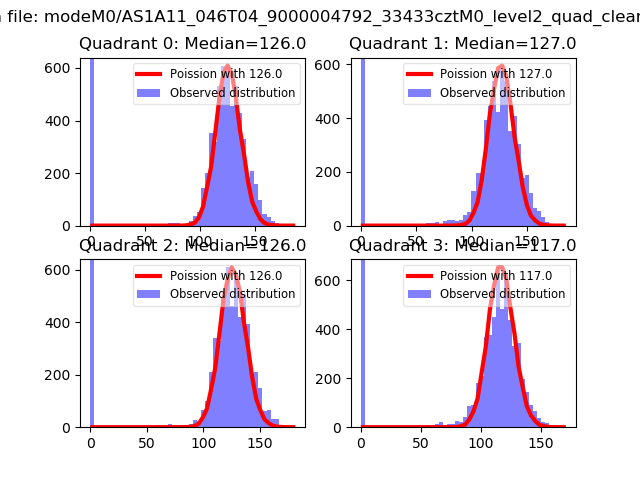 |
 |
| Quadrant-wise count rates Data is divided into 100 sec bins |
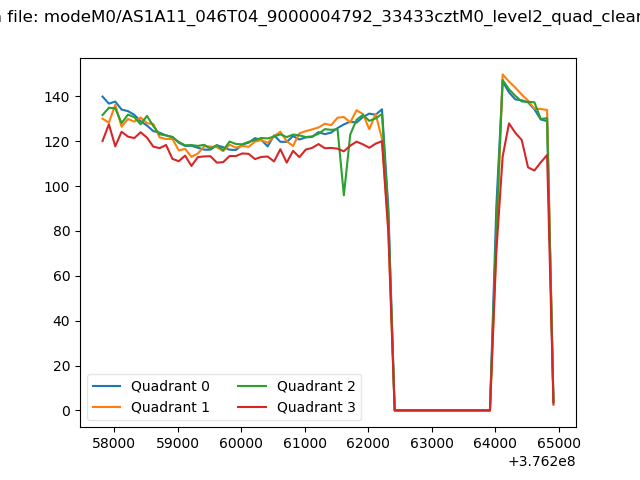 |
|
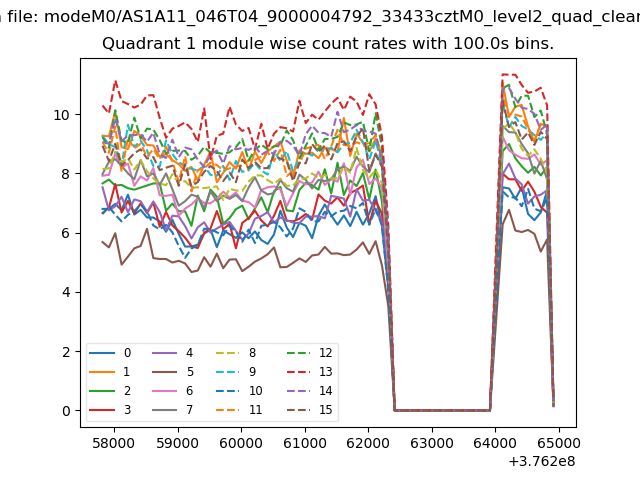
| Module-wise count rates for Quadrant A Data is divided into 100 sec bins |
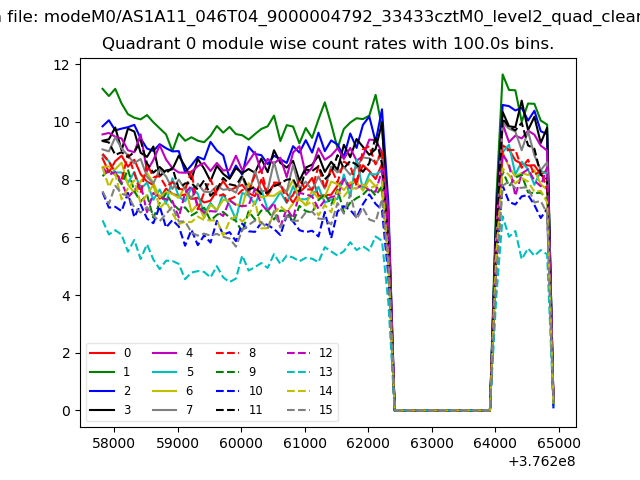 |
 |
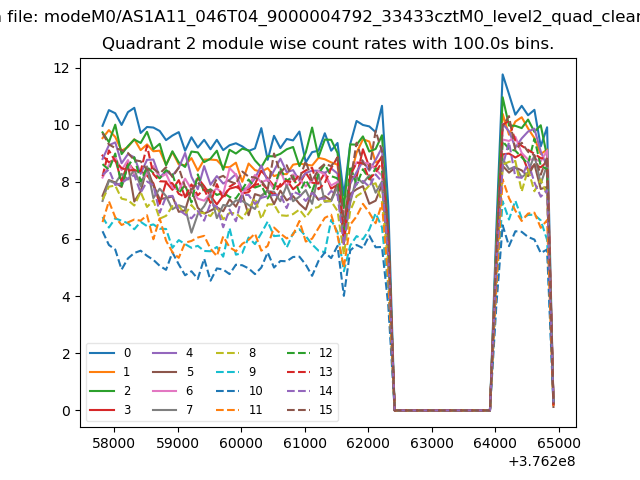
| Module-wise count rates for Quadrant B Data is divided into 100 sec bins |
 |
 |
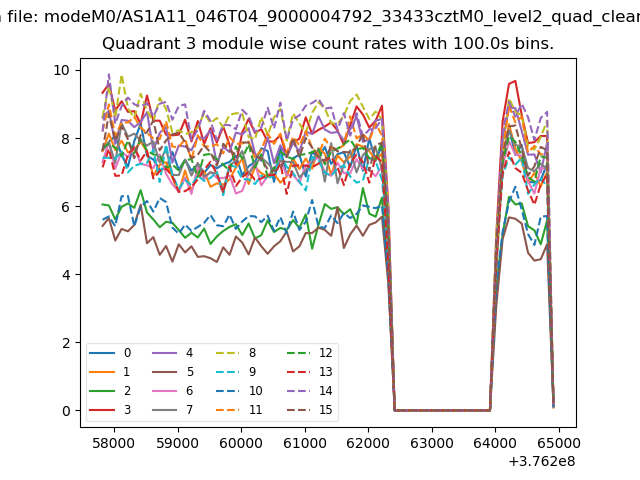
| Module-wise count rates for Quadrant C Data is divided into 100 sec bins |
 |
 |
| Module-wise count rates for Quadrant D Data is divided into 100 sec bins |
 |
 |
| Parameter | Plot |
|---|---|
| CZT HV Monitor | 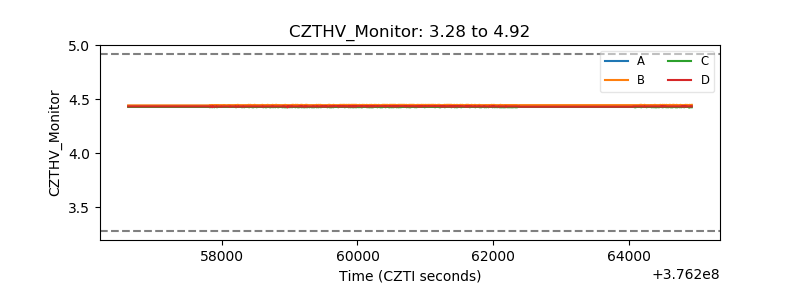 |
| D_VDD | 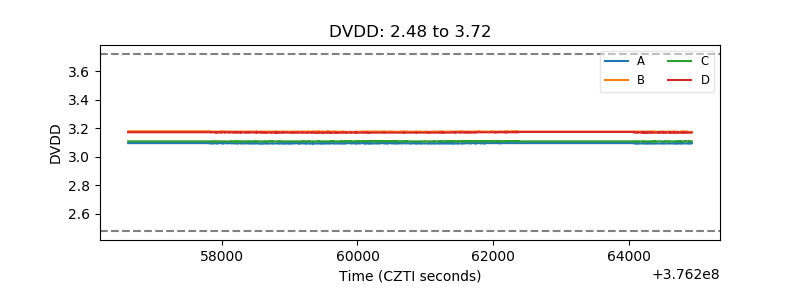 |
| Temperature 1 | 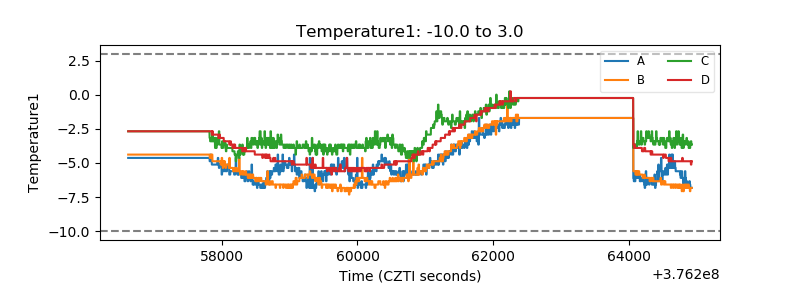 |
| Veto HV Monitor | 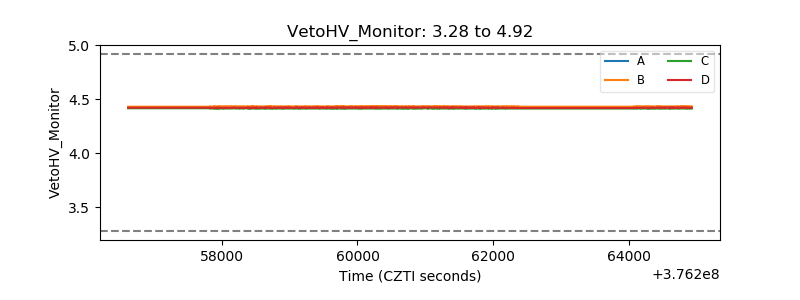 |
| Veto LLD | 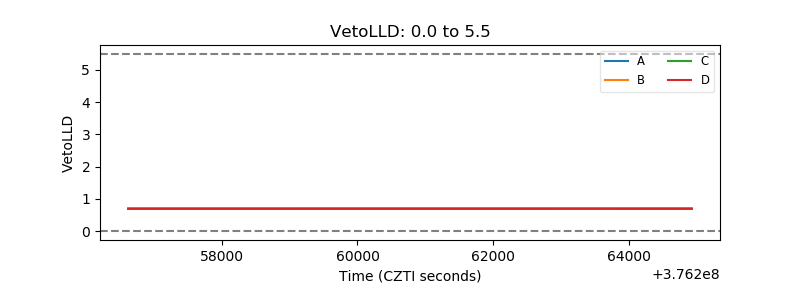 |
| Alpha Counter | 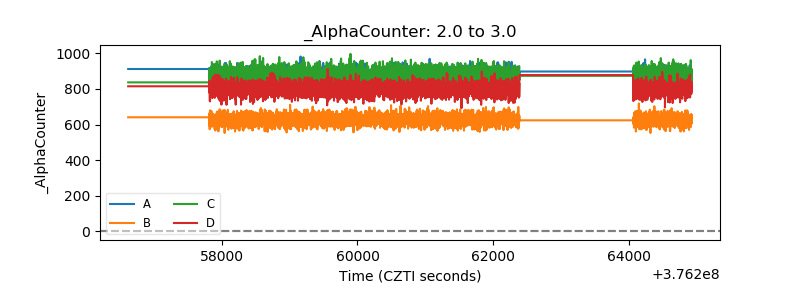 |
| _CPM_Rate | 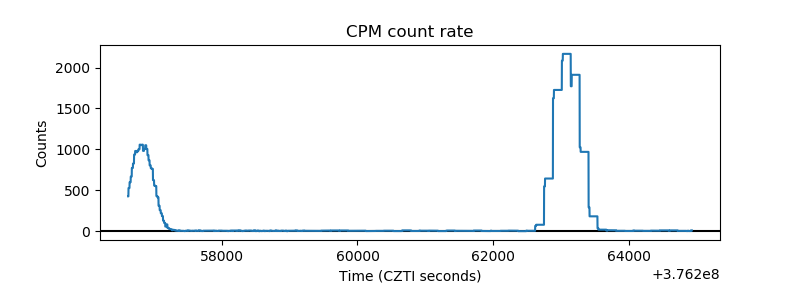 |
| CZT Counter | 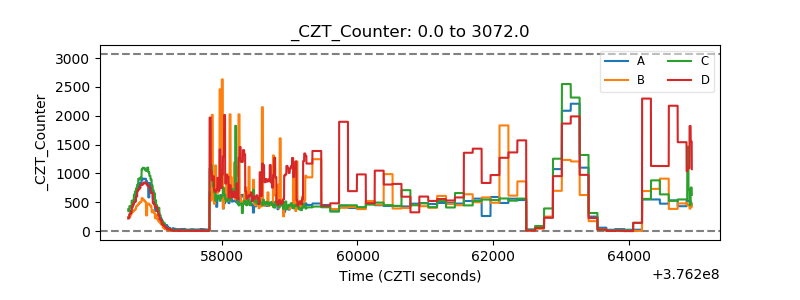 |
| +2.5 Volts monitor | 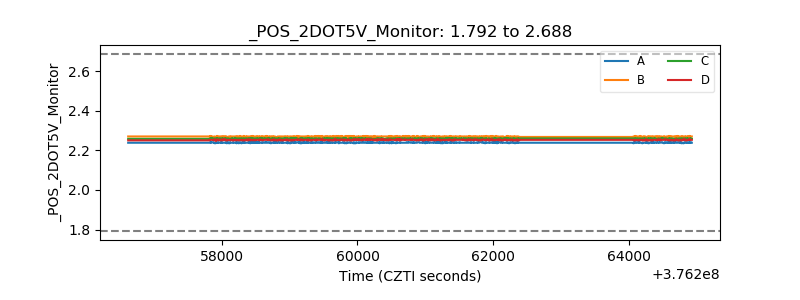 |
| +5 Volts monitor |  |
| _ROLL_ROT | 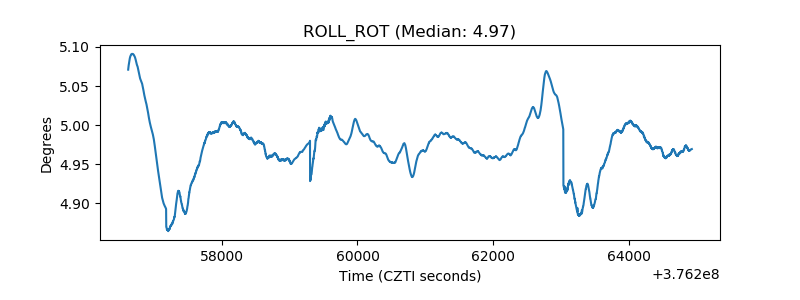 |
| _Roll_DEC | 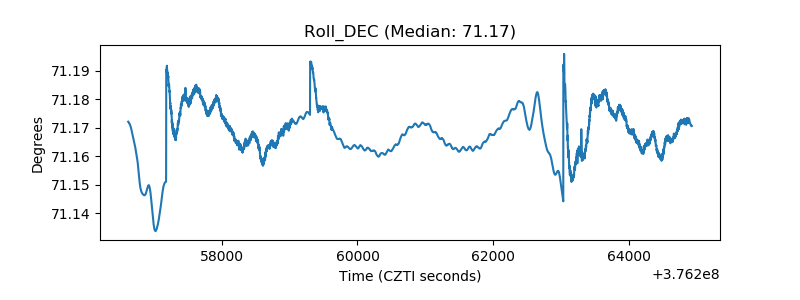 |
| _Roll_RA | 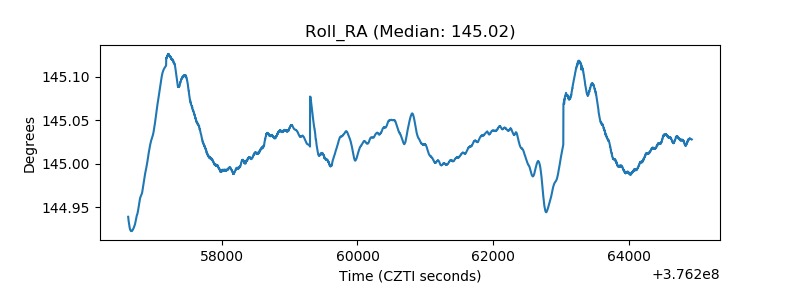 |
| Veto Counter | 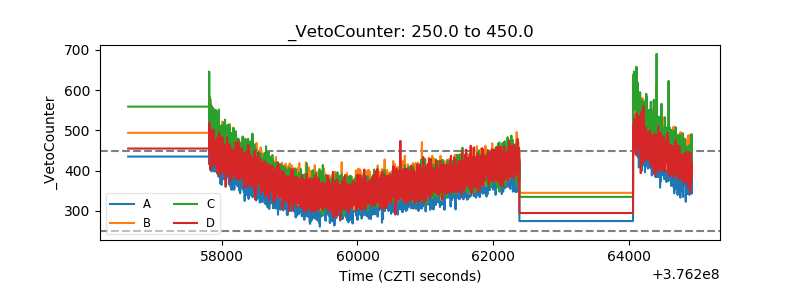 |