| Param | Original file | Final file |
|---|---|---|
| Filename | modeM0/AS1A11_046T04_9000004792_33435cztM0_level2.evt | modeM0/AS1A11_046T04_9000004792_33435cztM0_level2_quad_clean.evt |
| Size (bytes) | 577,319,040 | 97,110,720 |
| Size | 550.6 MB | 92.6 MB |
| Events in quadrant A | 2,620,591 | 669,326 |
| Events in quadrant B | 3,116,028 | 673,767 |
| Events in quadrant C | 3,185,443 | 666,716 |
| Events in quadrant D | 8,206,466 | 562,290 |
| Mode M0 | |||
|---|---|---|---|
| Quadrant | BADHDUFLAG | Total packets | Discarded packets |
| A | 0 | 10879 | 2 |
| B | 0 | 12827 | 1 |
| C | 0 | 12708 | 1 |
| D | 0 | 28080 | 1 |
| Mode M9 | |||
|---|---|---|---|
| Quadrant | BADHDUFLAG | Total packets | Discarded packets |
| A | 0 | 30 | 0 |
| B | 0 | 30 | 0 |
| C | 0 | 30 | 0 |
| D | 0 | 31 | 0 |
| Mode SS | |||
|---|---|---|---|
| Quadrant | BADHDUFLAG | Total packets | Discarded packets |
| A | 0 | 106 | 0 |
| B | 0 | 106 | 0 |
| C | 0 | 106 | 0 |
| D | 0 | 106 | 0 |
| Quadrant | Total seconds | Saturated seconds | Saturation percentage |
|---|---|---|---|
| A | 5264 | 4 | 0.075988% |
| B | 5264 | 137 | 2.602584% |
| C | 5264 | 100 | 1.899696% |
| D | 5264 | 1276 | 24.240122% |
Noise dominated data is calculated using 1-second bins in cleaned event files. If a bin has >2000 counts, and if more than 50% of those come from <1% of pixels, then it is considered to be noise-dominated and hence unusable.
| Quadrant | # 1 sec bins | Bins with >0 counts | Bins with >2000 counts | High rate bins dominated by noise | Noise dominated (total time) | Noise dominated (detector-on time) | Marked lightcurve |
|---|---|---|---|---|---|---|---|
| A | 7057 | 5265 | 0 | 0 | 0.00% | 0.00% | 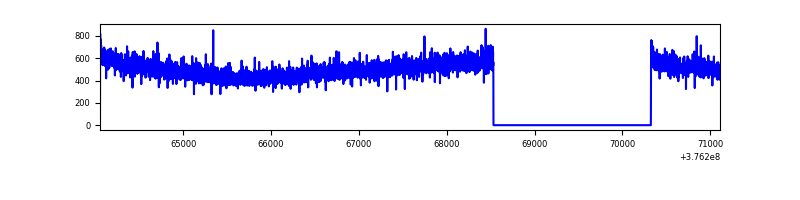 |
| B | 7057 | 5265 | 94 | 94 | 1.33% | 1.79% | 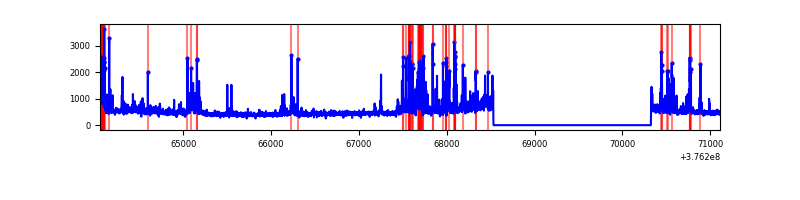 |
| C | 7057 | 5265 | 89 | 89 | 1.26% | 1.69% | 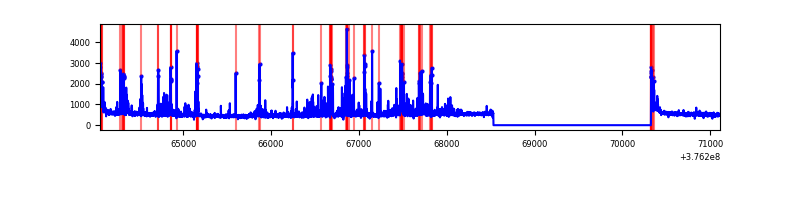 |
| D | 7057 | 5265 | 1384 | 1384 | 19.61% | 26.29% | 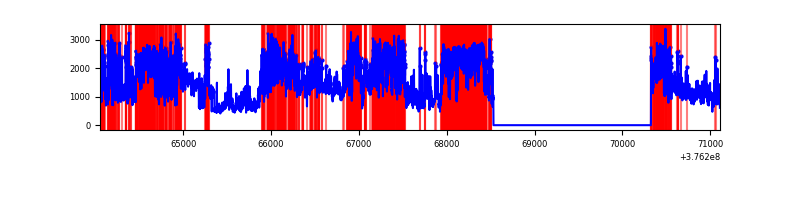 |
Top three noisy pixels from each quadrant. If the there are fewer than three noisy pixels in the level2.evt file, extra rows are filled as -1
| Pixel properties | Quadrant properties | ||||||
|---|---|---|---|---|---|---|---|
| Quadrant | DetID | PixID | Counts | Sigma | Mean | Median | Sigma |
| A | 15 | 47 | 264774 | 2185.96 | 605 | 594 | 120.9 |
| A | 13 | 6 | 13574 | 107.4 | 605 | 594 | 120.9 |
| A | 13 | 254 | 9739 | 75.67 | 605 | 594 | 120.9 |
| B | 5 | 172 | 479132 | 4236.93 | 601 | 588 | 112.9 |
| B | 5 | 255 | 81948 | 720.34 | 601 | 588 | 112.9 |
| B | 0 | 213 | 46533 | 406.79 | 601 | 588 | 112.9 |
| C | 1 | 23 | 374535 | 2773.51 | 588 | 594 | 134.8 |
| C | 15 | 214 | 228742 | 1692.17 | 588 | 594 | 134.8 |
| C | 3 | 233 | 113599 | 838.16 | 588 | 594 | 134.8 |
| D | 1 | 52 | 3272208 | 24402.96 | 539 | 523 | 134.1 |
| D | 8 | 195 | 2208870 | 16471.7 | 539 | 523 | 134.1 |
| D | 13 | 249 | 190628 | 1417.96 | 539 | 523 | 134.1 |
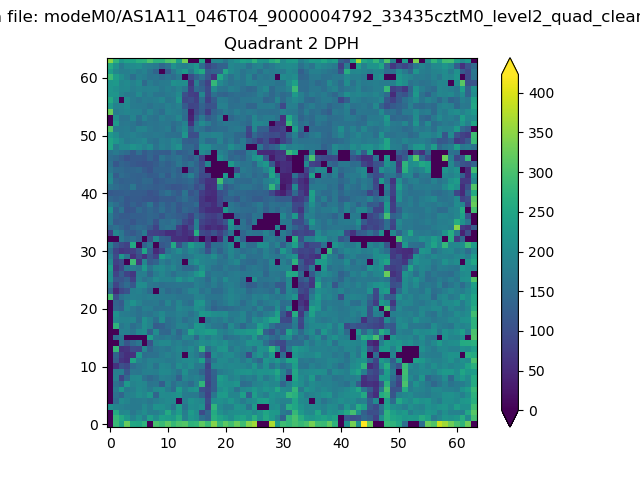
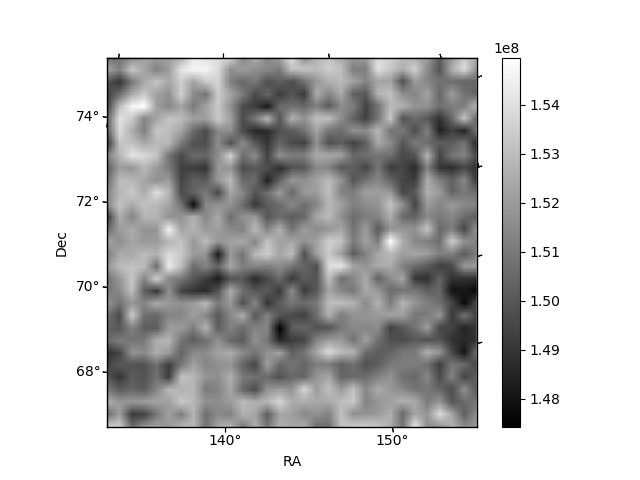
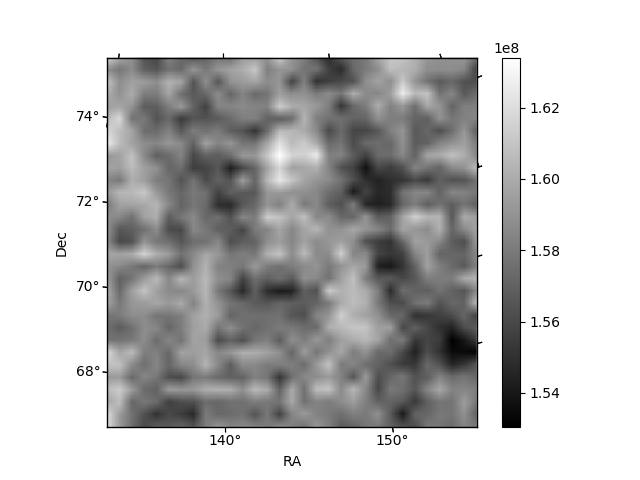
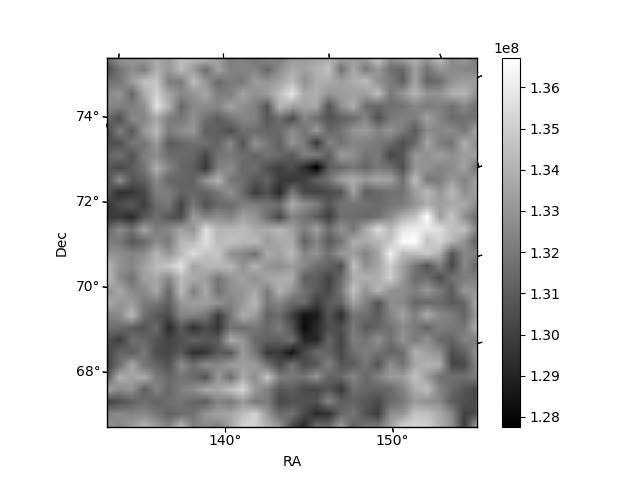
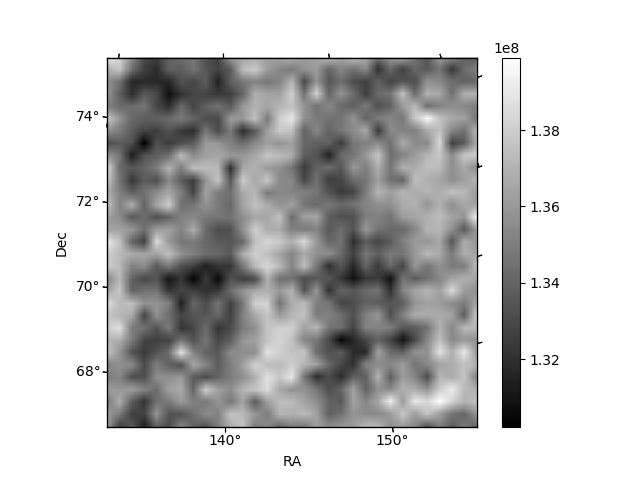
Histogram calculated using DETX and DETY for each event in the final _common_clean file
| Quadrant A | 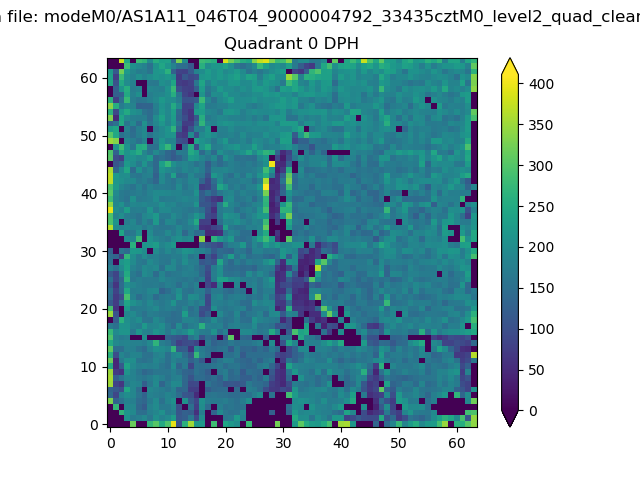 |
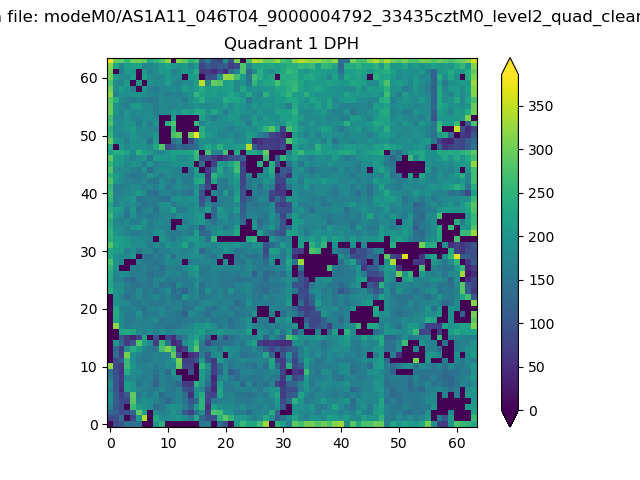 |
Quadrant B |
|---|---|---|---|
| Quadrant D | 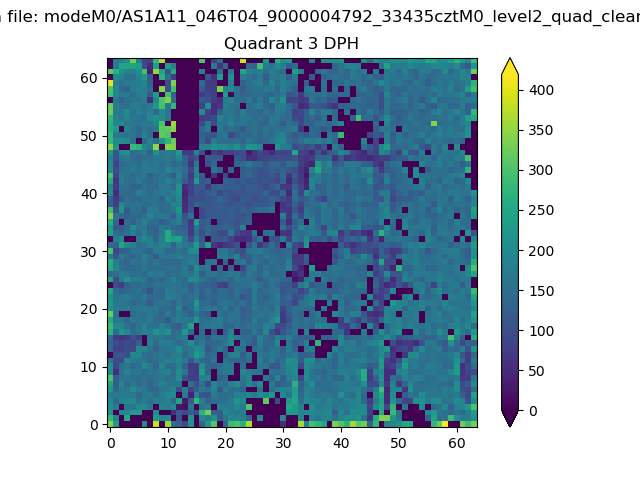 |
 |
Quadrant C |
| Plot type | Count rate plots | Images |
|---|---|---|
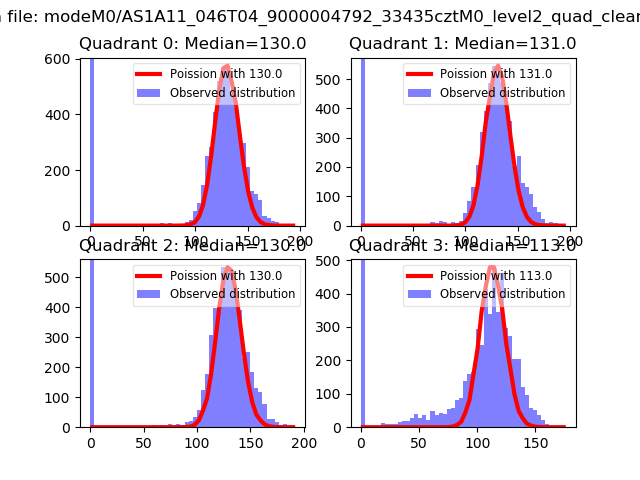
| Comparison with Poisson distribution Blue bars denote a histogram of data divided into 1 sec bins. Red curve is a Poisson curve with rate = median count rate of data. |
 |
 |
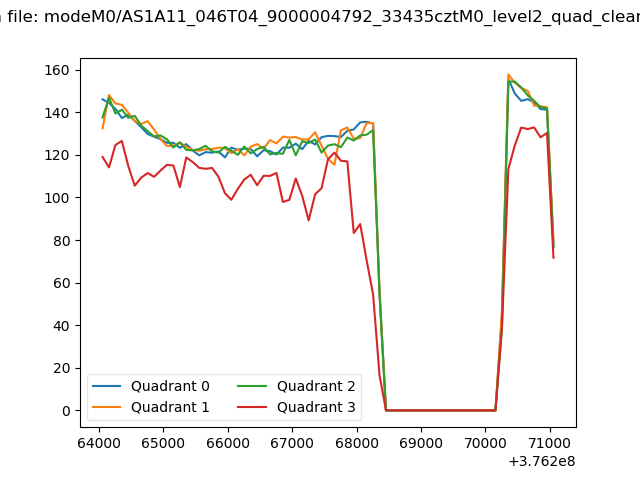
| Quadrant-wise count rates Data is divided into 100 sec bins |
 |
|
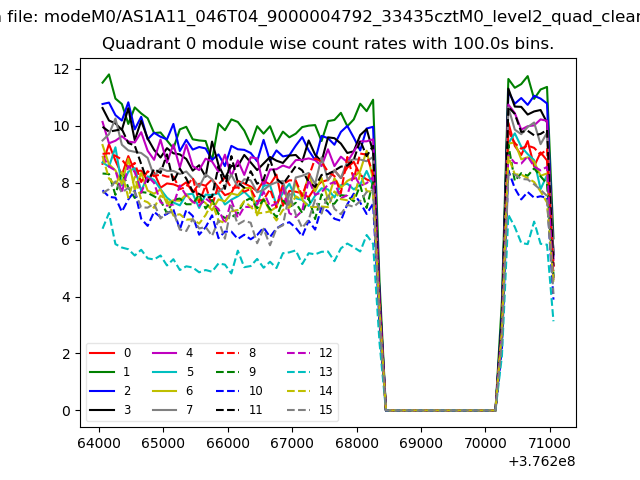
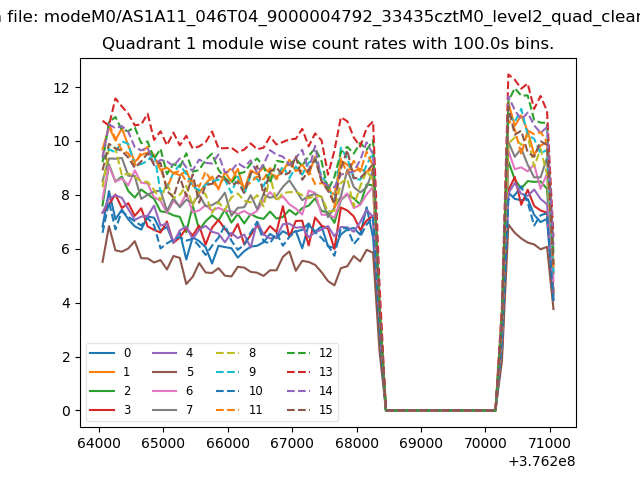
| Module-wise count rates for Quadrant A Data is divided into 100 sec bins |
 |
 |
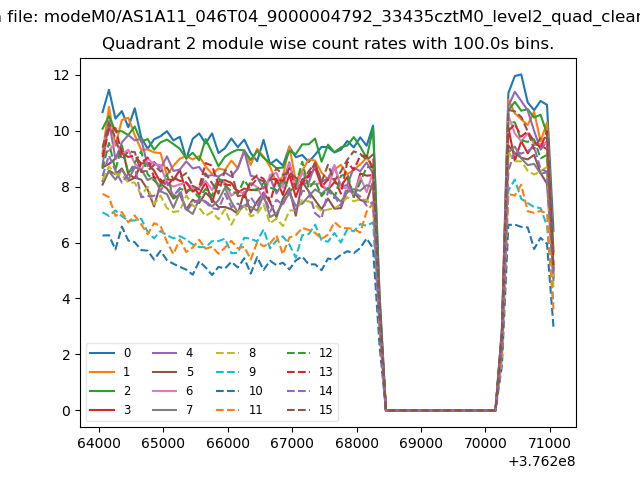
| Module-wise count rates for Quadrant B Data is divided into 100 sec bins |
 |
 |
| Module-wise count rates for Quadrant C Data is divided into 100 sec bins |
 |
 |
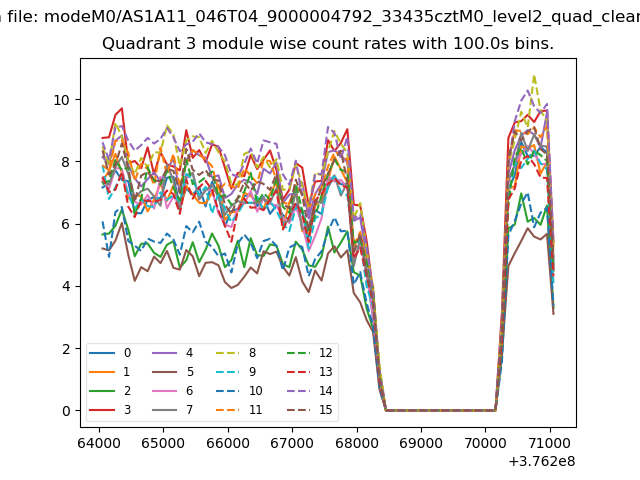
| Module-wise count rates for Quadrant D Data is divided into 100 sec bins |
 |
 |
| Parameter | Plot |
|---|---|
| CZT HV Monitor | 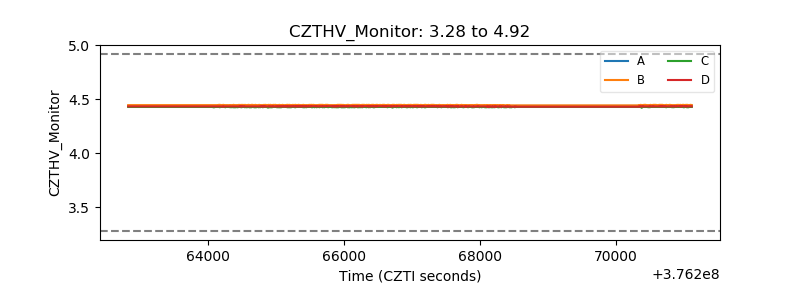 |
| D_VDD | 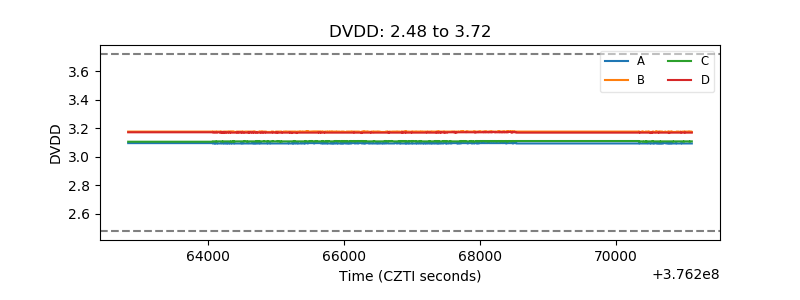 |
| Temperature 1 | 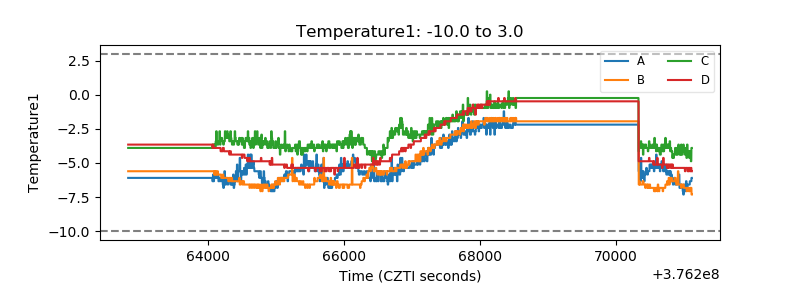 |
| Veto HV Monitor | 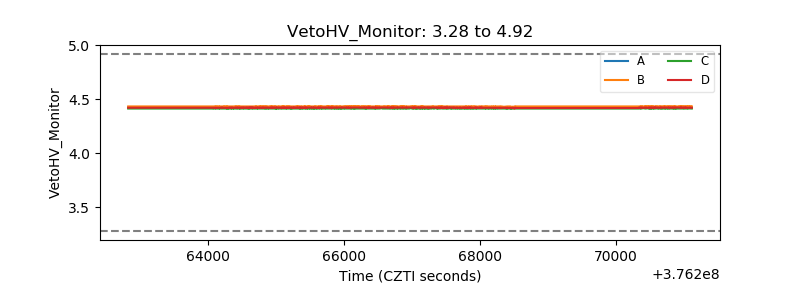 |
| Veto LLD | 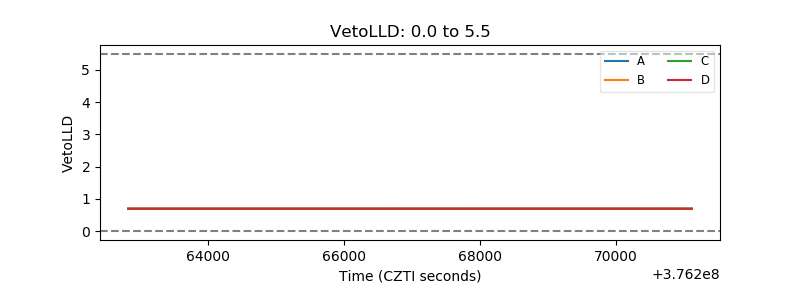 |
| Alpha Counter | 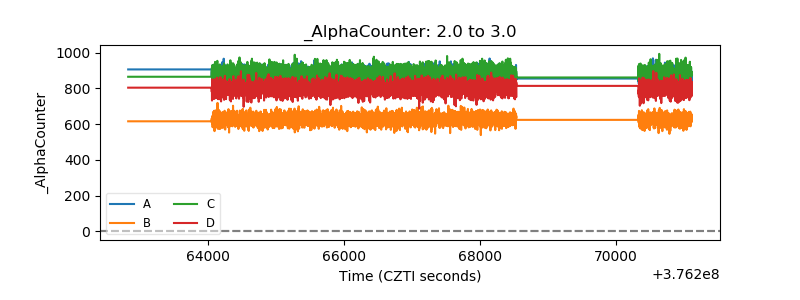 |
| _CPM_Rate | 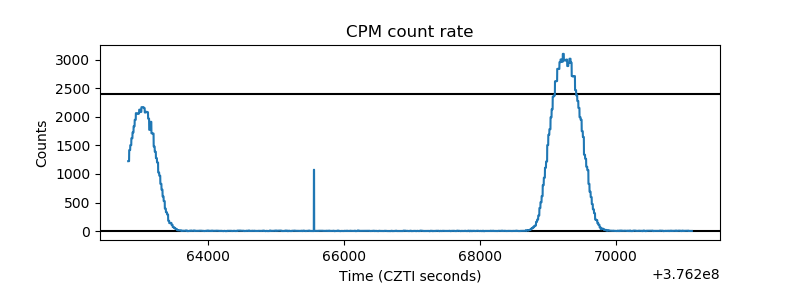 |
| CZT Counter | 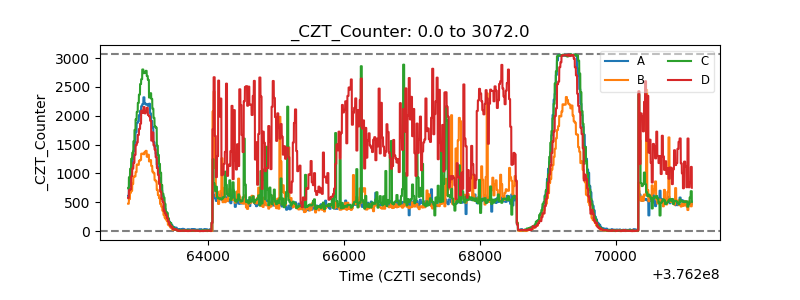 |
| +2.5 Volts monitor | 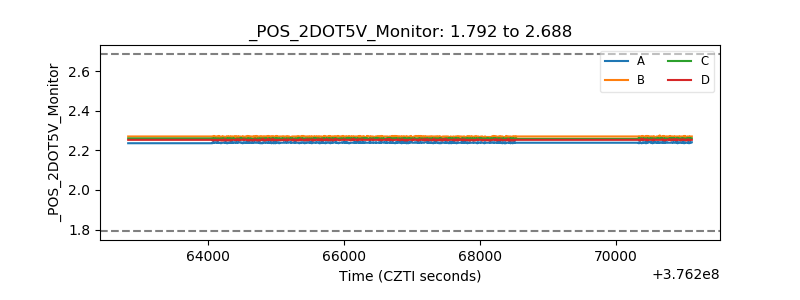 |
| +5 Volts monitor | 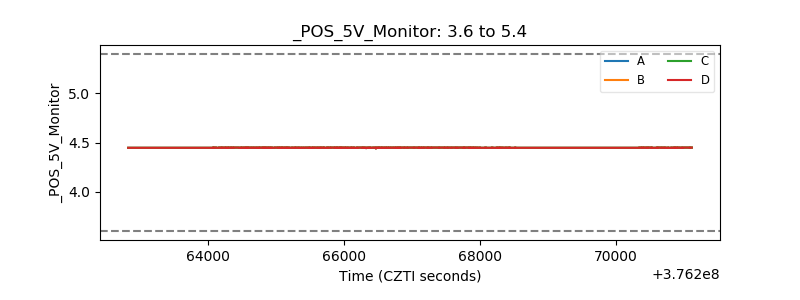 |
| _ROLL_ROT | 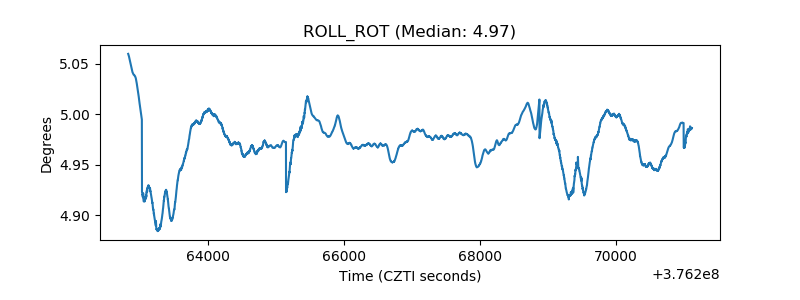 |
| _Roll_DEC | 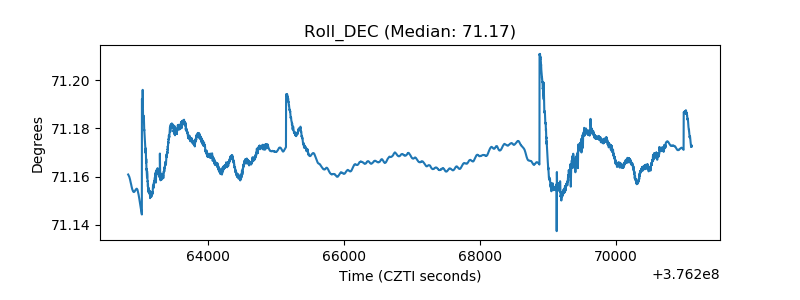 |
| _Roll_RA | 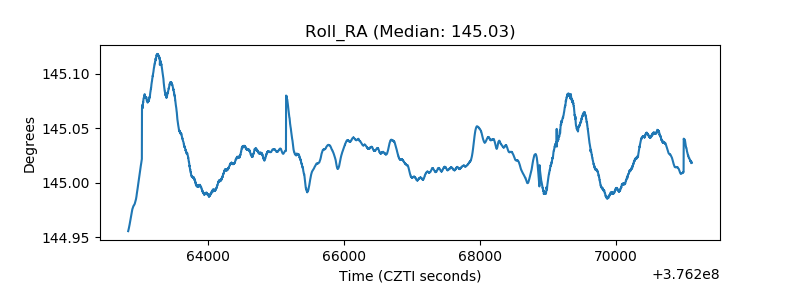 |
| Veto Counter | 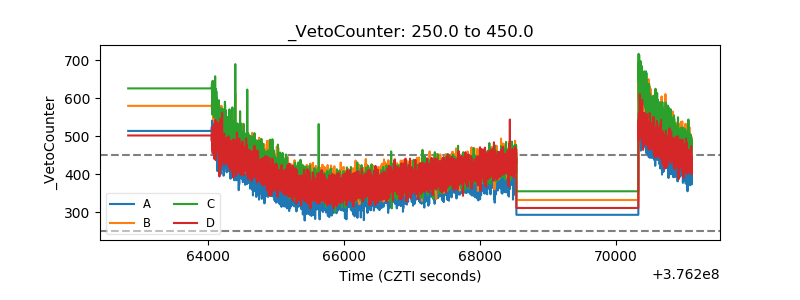 |