| Param | Original file | Final file |
|---|---|---|
| Filename | modeM0/AS1A11_046T04_9000004792_33436cztM0_level2.evt | modeM0/AS1A11_046T04_9000004792_33436cztM0_level2_quad_clean.evt |
| Size (bytes) | 549,308,160 | 86,212,800 |
| Size | 523.9 MB | 82.2 MB |
| Events in quadrant A | 2,406,235 | 596,823 |
| Events in quadrant B | 4,313,008 | 572,107 |
| Events in quadrant C | 2,556,051 | 596,398 |
| Events in quadrant D | 7,033,813 | 506,005 |
| Mode M0 | |||
|---|---|---|---|
| Quadrant | BADHDUFLAG | Total packets | Discarded packets |
| A | 0 | 9930 | 1 |
| B | 0 | 16060 | 1 |
| C | 0 | 10473 | 1 |
| D | 0 | 24281 | 1 |
| Mode M9 | |||
|---|---|---|---|
| Quadrant | BADHDUFLAG | Total packets | Discarded packets |
| A | 0 | 27 | 0 |
| B | 0 | 27 | 0 |
| C | 0 | 27 | 0 |
| D | 0 | 28 | 0 |
| Mode SS | |||
|---|---|---|---|
| Quadrant | BADHDUFLAG | Total packets | Discarded packets |
| A | 0 | 98 | 0 |
| B | 0 | 98 | 0 |
| C | 0 | 98 | 0 |
| D | 0 | 98 | 0 |
| Quadrant | Total seconds | Saturated seconds | Saturation percentage |
|---|---|---|---|
| A | 4831 | 3 | 0.062099% |
| B | 4831 | 610 | 12.626785% |
| C | 4831 | 29 | 0.600290% |
| D | 4831 | 1161 | 24.032291% |
Noise dominated data is calculated using 1-second bins in cleaned event files. If a bin has >2000 counts, and if more than 50% of those come from <1% of pixels, then it is considered to be noise-dominated and hence unusable.
| Quadrant | # 1 sec bins | Bins with >0 counts | Bins with >2000 counts | High rate bins dominated by noise | Noise dominated (total time) | Noise dominated (detector-on time) | Marked lightcurve |
|---|---|---|---|---|---|---|---|
| A | 6774 | 4832 | 0 | 0 | 0.00% | 0.00% | 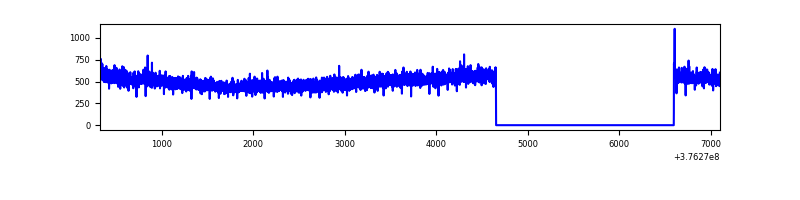 |
| B | 6774 | 4832 | 501 | 501 | 7.40% | 10.37% | 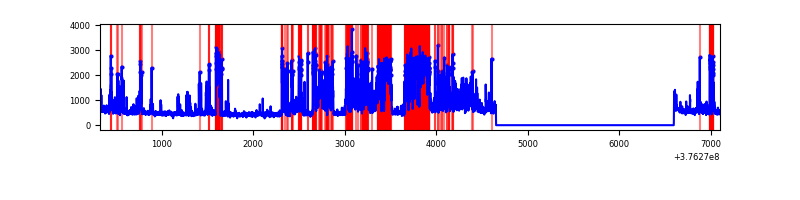 |
| C | 6774 | 4832 | 29 | 29 | 0.43% | 0.60% | 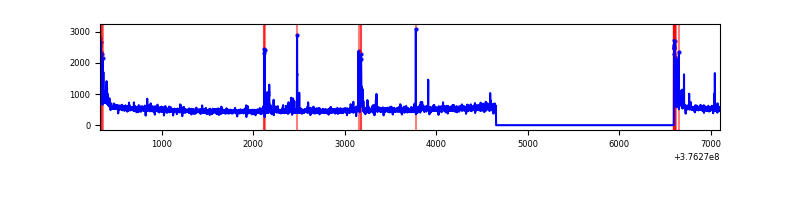 |
| D | 6774 | 4832 | 1212 | 1212 | 17.89% | 25.08% | 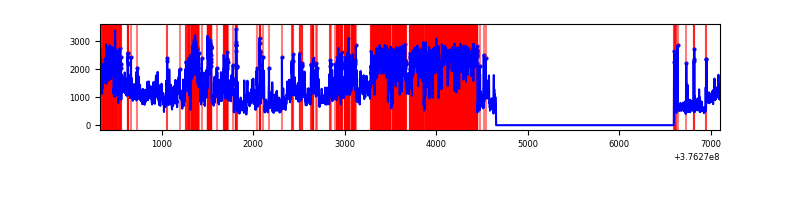 |
Top three noisy pixels from each quadrant. If the there are fewer than three noisy pixels in the level2.evt file, extra rows are filled as -1
| Pixel properties | Quadrant properties | ||||||
|---|---|---|---|---|---|---|---|
| Quadrant | DetID | PixID | Counts | Sigma | Mean | Median | Sigma |
| A | 15 | 47 | 207301 | 1850.12 | 565 | 556 | 111.7 |
| A | 13 | 6 | 10722 | 90.97 | 565 | 556 | 111.7 |
| A | 13 | 254 | 8343 | 69.68 | 565 | 556 | 111.7 |
| B | 5 | 172 | 1810982 | 17748.09 | 540 | 527 | 102.0 |
| B | 0 | 219 | 217083 | 2122.92 | 540 | 527 | 102.0 |
| B | 5 | 255 | 35759 | 345.38 | 540 | 527 | 102.0 |
| C | 15 | 214 | 209023 | 1662.88 | 548 | 551 | 125.4 |
| C | 0 | 10 | 108411 | 860.35 | 548 | 551 | 125.4 |
| C | 9 | 187 | 43623 | 343.56 | 548 | 551 | 125.4 |
| D | 1 | 52 | 3285089 | 26937.37 | 500 | 484 | 121.9 |
| D | 8 | 195 | 1352396 | 11087.16 | 500 | 484 | 121.9 |
| D | 2 | 250 | 114914 | 938.45 | 500 | 484 | 121.9 |
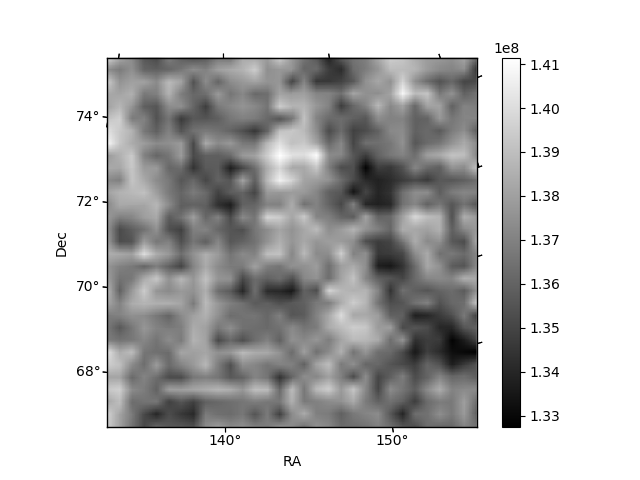
Histogram calculated using DETX and DETY for each event in the final _common_clean file
| Quadrant A | 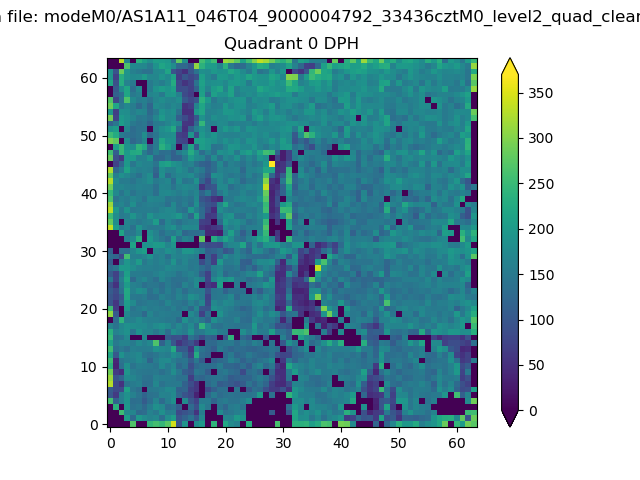 |
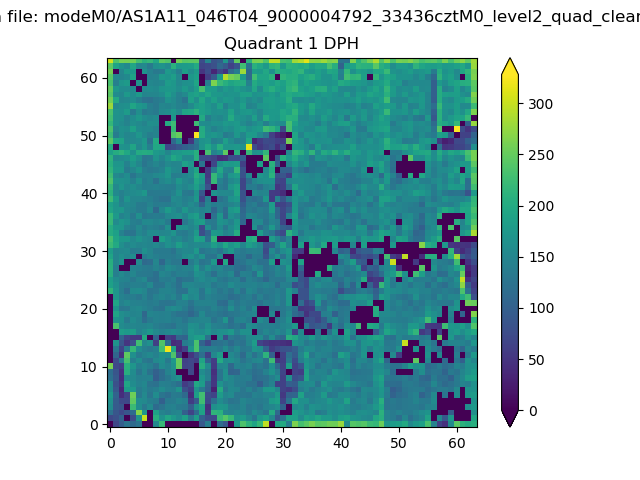 |
Quadrant B |
|---|---|---|---|
| Quadrant D | 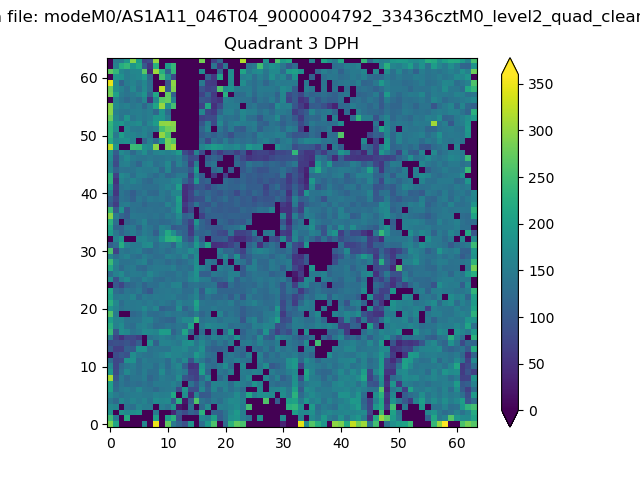 |
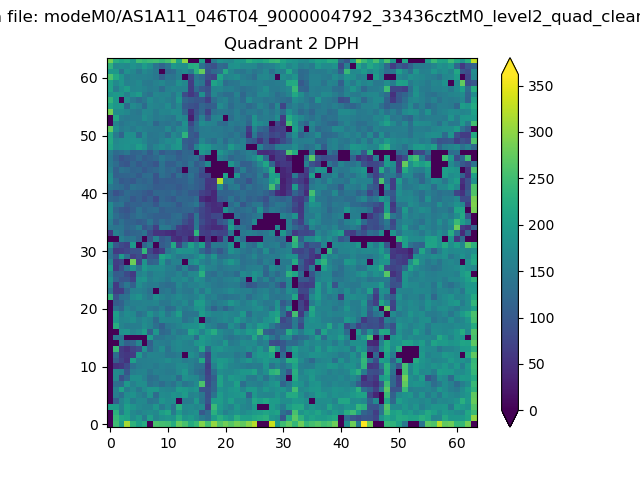 |
Quadrant C |
| Plot type | Count rate plots | Images |
|---|---|---|
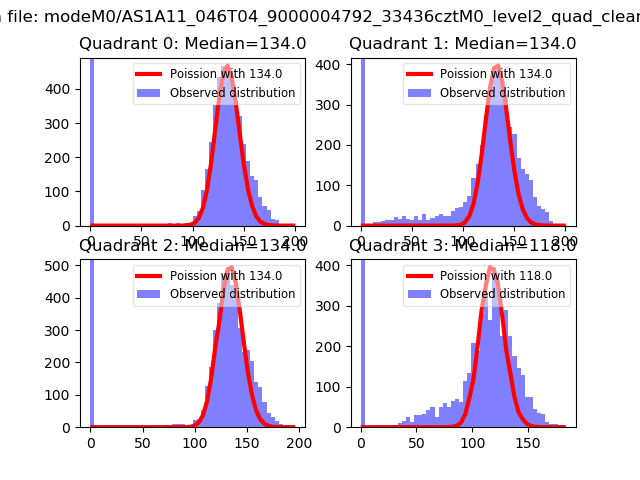
| Comparison with Poisson distribution Blue bars denote a histogram of data divided into 1 sec bins. Red curve is a Poisson curve with rate = median count rate of data. |
 |
 |
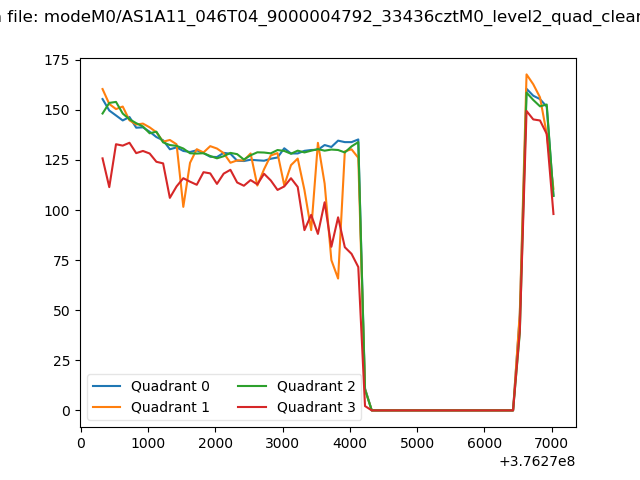
| Quadrant-wise count rates Data is divided into 100 sec bins |
 |
|
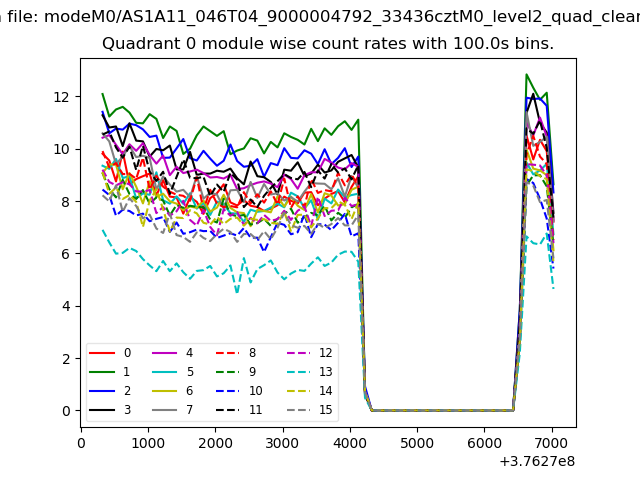
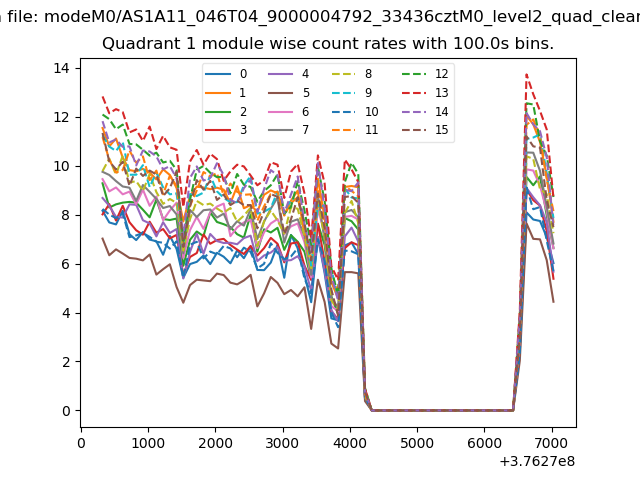
| Module-wise count rates for Quadrant A Data is divided into 100 sec bins |
 |
 |
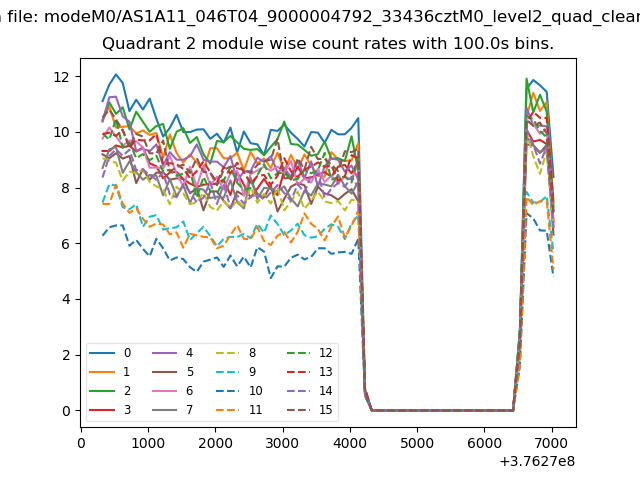
| Module-wise count rates for Quadrant B Data is divided into 100 sec bins |
 |
 |
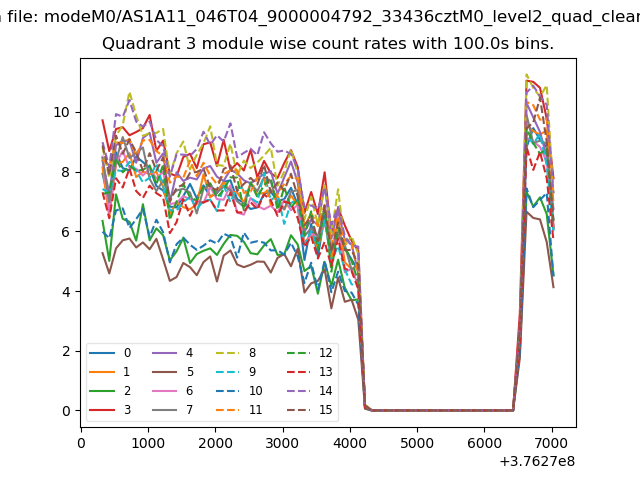
| Module-wise count rates for Quadrant C Data is divided into 100 sec bins |
 |
 |
| Module-wise count rates for Quadrant D Data is divided into 100 sec bins |
 |
 |
| Parameter | Plot |
|---|---|
| CZT HV Monitor | 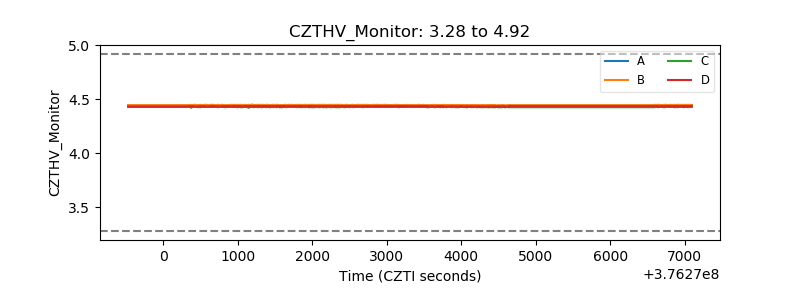 |
| D_VDD | 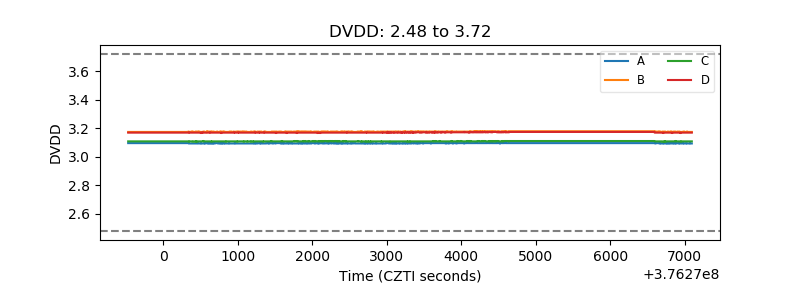 |
| Temperature 1 | 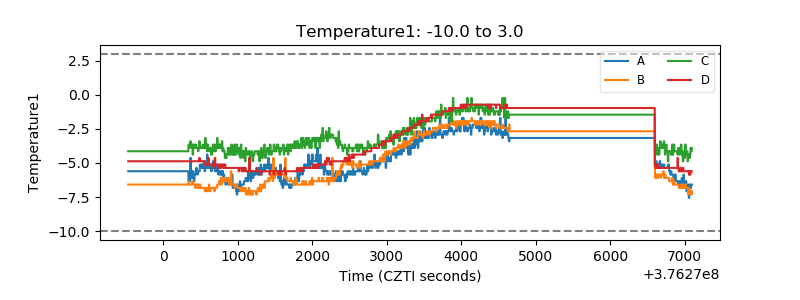 |
| Veto HV Monitor | 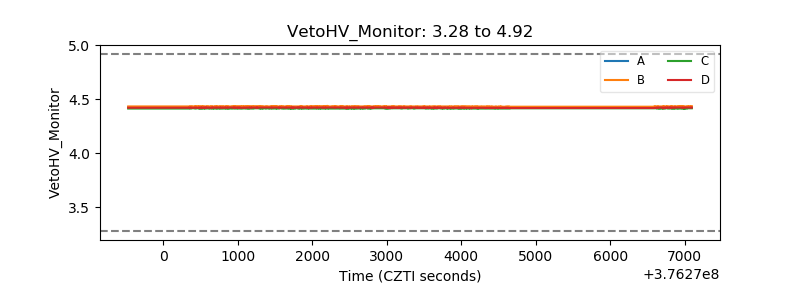 |
| Veto LLD | 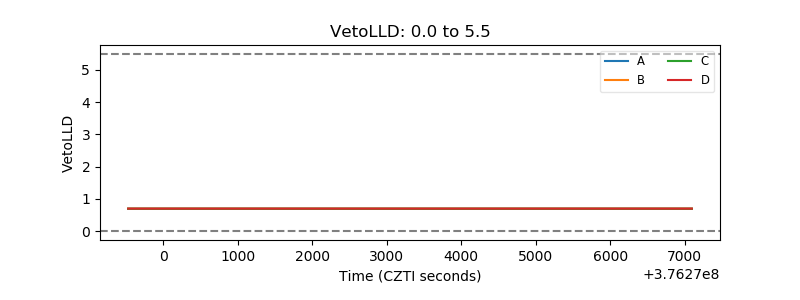 |
| Alpha Counter | 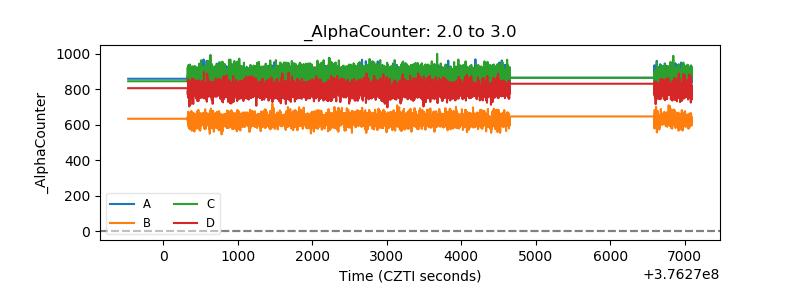 |
| _CPM_Rate | 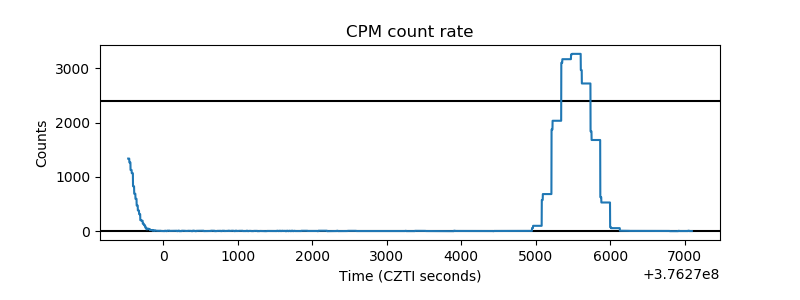 |
| CZT Counter | 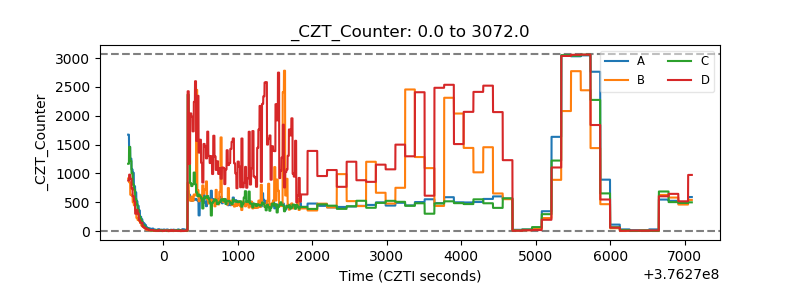 |
| +2.5 Volts monitor |  |
| +5 Volts monitor |  |
| _ROLL_ROT | 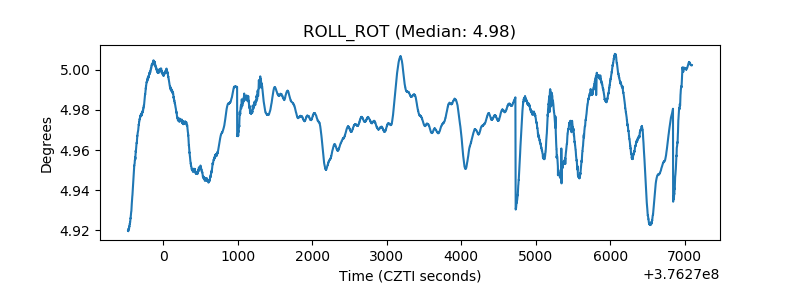 |
| _Roll_DEC | 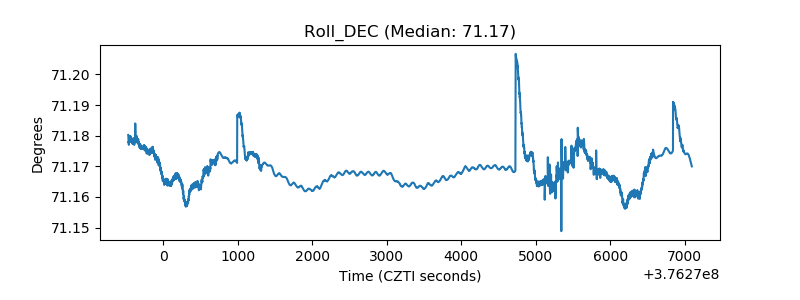 |
| _Roll_RA |  |
| Veto Counter | 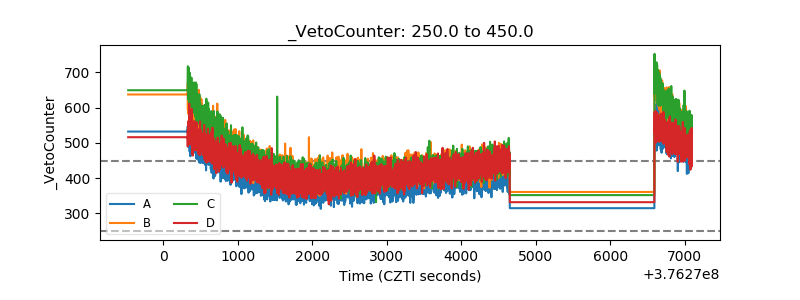 |