| Param | Original file | Final file |
|---|---|---|
| Filename | modeM0/AS1A11_046T04_9000004792_33437cztM0_level2.evt | modeM0/AS1A11_046T04_9000004792_33437cztM0_level2_quad_clean.evt |
| Size (bytes) | 46,621,440 | 11,511,360 |
| Size | 44.5 MB | 11.0 MB |
| Events in quadrant A | 275,283 | 78,165 |
| Events in quadrant B | 357,667 | 78,674 |
| Events in quadrant C | 325,289 | 76,458 |
| Events in quadrant D | 416,024 | 71,609 |
| Mode M0 | |||
|---|---|---|---|
| Quadrant | BADHDUFLAG | Total packets | Discarded packets |
| A | 0 | 1074 | 1 |
| B | 0 | 1382 | 1 |
| C | 0 | 1251 | 1 |
| D | 0 | 1581 | 1 |
| Mode M9 | |||
|---|---|---|---|
| Quadrant | BADHDUFLAG | Total packets | Discarded packets |
| A | 0 | 1 | 0 |
| B | 0 | 1 | 0 |
| C | 0 | 1 | 0 |
| D | 0 | 2 | 0 |
| Mode SS | |||
|---|---|---|---|
| Quadrant | BADHDUFLAG | Total packets | Discarded packets |
| A | 0 | 10 | 0 |
| B | 0 | 10 | 0 |
| C | 0 | 10 | 0 |
| D | 0 | 10 | 0 |
| Quadrant | Total seconds | Saturated seconds | Saturation percentage |
|---|---|---|---|
| A | 504 | 1 | 0.198413% |
| B | 504 | 23 | 4.563492% |
| C | 504 | 12 | 2.380952% |
| D | 504 | 13 | 2.579365% |
Noise dominated data is calculated using 1-second bins in cleaned event files. If a bin has >2000 counts, and if more than 50% of those come from <1% of pixels, then it is considered to be noise-dominated and hence unusable.
| Quadrant | # 1 sec bins | Bins with >0 counts | Bins with >2000 counts | High rate bins dominated by noise | Noise dominated (total time) | Noise dominated (detector-on time) | Marked lightcurve |
|---|---|---|---|---|---|---|---|
| A | 504 | 504 | 0 | 0 | 0.00% | 0.00% | 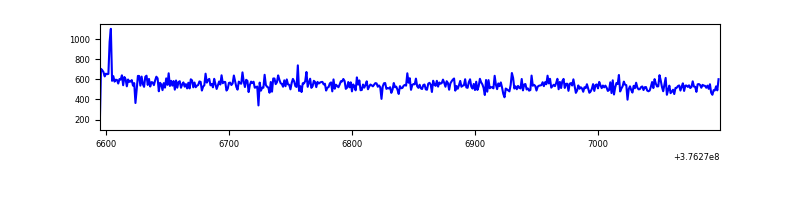 |
| B | 504 | 504 | 21 | 21 | 4.17% | 4.17% | 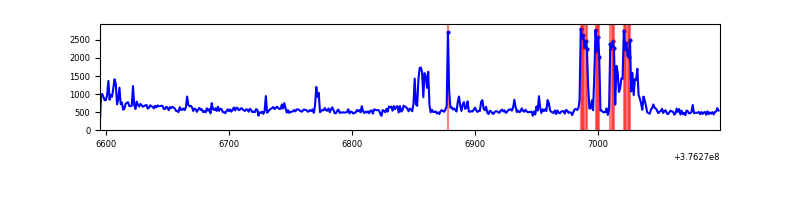 |
| C | 504 | 504 | 12 | 12 | 2.38% | 2.38% | 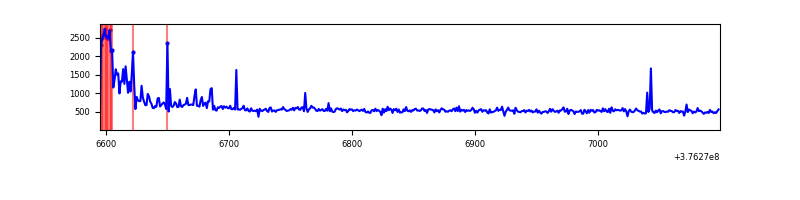 |
| D | 504 | 504 | 13 | 13 | 2.58% | 2.58% | 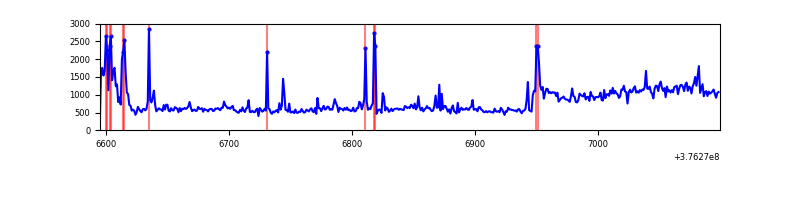 |
Top three noisy pixels from each quadrant. If the there are fewer than three noisy pixels in the level2.evt file, extra rows are filled as -1
| Pixel properties | Quadrant properties | ||||||
|---|---|---|---|---|---|---|---|
| Quadrant | DetID | PixID | Counts | Sigma | Mean | Median | Sigma |
| A | 15 | 47 | 25772 | 1750.94 | 63 | 62 | 14.7 |
| A | 13 | 6 | 1920 | 126.54 | 63 | 62 | 14.7 |
| A | 10 | 83 | 1752 | 115.1 | 63 | 62 | 14.7 |
| B | 5 | 172 | 82964 | 5872.75 | 63 | 62 | 14.1 |
| B | 5 | 255 | 14681 | 1035.6 | 63 | 62 | 14.1 |
| B | 0 | 219 | 5417 | 379.35 | 63 | 62 | 14.1 |
| C | 0 | 10 | 51106 | 3173.46 | 62 | 62 | 16.1 |
| C | 15 | 214 | 26434 | 1639.57 | 62 | 62 | 16.1 |
| C | 12 | 251 | 2179 | 131.62 | 62 | 62 | 16.1 |
| D | 8 | 195 | 118344 | 7422.55 | 59 | 57 | 15.9 |
| D | 2 | 249 | 21447 | 1342.23 | 59 | 57 | 15.9 |
| D | 13 | 249 | 20507 | 1283.24 | 59 | 57 | 15.9 |
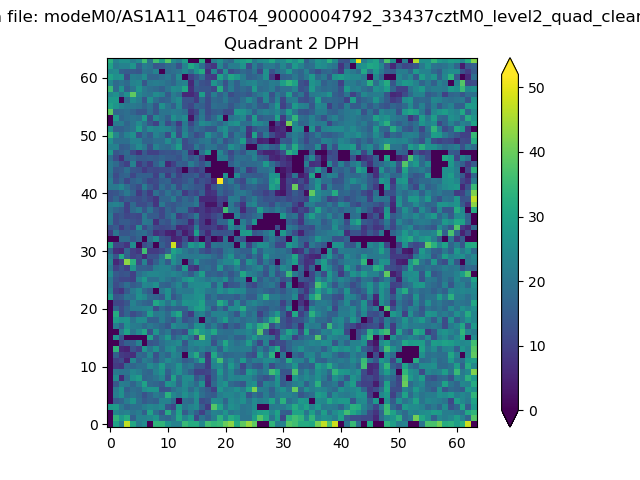
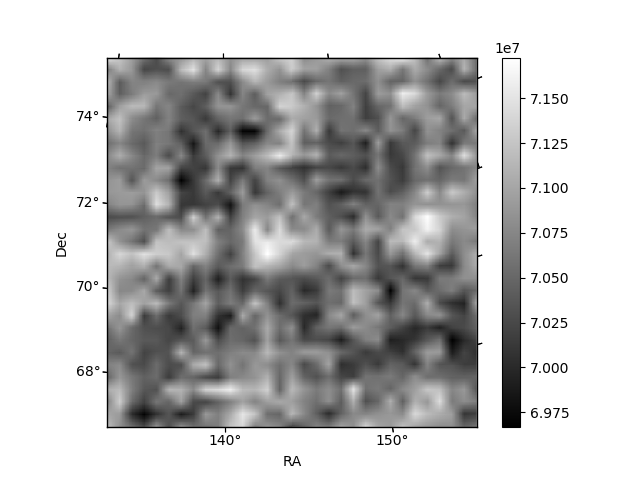
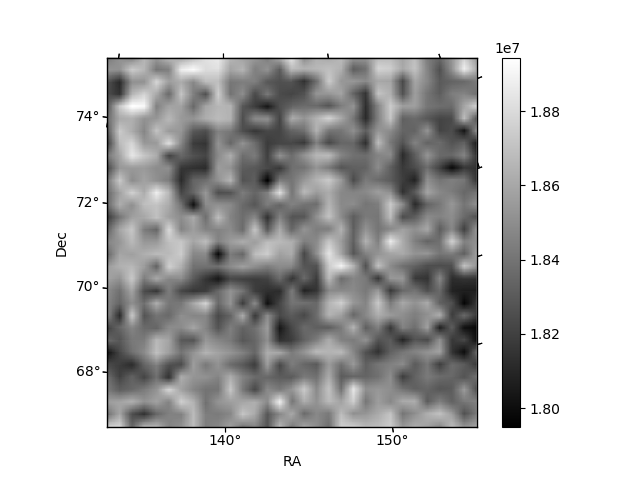
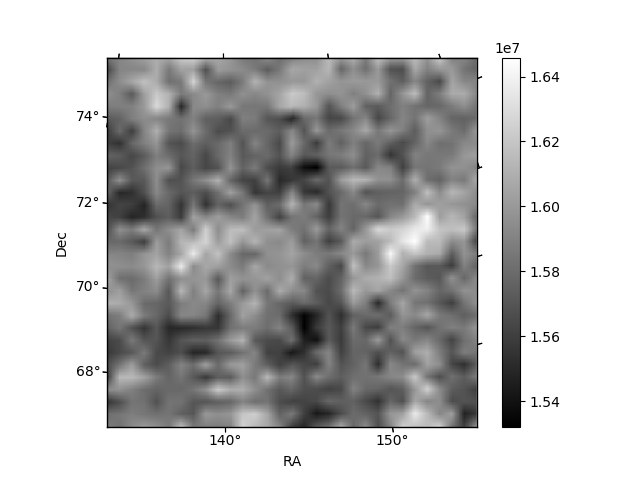
Histogram calculated using DETX and DETY for each event in the final _common_clean file
| Quadrant A | 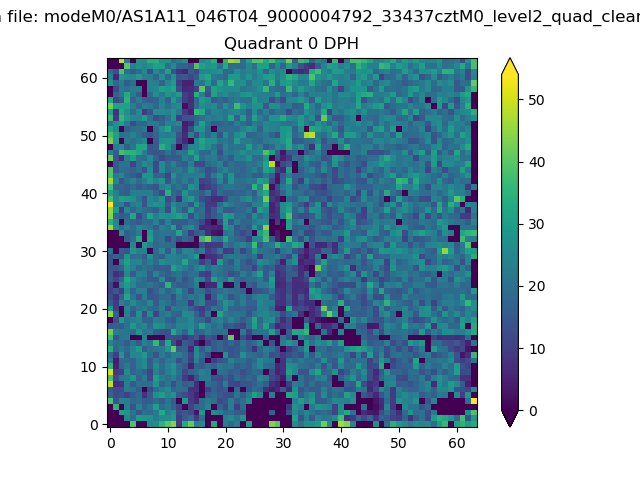 |
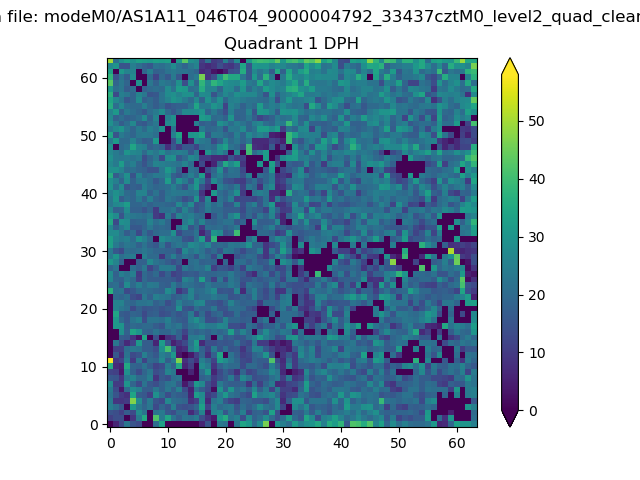 |
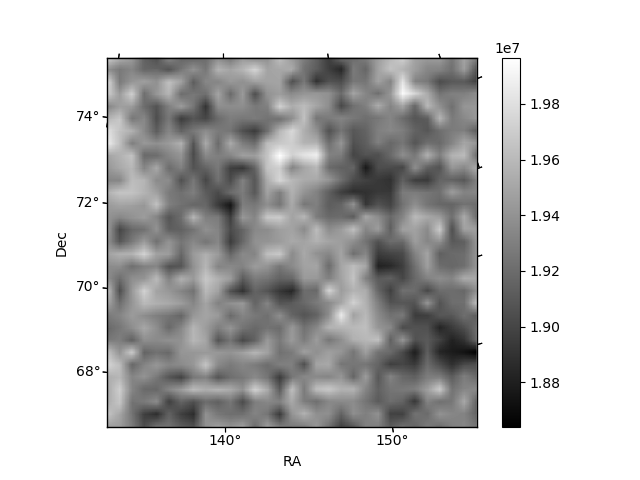
Quadrant B |
|---|---|---|---|
| Quadrant D | 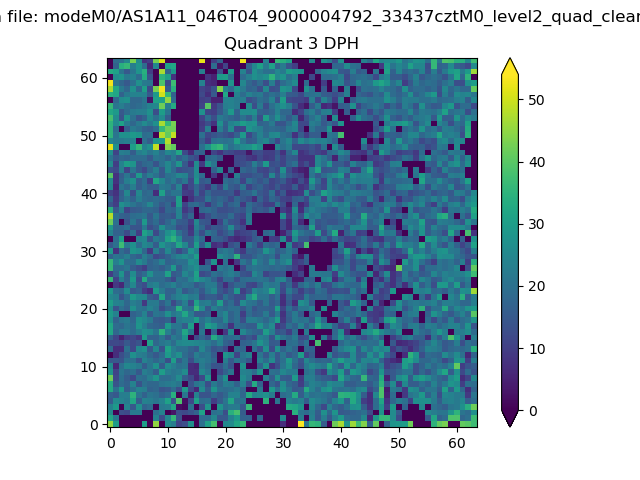 |
 |
Quadrant C |
| Plot type | Count rate plots | Images |
|---|---|---|
| Comparison with Poisson distribution Blue bars denote a histogram of data divided into 1 sec bins. Red curve is a Poisson curve with rate = median count rate of data. |
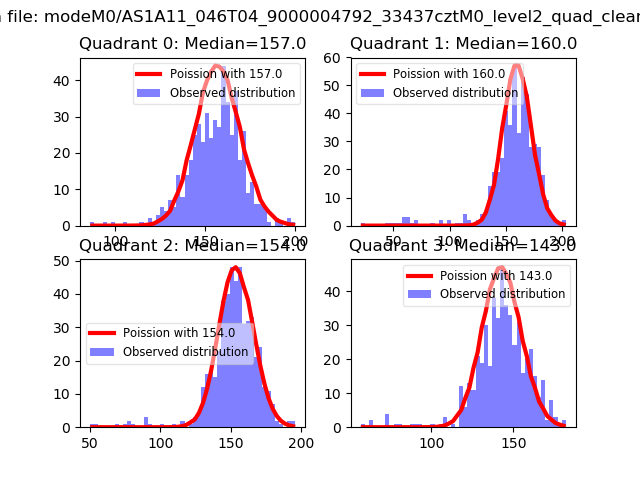 |
 |
| Quadrant-wise count rates Data is divided into 100 sec bins |
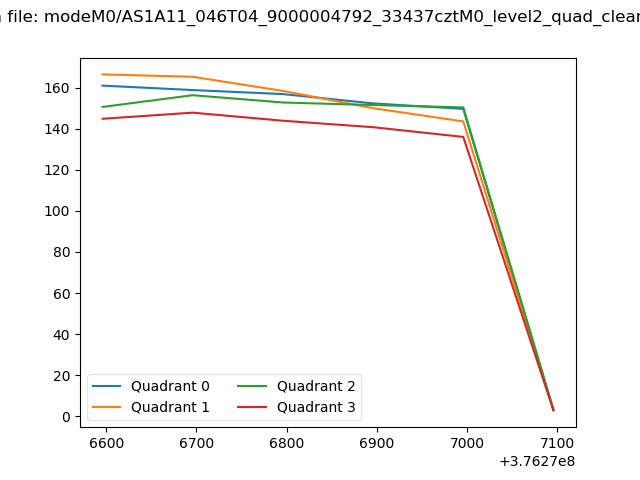 |
|
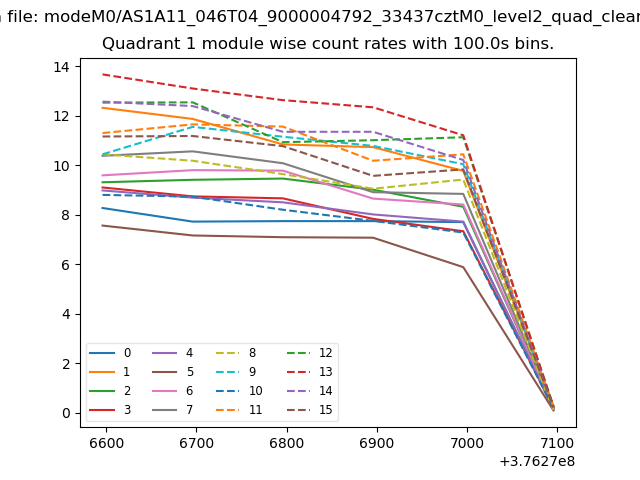
| Module-wise count rates for Quadrant A Data is divided into 100 sec bins |
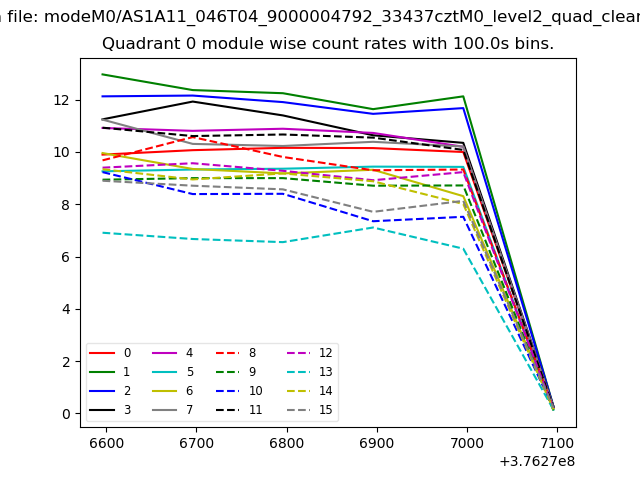 |
 |
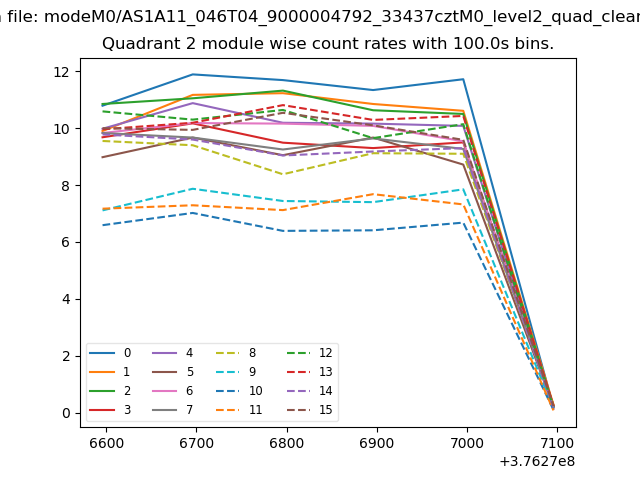
| Module-wise count rates for Quadrant B Data is divided into 100 sec bins |
 |
 |
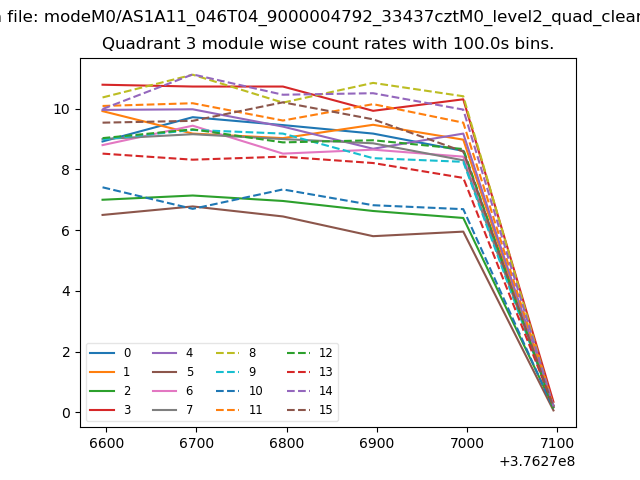
| Module-wise count rates for Quadrant C Data is divided into 100 sec bins |
 |
 |
| Module-wise count rates for Quadrant D Data is divided into 100 sec bins |
 |
 |
| Parameter | Plot |
|---|---|
| CZT HV Monitor | 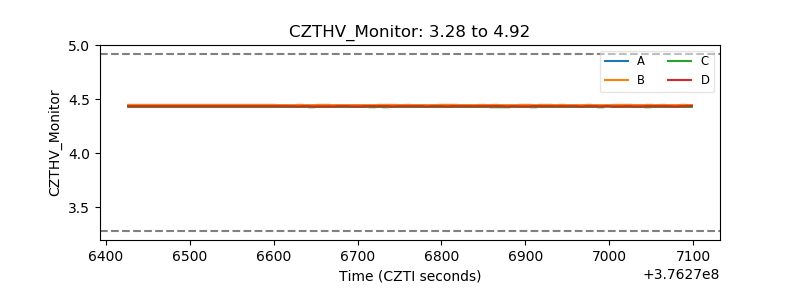 |
| D_VDD | 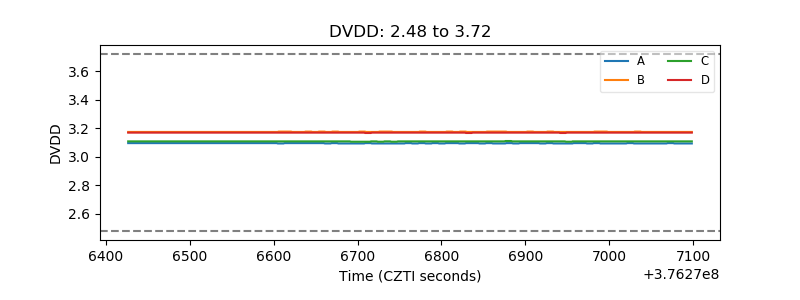 |
| Temperature 1 | 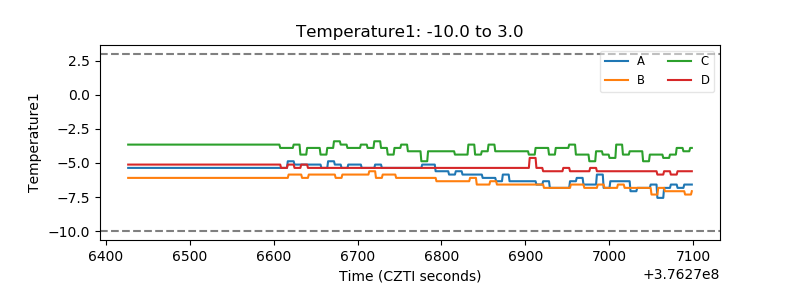 |
| Veto HV Monitor |  |
| Veto LLD | 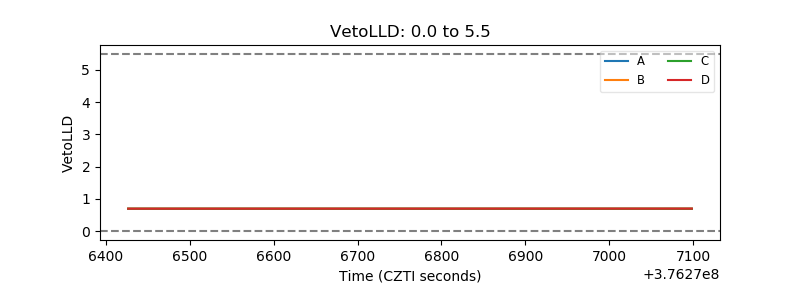 |
| Alpha Counter | 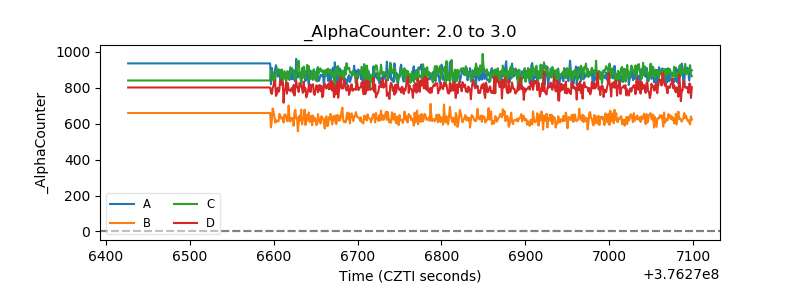 |
| _CPM_Rate | 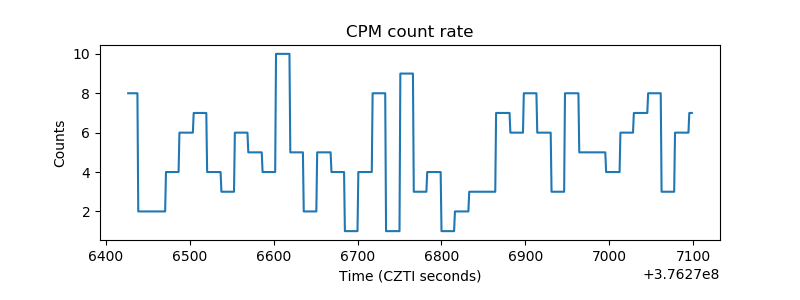 |
| CZT Counter | 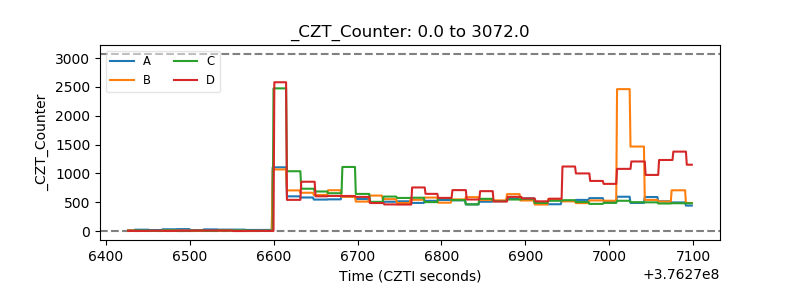 |
| +2.5 Volts monitor |  |
| +5 Volts monitor | 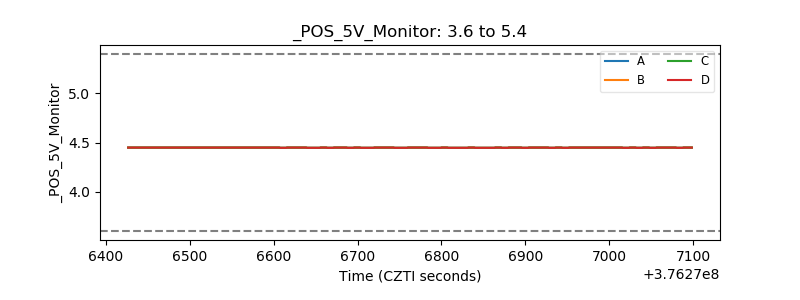 |
| _ROLL_ROT | 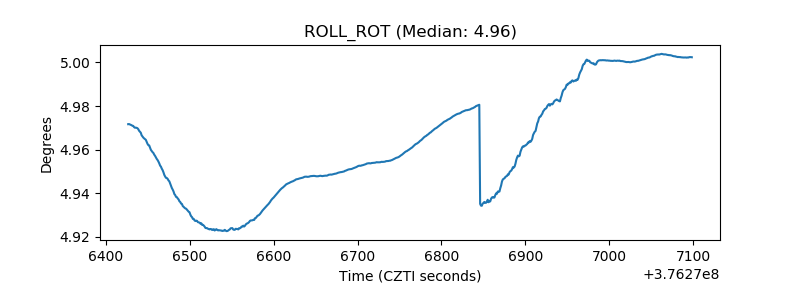 |
| _Roll_DEC | 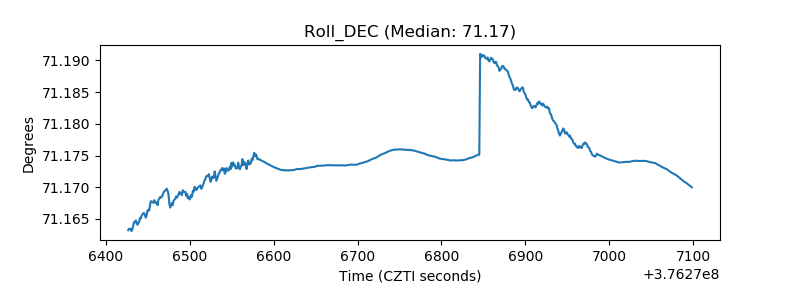 |
| _Roll_RA | 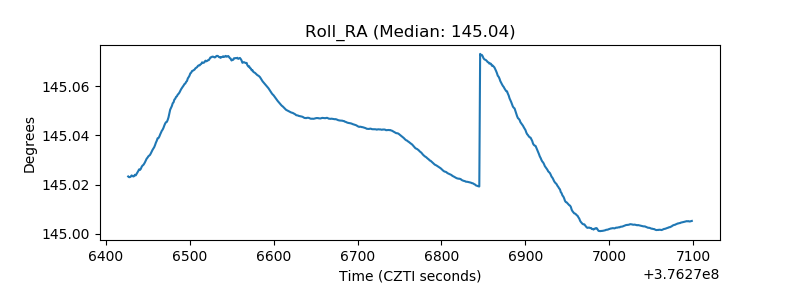 |
| Veto Counter | 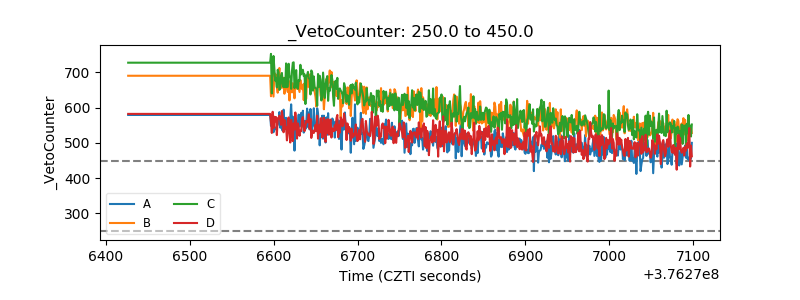 |