| Param | Original file | Final file |
|---|---|---|
| Filename | modeM0/AS1A11_065T01_9000004794cztM0_level2.fits | modeM0/AS1A11_065T01_9000004794cztM0_level2_quad_clean.evt |
| Size (bytes) | 266,071,680 | 199,860,480 |
| Size | 253.7 MB | 190.6 MB |
| Events in quadrant A | 1,724,554 | 1,181,551 |
| Events in quadrant B | 1,564,614 | 1,085,831 |
| Events in quadrant C | 1,639,822 | 1,093,714 |
| Events in quadrant D | 1,163,310 | 728,013 |
| Mode SS | |||
|---|---|---|---|
| Quadrant | BADHDUFLAG | Total packets | Discarded packets |
| A | 0 | 582 | 0 |
| B | 0 | 582 | 0 |
| C | 0 | 582 | 0 |
| D | 0 | 582 | 0 |
| Mode M0 | |||
|---|---|---|---|
| Quadrant | BADHDUFLAG | Total packets | Discarded packets |
| A | 0 | 58220 | 0 |
| B | 0 | 80719 | 0 |
| C | 0 | 61819 | 0 |
| D | 0 | 132962 | 0 |
| Mode M9 | |||
|---|---|---|---|
| Quadrant | BADHDUFLAG | Total packets | Discarded packets |
| A | 0 | 114 | 0 |
| B | 0 | 114 | 0 |
| C | 0 | 114 | 0 |
| D | 0 | 114 | 0 |
| Quadrant | Total seconds | Saturated seconds | Saturation percentage |
|---|---|---|---|
| A | 28536 | 31 | 0.108635% |
| B | 28536 | 2261 | 7.923325% |
| C | 28536 | 256 | 0.897112% |
| D | 28536 | 7217 | 25.290861% |
Noise dominated data is calculated using 1-second bins in cleaned event files. If a bin has >2000 counts, and if more than 50% of those come from <1% of pixels, then it is considered to be noise-dominated and hence unusable.
| Quadrant | # 1 sec bins | Bins with >0 counts | Bins with >2000 counts | High rate bins dominated by noise | Noise dominated (total time) | Noise dominated (detector-on time) | Marked lightcurve |
|---|---|---|---|---|---|---|---|
| A | 39923 | 28536 | 0 | 0 | 0.00% | 0.00% |  |
| B | 39923 | 28529 | 0 | 0 | 0.00% | 0.00% |  |
| C | 39923 | 28533 | 0 | 0 | 0.00% | 0.00% |  |
| D | 39923 | 27102 | 0 | 0 | 0.00% | 0.00% |  |
Top three noisy pixels from each quadrant. If the there are fewer than three noisy pixels in the level2.evt file, extra rows are filled as -1
| Pixel properties | Quadrant properties | ||||||
|---|---|---|---|---|---|---|---|
| Quadrant | DetID | PixID | Counts | Sigma | Mean | Median | Sigma |
| A | 0 | 29 | 1422 | 8.87 | 449 | 423 | 112.6 |
| A | 9 | 19 | 1390 | 8.59 | 449 | 423 | 112.6 |
| A | 7 | 110 | 1381 | 8.51 | 449 | 423 | 112.6 |
| B | 2 | 9 | 1319 | 11.0 | 415 | 398 | 83.7 |
| B | 3 | 80 | 1237 | 10.02 | 415 | 398 | 83.7 |
| B | 2 | 8 | 1130 | 8.74 | 415 | 398 | 83.7 |
| C | 1 | 81 | 1420 | 9.22 | 434 | 410 | 109.4 |
| C | 1 | 80 | 1347 | 8.56 | 434 | 410 | 109.4 |
| C | 3 | 187 | 1129 | 6.57 | 434 | 410 | 109.4 |
| D | 7 | 3 | 903 | 6.62 | 333 | 304 | 90.4 |
| D | 6 | 38 | 881 | 6.38 | 333 | 304 | 90.4 |
| D | 10 | 189 | 878 | 6.35 | 333 | 304 | 90.4 |
Histogram calculated using DETX and DETY for each event in the final _common_clean file
| Quadrant A |  |
 |
Quadrant B |
|---|---|---|---|
| Quadrant D |  |
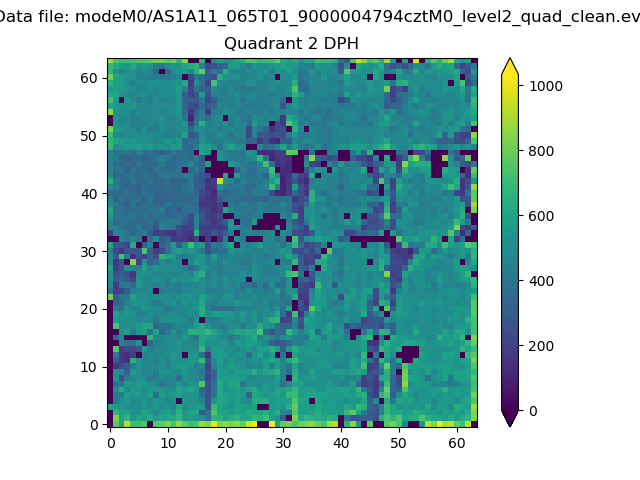 |
Quadrant C |
| Plot type | Count rate plots | Images |
|---|---|---|
| Comparison with Poisson distribution Blue bars denote a histogram of data divided into 1 sec bins. Red curve is a Poisson curve with rate = median count rate of data. |
 |
 |
| Quadrant-wise count rates Data is divided into 100 sec bins |
 |
|
| Module-wise count rates for Quadrant A Data is divided into 100 sec bins |
 |
 |
| Module-wise count rates for Quadrant B Data is divided into 100 sec bins |
 |
 |
| Module-wise count rates for Quadrant C Data is divided into 100 sec bins |
 |
 |
| Module-wise count rates for Quadrant D Data is divided into 100 sec bins |
 |
 |
| Parameter | Plot |
|---|---|
| CZT HV Monitor |  |
| D_VDD | 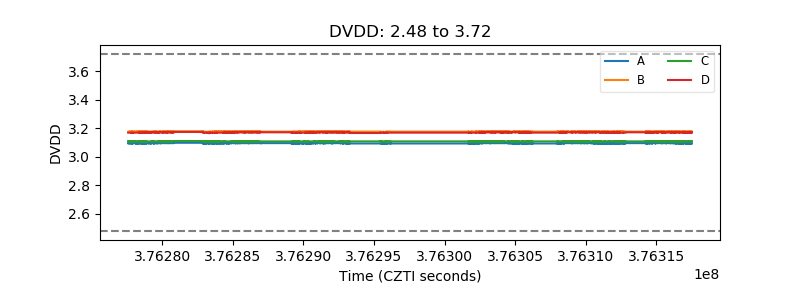 |
| Temperature 1 |  |
| Veto HV Monitor |  |
| Veto LLD |  |
| Alpha Counter |  |
| _CPM_Rate |  |
| CZT Counter |  |
| +2.5 Volts monitor |  |
| +5 Volts monitor |  |
| _ROLL_ROT |  |
| _Roll_DEC |  |
| _Roll_RA |  |
| Veto Counter |  |