| Param | Original file | Final file |
|---|---|---|
| Filename | modeM0/AS1A11_065T01_9000004794_33437cztM0_level2.evt | modeM0/AS1A11_065T01_9000004794_33437cztM0_level2_quad_clean.evt |
| Size (bytes) | 463,173,120 | 49,187,520 |
| Size | 441.7 MB | 46.9 MB |
| Events in quadrant A | 1,987,567 | 319,861 |
| Events in quadrant B | 3,966,467 | 295,407 |
| Events in quadrant C | 2,273,822 | 312,784 |
| Events in quadrant D | 5,521,645 | 272,068 |
| Mode SS | |||
|---|---|---|---|
| Quadrant | BADHDUFLAG | Total packets | Discarded packets |
| A | 0 | 84 | 0 |
| B | 0 | 84 | 0 |
| C | 0 | 84 | 0 |
| D | 0 | 84 | 0 |
| Mode M0 | |||
|---|---|---|---|
| Quadrant | BADHDUFLAG | Total packets | Discarded packets |
| A | 0 | 8260 | 2 |
| B | 0 | 14409 | 1 |
| C | 0 | 9106 | 1 |
| D | 0 | 19218 | 1 |
| Mode M9 | |||
|---|---|---|---|
| Quadrant | BADHDUFLAG | Total packets | Discarded packets |
| A | 0 | 20 | 0 |
| B | 0 | 20 | 0 |
| C | 0 | 20 | 0 |
| D | 0 | 20 | 0 |
| Quadrant | Total seconds | Saturated seconds | Saturation percentage |
|---|---|---|---|
| A | 4095 | 4 | 0.097680% |
| B | 4095 | 626 | 15.286935% |
| C | 4095 | 43 | 1.050061% |
| D | 4095 | 822 | 20.073260% |
Noise dominated data is calculated using 1-second bins in cleaned event files. If a bin has >2000 counts, and if more than 50% of those come from <1% of pixels, then it is considered to be noise-dominated and hence unusable.
| Quadrant | # 1 sec bins | Bins with >0 counts | Bins with >2000 counts | High rate bins dominated by noise | Noise dominated (total time) | Noise dominated (detector-on time) | Marked lightcurve |
|---|---|---|---|---|---|---|---|
| A | 6128 | 4096 | 0 | 0 | 0.00% | 0.00% | 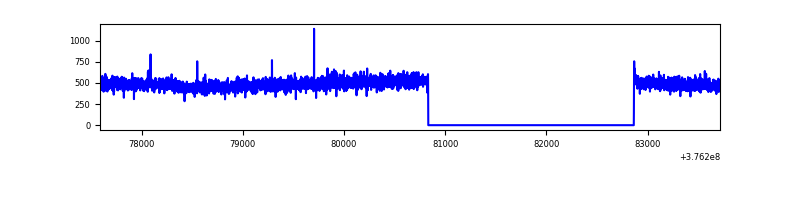 |
| B | 6128 | 4096 | 547 | 547 | 8.93% | 13.35% | 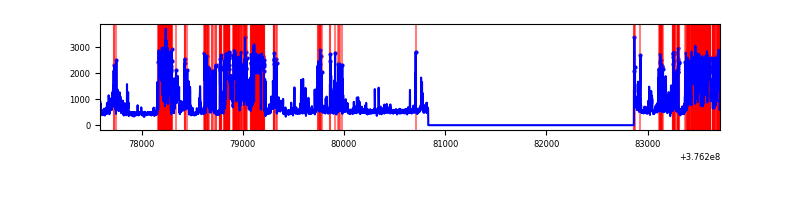 |
| C | 6128 | 4096 | 39 | 39 | 0.64% | 0.95% | 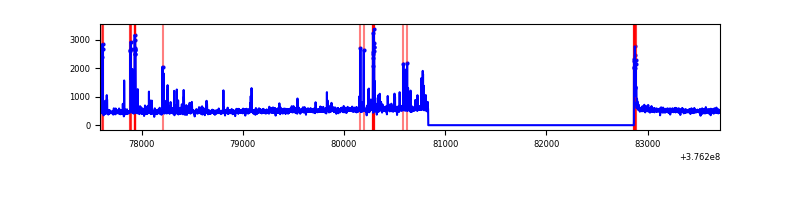 |
| D | 6128 | 4096 | 880 | 880 | 14.36% | 21.48% | 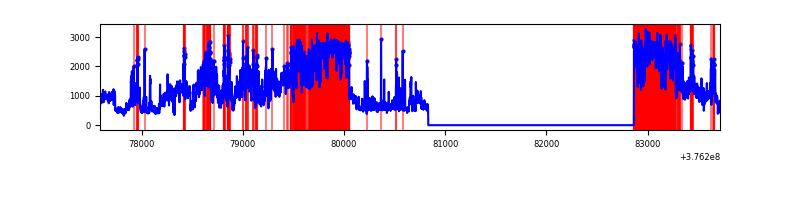 |
Top three noisy pixels from each quadrant. If the there are fewer than three noisy pixels in the level2.evt file, extra rows are filled as -1
| Pixel properties | Quadrant properties | ||||||
|---|---|---|---|---|---|---|---|
| Quadrant | DetID | PixID | Counts | Sigma | Mean | Median | Sigma |
| A | 15 | 47 | 41543 | 408.95 | 501 | 492 | 100.4 |
| A | 13 | 6 | 7818 | 72.98 | 501 | 492 | 100.4 |
| A | 13 | 254 | 7638 | 71.19 | 501 | 492 | 100.4 |
| B | 5 | 172 | 1585835 | 17588.53 | 470 | 459 | 90.1 |
| B | 4 | 251 | 373904 | 4143.09 | 470 | 459 | 90.1 |
| B | 15 | 85 | 65154 | 717.74 | 470 | 459 | 90.1 |
| C | 15 | 214 | 174579 | 1595.4 | 475 | 479 | 109.1 |
| C | 14 | 254 | 123426 | 1126.65 | 475 | 479 | 109.1 |
| C | 1 | 23 | 62254 | 566.09 | 475 | 479 | 109.1 |
| D | 1 | 52 | 2528071 | 23435.9 | 440 | 427 | 107.9 |
| D | 8 | 195 | 1127297 | 10448.16 | 440 | 427 | 107.9 |
| D | 13 | 249 | 49154 | 451.79 | 440 | 427 | 107.9 |
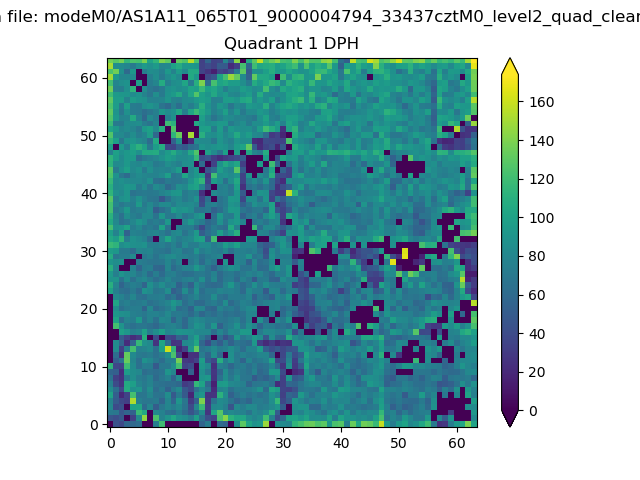
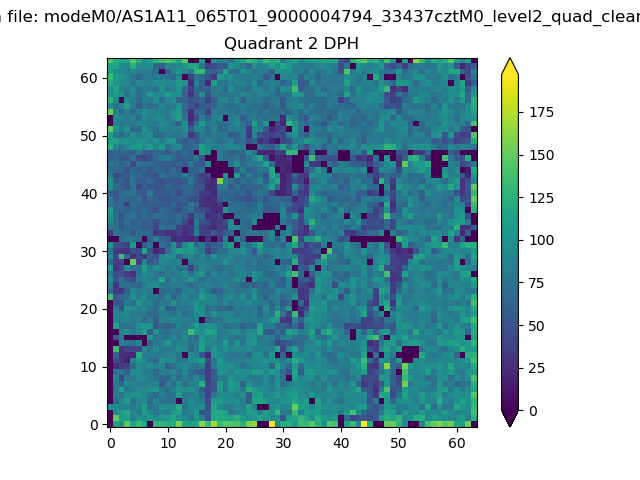
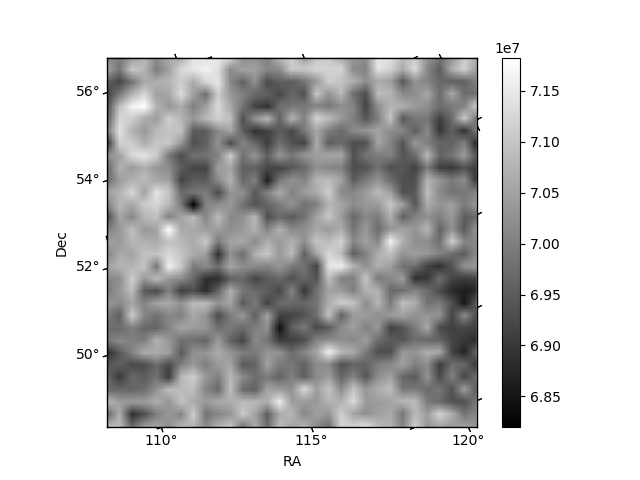
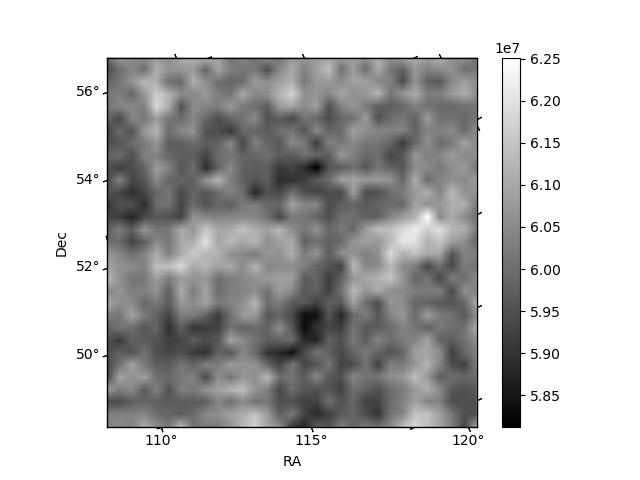
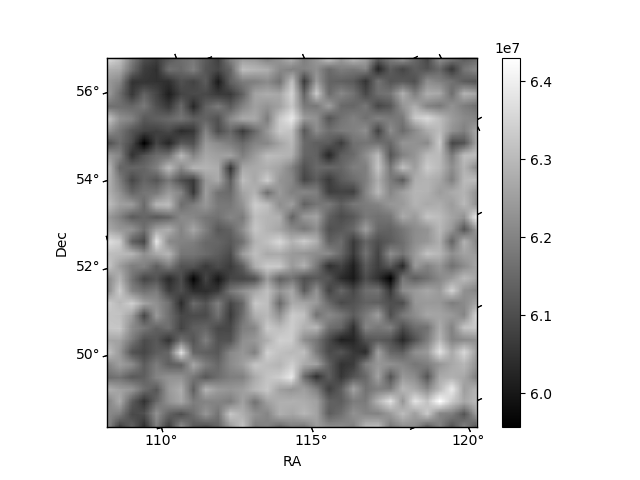
Histogram calculated using DETX and DETY for each event in the final _common_clean file
| Quadrant A |  |
 |
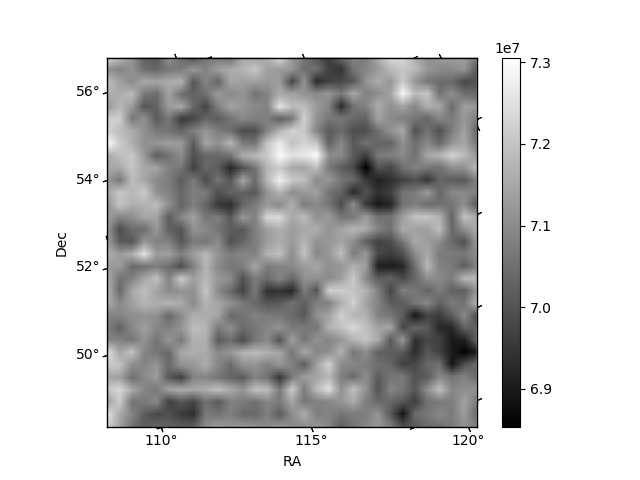
Quadrant B |
|---|---|---|---|
| Quadrant D |  |
 |
Quadrant C |
| Plot type | Count rate plots | Images |
|---|---|---|
| Comparison with Poisson distribution Blue bars denote a histogram of data divided into 1 sec bins. Red curve is a Poisson curve with rate = median count rate of data. |
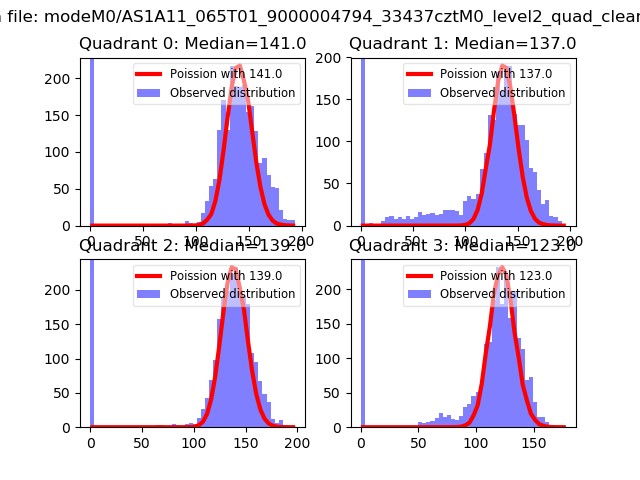 |
 |
| Quadrant-wise count rates Data is divided into 100 sec bins |
 |
|
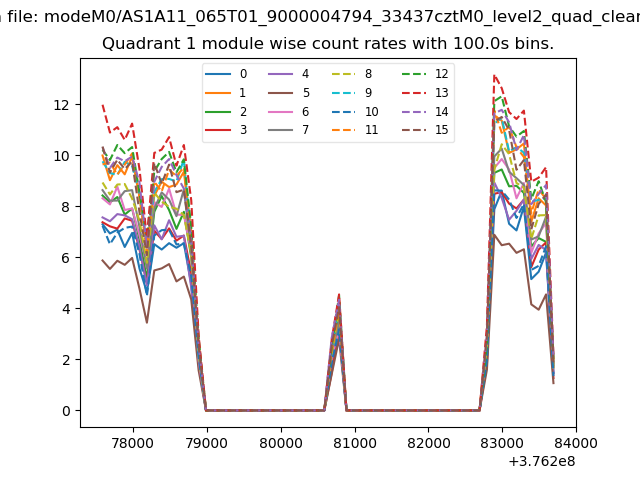
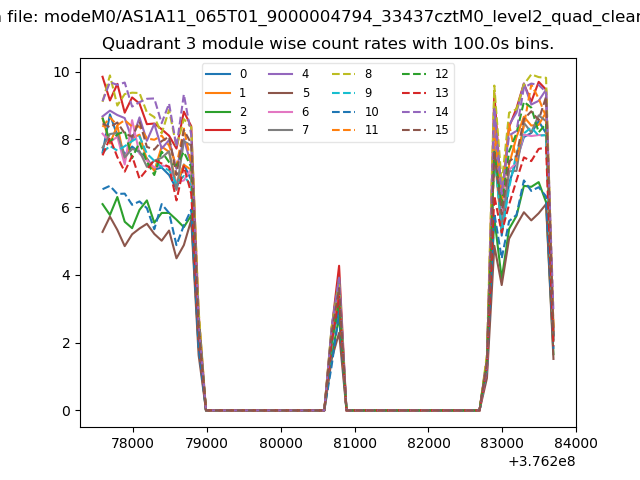
| Module-wise count rates for Quadrant A Data is divided into 100 sec bins |
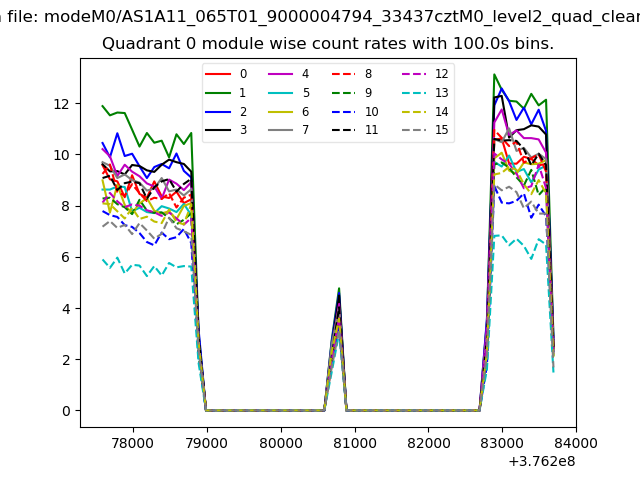 |
 |
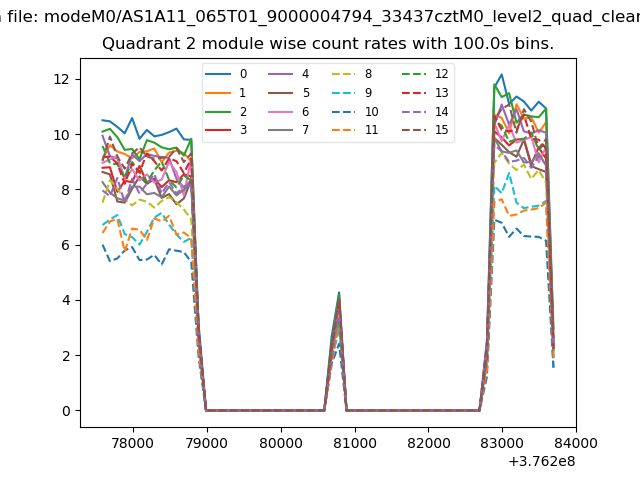
| Module-wise count rates for Quadrant B Data is divided into 100 sec bins |
 |
 |
| Module-wise count rates for Quadrant C Data is divided into 100 sec bins |
 |
 |
| Module-wise count rates for Quadrant D Data is divided into 100 sec bins |
 |
 |
| Parameter | Plot |
|---|---|
| CZT HV Monitor | 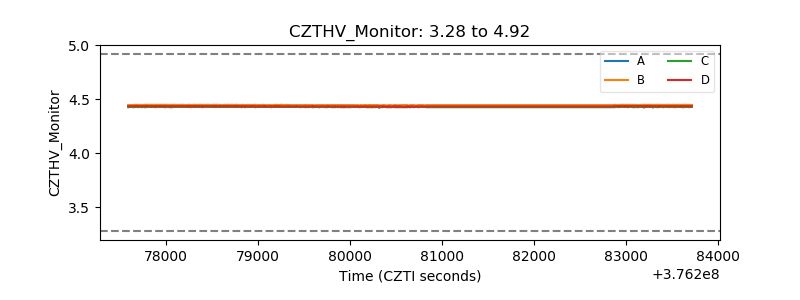 |
| D_VDD | 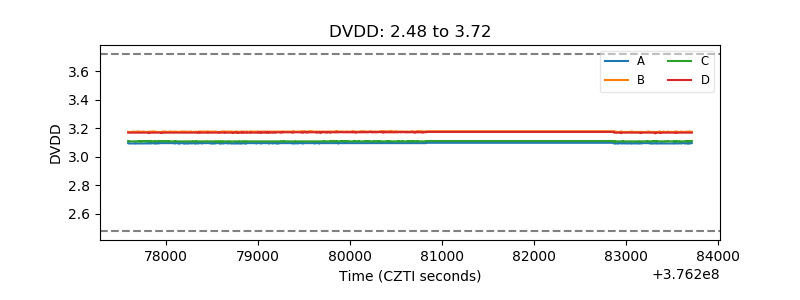 |
| Temperature 1 | 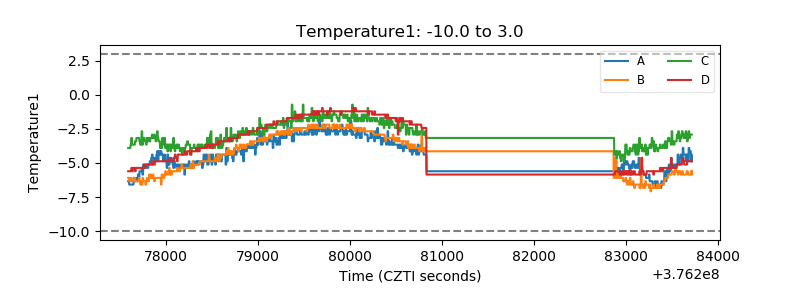 |
| Veto HV Monitor |  |
| Veto LLD | 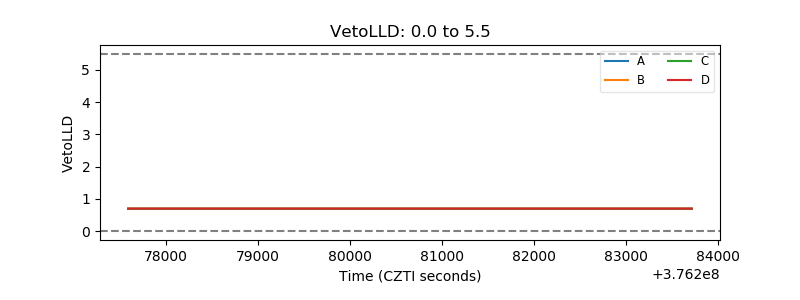 |
| Alpha Counter | 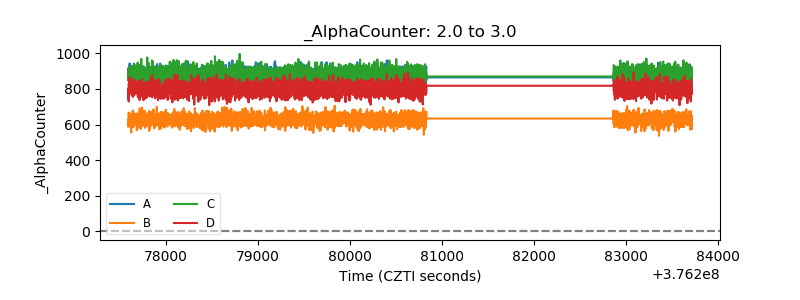 |
| _CPM_Rate |  |
| CZT Counter | 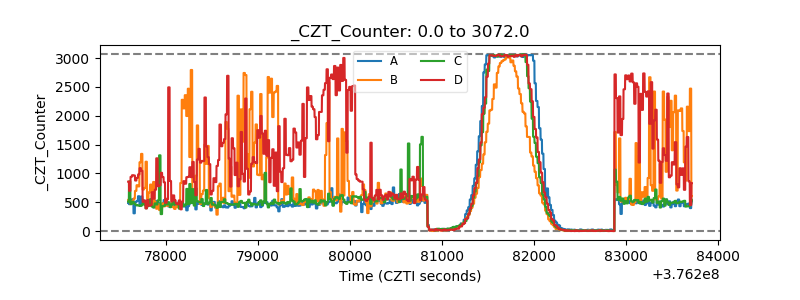 |
| +2.5 Volts monitor | 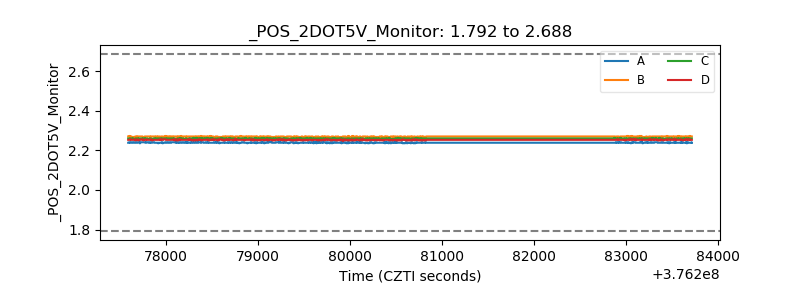 |
| +5 Volts monitor |  |
| _ROLL_ROT | 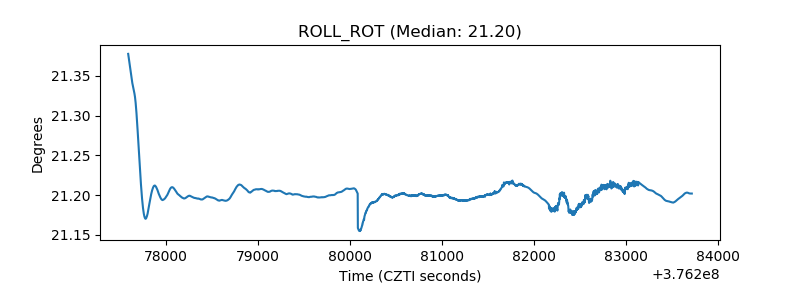 |
| _Roll_DEC | 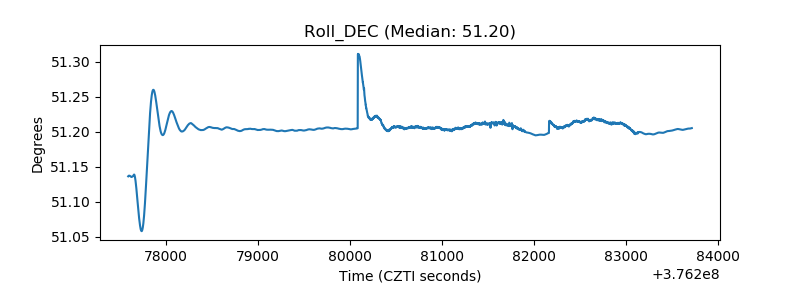 |
| _Roll_RA | 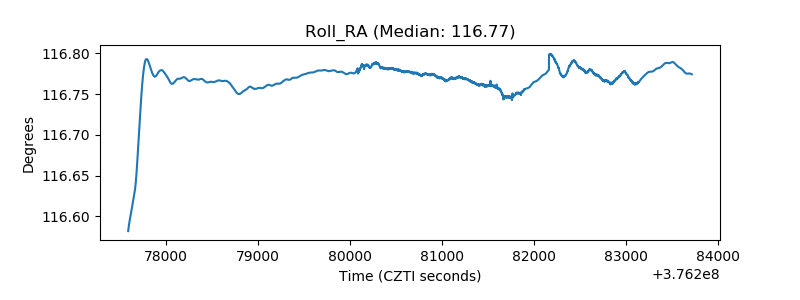 |
| Veto Counter | 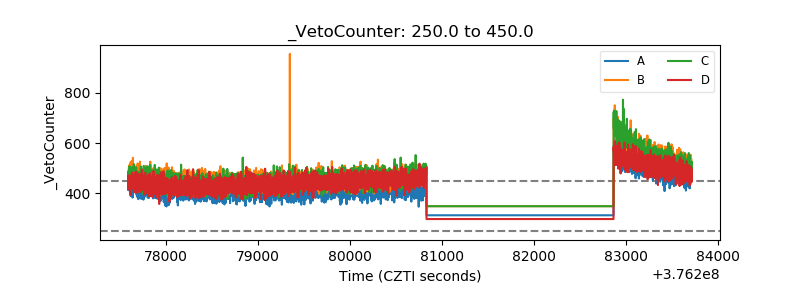 |