| Param | Original file | Final file |
|---|---|---|
| Filename | modeM0/AS1A11_065T01_9000004794_33439cztM0_level2.evt | modeM0/AS1A11_065T01_9000004794_33439cztM0_level2_quad_clean.evt |
| Size (bytes) | 465,324,480 | 67,132,800 |
| Size | 443.8 MB | 64.0 MB |
| Events in quadrant A | 2,721,563 | 439,725 |
| Events in quadrant B | 3,327,215 | 424,640 |
| Events in quadrant C | 2,851,578 | 423,048 |
| Events in quadrant D | 4,856,473 | 397,893 |
| Mode SS | |||
|---|---|---|---|
| Quadrant | BADHDUFLAG | Total packets | Discarded packets |
| A | 0 | 100 | 0 |
| B | 0 | 100 | 0 |
| C | 0 | 100 | 0 |
| D | 0 | 100 | 0 |
| Mode M0 | |||
|---|---|---|---|
| Quadrant | BADHDUFLAG | Total packets | Discarded packets |
| A | 0 | 10670 | 3 |
| B | 0 | 12877 | 2 |
| C | 0 | 11337 | 2 |
| D | 0 | 17869 | 2 |
| Mode M9 | |||
|---|---|---|---|
| Quadrant | BADHDUFLAG | Total packets | Discarded packets |
| A | 0 | 25 | 0 |
| B | 0 | 25 | 0 |
| C | 0 | 25 | 0 |
| D | 0 | 26 | 0 |
| Quadrant | Total seconds | Saturated seconds | Saturation percentage |
|---|---|---|---|
| A | 4954 | 8 | 0.161486% |
| B | 4954 | 273 | 5.510698% |
| C | 4954 | 92 | 1.857085% |
| D | 4954 | 236 | 4.763827% |
Noise dominated data is calculated using 1-second bins in cleaned event files. If a bin has >2000 counts, and if more than 50% of those come from <1% of pixels, then it is considered to be noise-dominated and hence unusable.
| Quadrant | # 1 sec bins | Bins with >0 counts | Bins with >2000 counts | High rate bins dominated by noise | Noise dominated (total time) | Noise dominated (detector-on time) | Marked lightcurve |
|---|---|---|---|---|---|---|---|
| A | 7077 | 4955 | 0 | 0 | 0.00% | 0.00% | 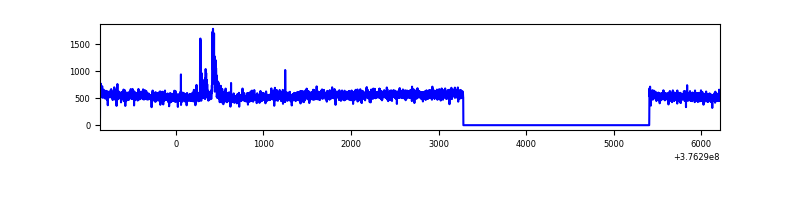 |
| B | 7077 | 4955 | 222 | 222 | 3.14% | 4.48% | 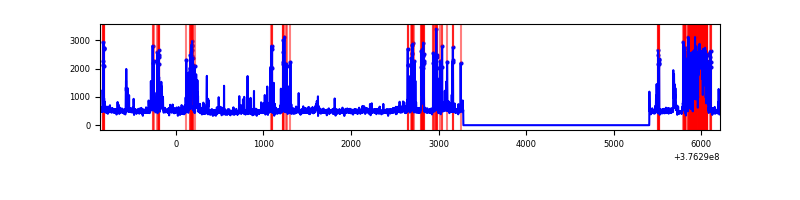 |
| C | 7077 | 4955 | 88 | 88 | 1.24% | 1.78% | 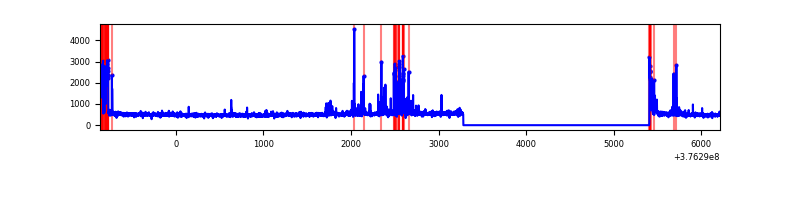 |
| D | 7077 | 4955 | 237 | 237 | 3.35% | 4.78% | 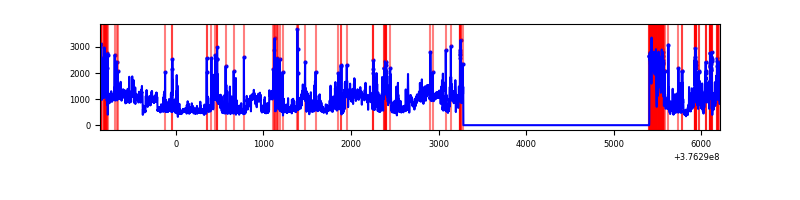 |
Top three noisy pixels from each quadrant. If the there are fewer than three noisy pixels in the level2.evt file, extra rows are filled as -1
| Pixel properties | Quadrant properties | ||||||
|---|---|---|---|---|---|---|---|
| Quadrant | DetID | PixID | Counts | Sigma | Mean | Median | Sigma |
| A | 15 | 47 | 299792 | 2446.24 | 608 | 597 | 122.3 |
| A | 14 | 128 | 59373 | 480.55 | 608 | 597 | 122.3 |
| A | 13 | 6 | 15225 | 119.6 | 608 | 597 | 122.3 |
| B | 5 | 172 | 869483 | 7744.95 | 588 | 575 | 112.2 |
| B | 5 | 255 | 43318 | 380.99 | 588 | 575 | 112.2 |
| B | 15 | 85 | 29830 | 260.76 | 588 | 575 | 112.2 |
| C | 1 | 23 | 220524 | 1688.89 | 573 | 578 | 130.2 |
| C | 15 | 214 | 216170 | 1655.46 | 573 | 578 | 130.2 |
| C | 0 | 10 | 137246 | 1049.43 | 573 | 578 | 130.2 |
| D | 8 | 195 | 1473056 | 9473.05 | 571 | 559 | 155.4 |
| D | 1 | 52 | 581056 | 3734.53 | 571 | 559 | 155.4 |
| D | 2 | 250 | 241584 | 1550.59 | 571 | 559 | 155.4 |
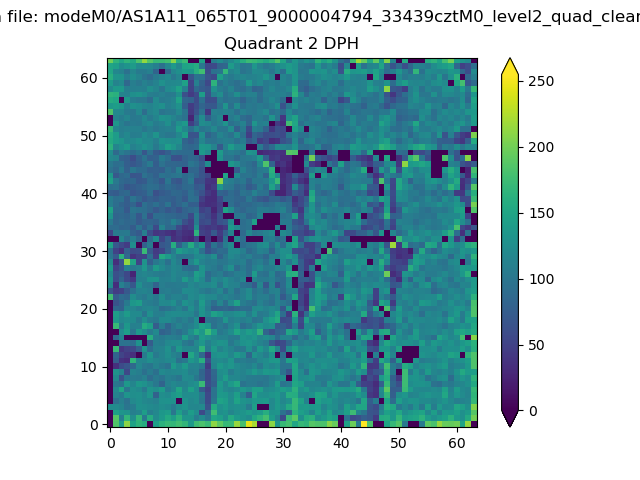
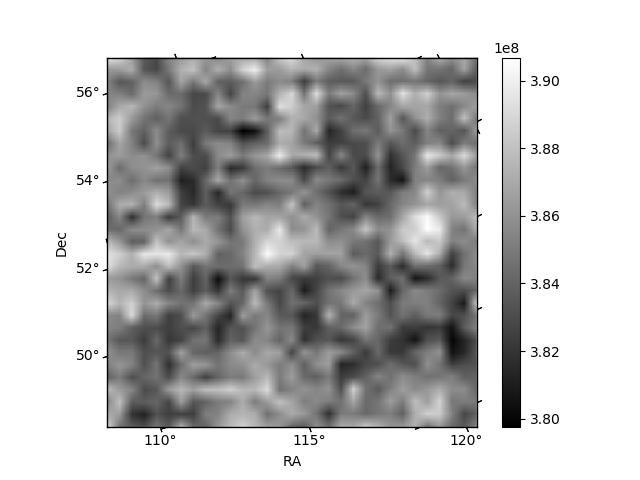
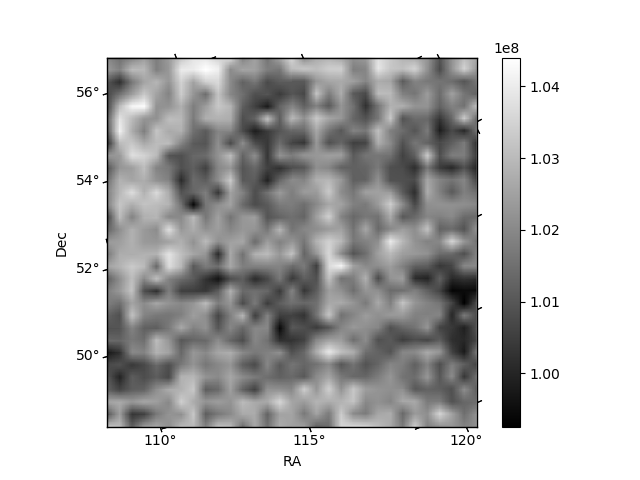
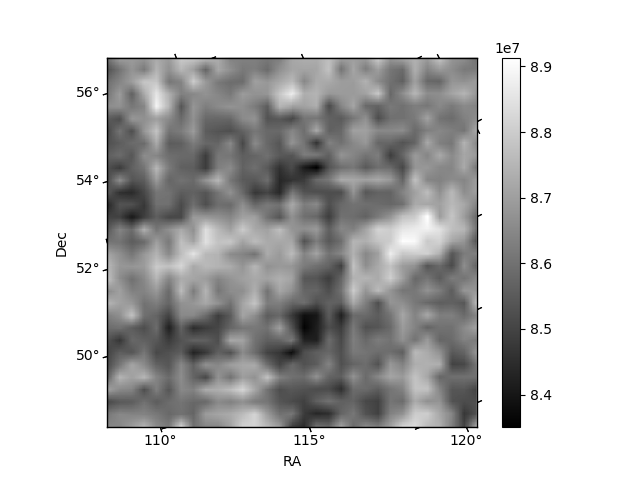
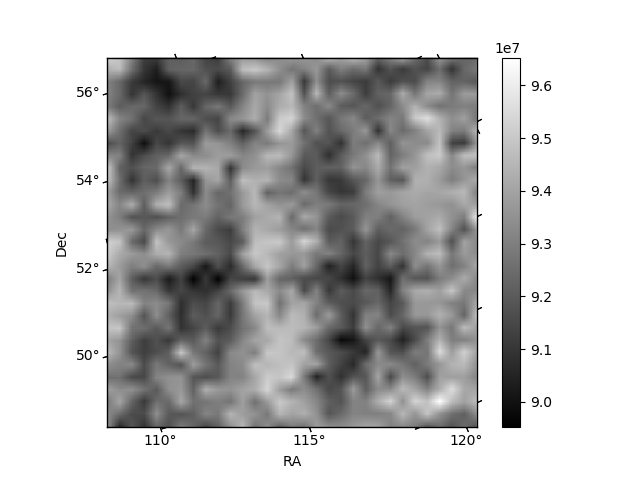
Histogram calculated using DETX and DETY for each event in the final _common_clean file
| Quadrant A | 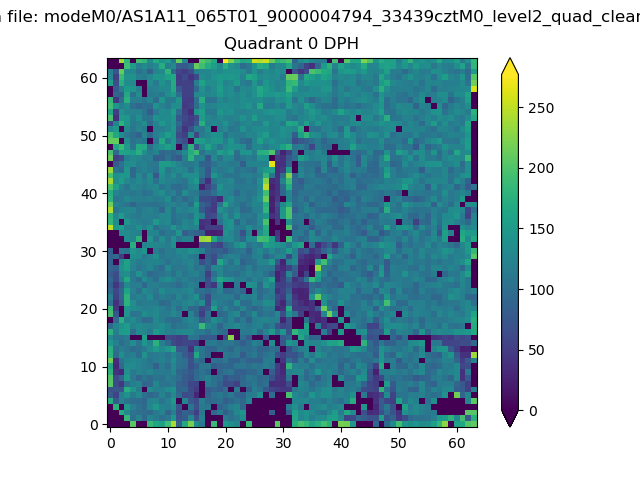 |
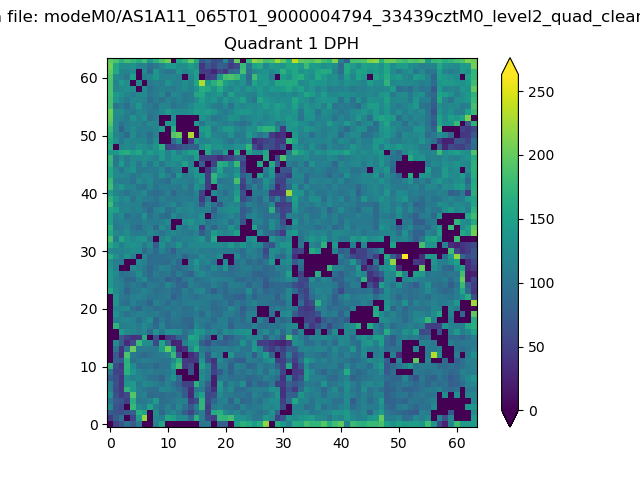 |
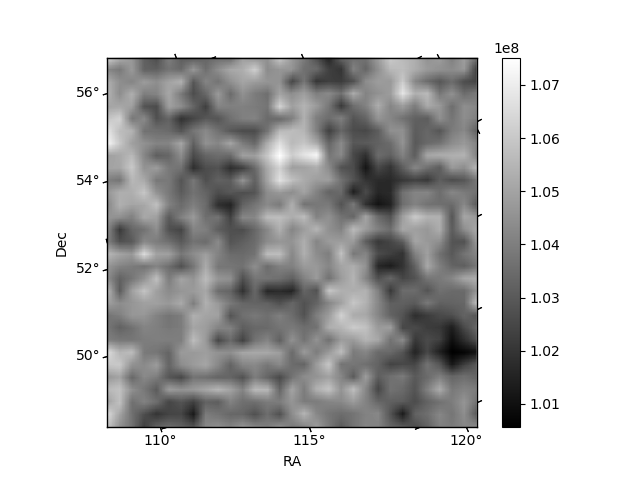
Quadrant B |
|---|---|---|---|
| Quadrant D | 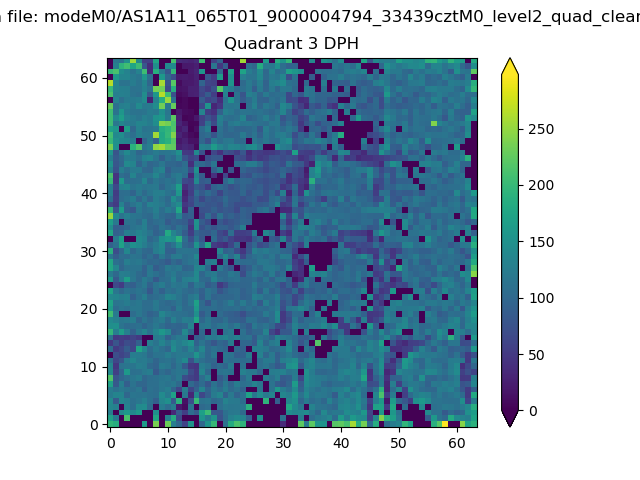 |
 |
Quadrant C |
| Plot type | Count rate plots | Images |
|---|---|---|
| Comparison with Poisson distribution Blue bars denote a histogram of data divided into 1 sec bins. Red curve is a Poisson curve with rate = median count rate of data. |
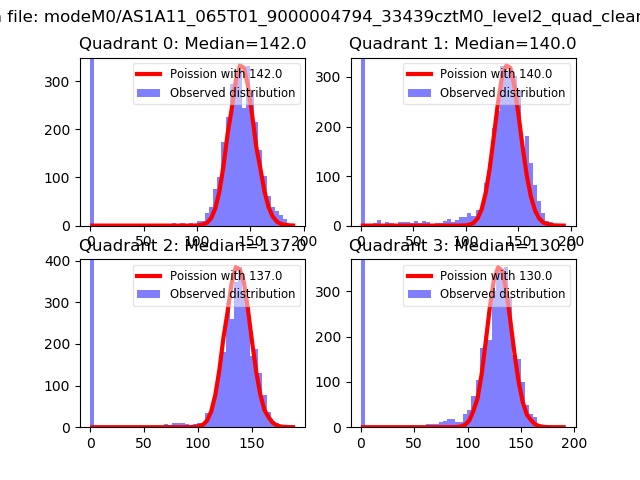 |
 |
| Quadrant-wise count rates Data is divided into 100 sec bins |
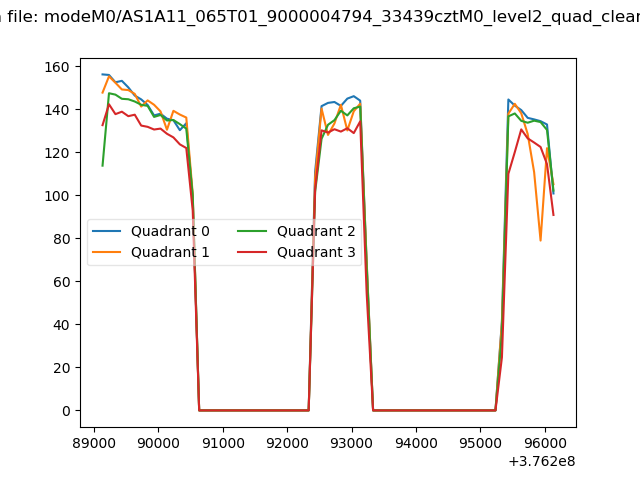 |
|
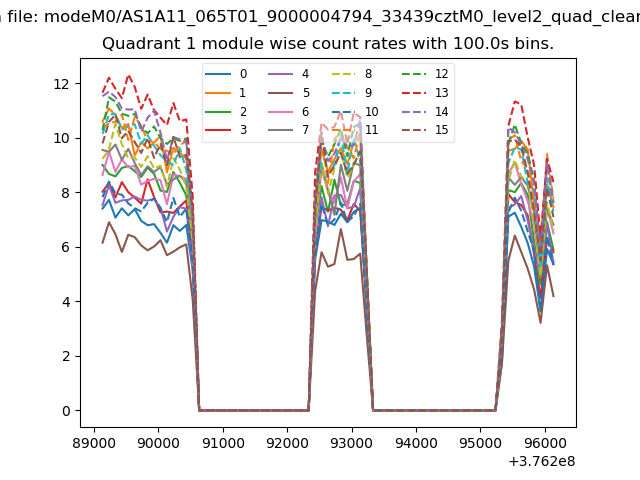
| Module-wise count rates for Quadrant A Data is divided into 100 sec bins |
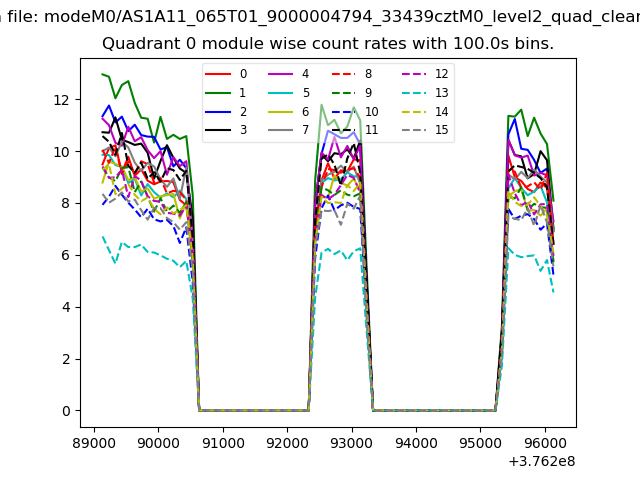 |
 |
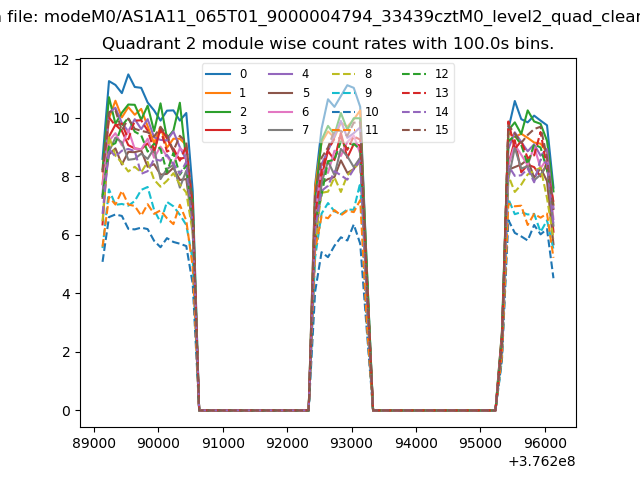
| Module-wise count rates for Quadrant B Data is divided into 100 sec bins |
 |
 |
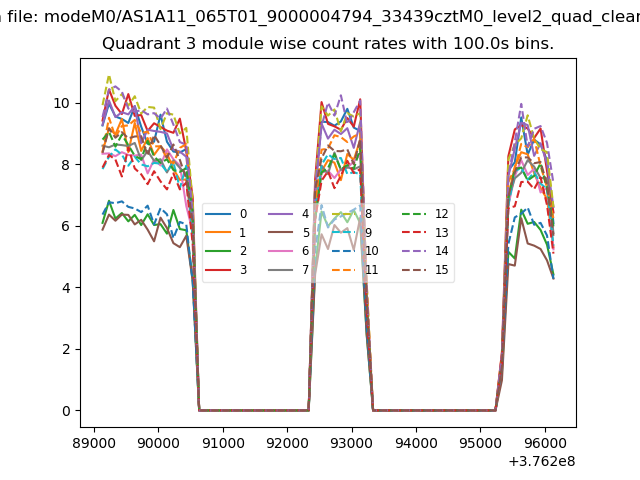
| Module-wise count rates for Quadrant C Data is divided into 100 sec bins |
 |
 |
| Module-wise count rates for Quadrant D Data is divided into 100 sec bins |
 |
 |
| Parameter | Plot |
|---|---|
| CZT HV Monitor | 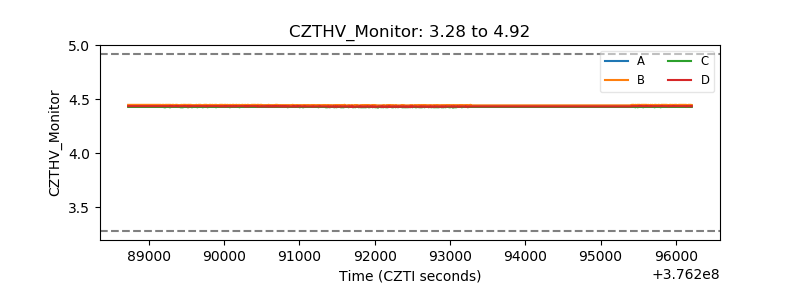 |
| D_VDD | 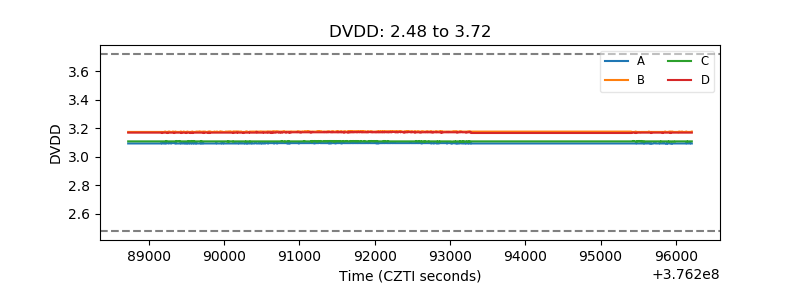 |
| Temperature 1 | 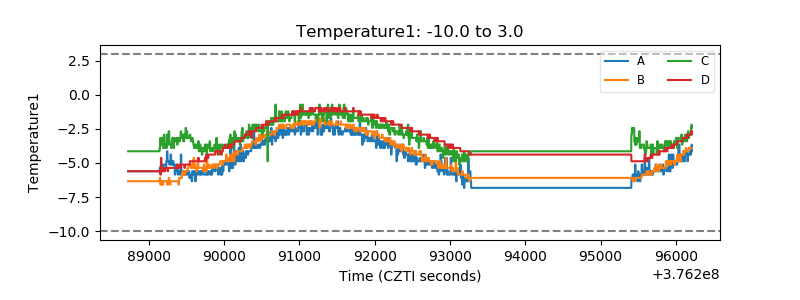 |
| Veto HV Monitor | 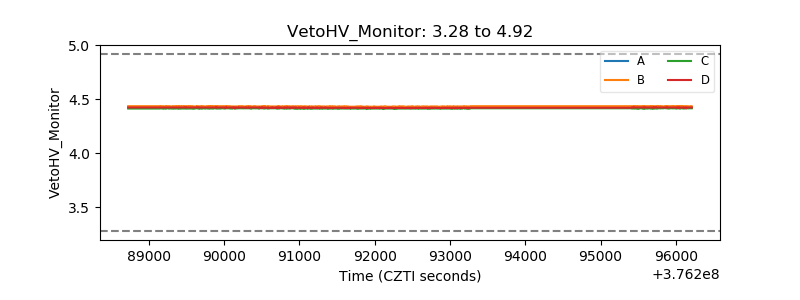 |
| Veto LLD |  |
| Alpha Counter | 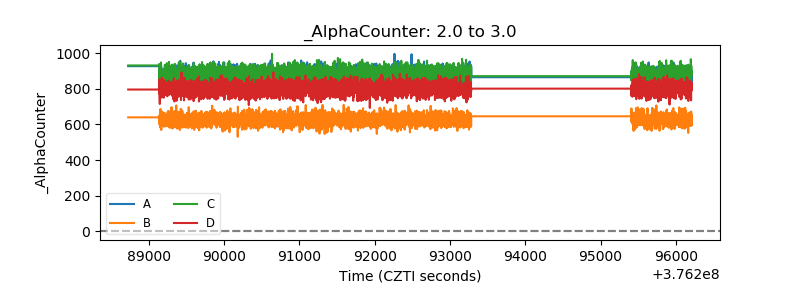 |
| _CPM_Rate | 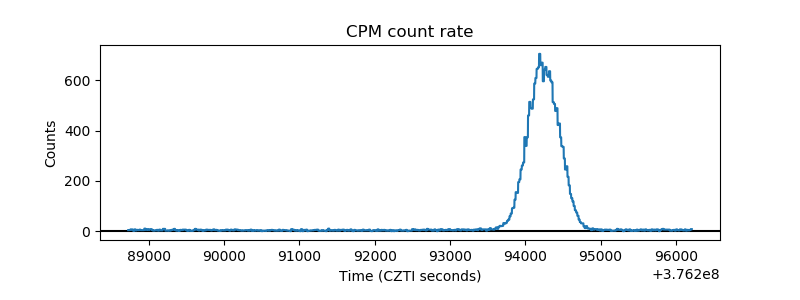 |
| CZT Counter | 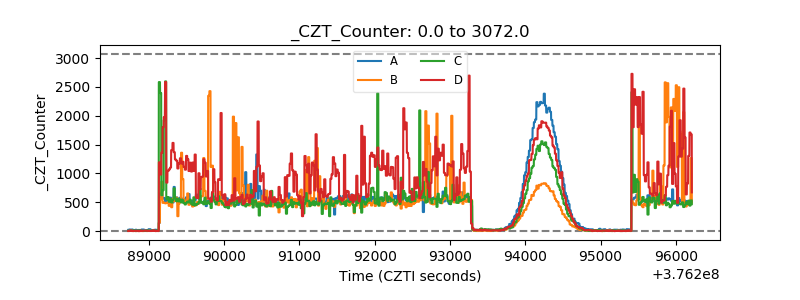 |
| +2.5 Volts monitor |  |
| +5 Volts monitor | 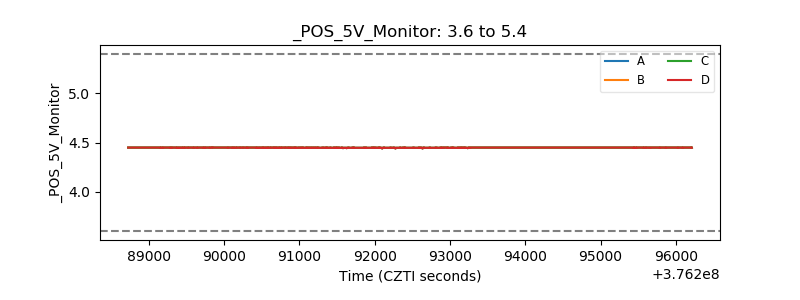 |
| _ROLL_ROT | 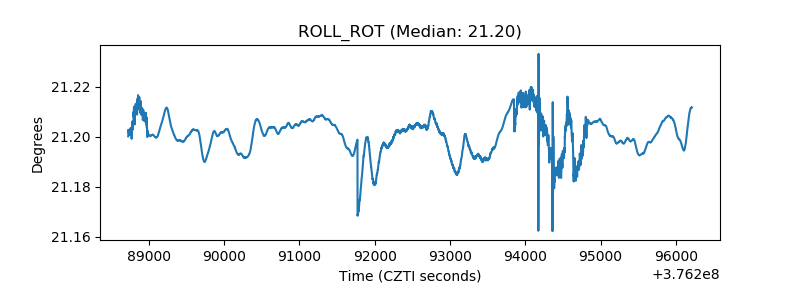 |
| _Roll_DEC | 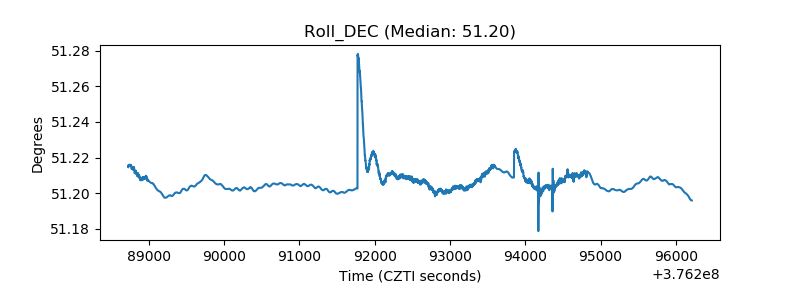 |
| _Roll_RA | 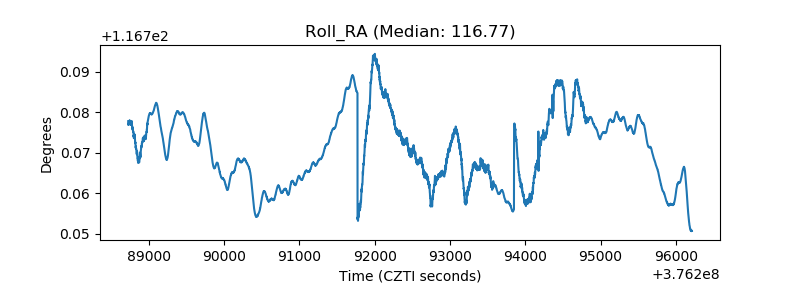 |
| Veto Counter | 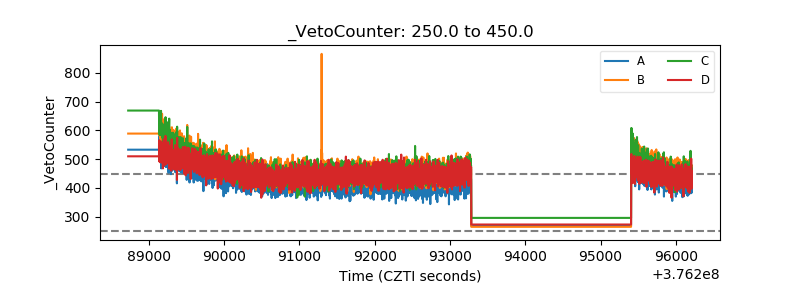 |