| Param | Original file | Final file |
|---|---|---|
| Filename | modeM0/AS1A11_065T01_9000004794_33440cztM0_level2.evt | modeM0/AS1A11_065T01_9000004794_33440cztM0_level2_quad_clean.evt |
| Size (bytes) | 597,695,040 | 59,904,000 |
| Size | 570.0 MB | 57.1 MB |
| Events in quadrant A | 2,496,908 | 407,527 |
| Events in quadrant B | 3,448,355 | 393,020 |
| Events in quadrant C | 2,603,274 | 399,343 |
| Events in quadrant D | 9,215,194 | 263,872 |
| Mode SS | |||
|---|---|---|---|
| Quadrant | BADHDUFLAG | Total packets | Discarded packets |
| A | 0 | 102 | 0 |
| B | 0 | 102 | 0 |
| C | 0 | 102 | 0 |
| D | 0 | 102 | 0 |
| Mode M0 | |||
|---|---|---|---|
| Quadrant | BADHDUFLAG | Total packets | Discarded packets |
| A | 0 | 10173 | 3 |
| B | 0 | 13370 | 2 |
| C | 0 | 10552 | 2 |
| D | 0 | 30736 | 2 |
| Mode M9 | |||
|---|---|---|---|
| Quadrant | BADHDUFLAG | Total packets | Discarded packets |
| A | 0 | 26 | 0 |
| B | 0 | 26 | 0 |
| C | 0 | 26 | 0 |
| D | 0 | 27 | 0 |
| Quadrant | Total seconds | Saturated seconds | Saturation percentage |
|---|---|---|---|
| A | 4978 | 6 | 0.120530% |
| B | 4978 | 304 | 6.106870% |
| C | 4978 | 28 | 0.562475% |
| D | 4978 | 2687 | 53.977501% |
Noise dominated data is calculated using 1-second bins in cleaned event files. If a bin has >2000 counts, and if more than 50% of those come from <1% of pixels, then it is considered to be noise-dominated and hence unusable.
| Quadrant | # 1 sec bins | Bins with >0 counts | Bins with >2000 counts | High rate bins dominated by noise | Noise dominated (total time) | Noise dominated (detector-on time) | Marked lightcurve |
|---|---|---|---|---|---|---|---|
| A | 6980 | 4979 | 0 | 0 | 0.00% | 0.00% | 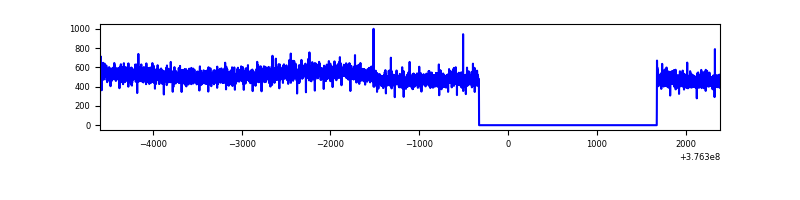 |
| B | 6980 | 4979 | 240 | 240 | 3.44% | 4.82% | 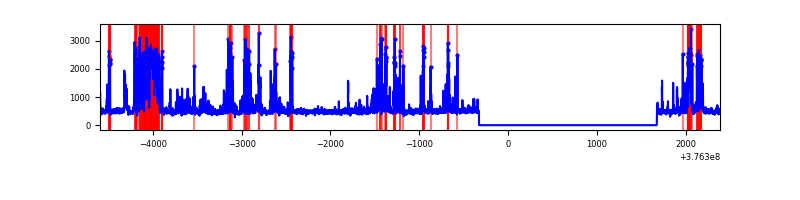 |
| C | 6980 | 4979 | 25 | 25 | 0.36% | 0.50% | 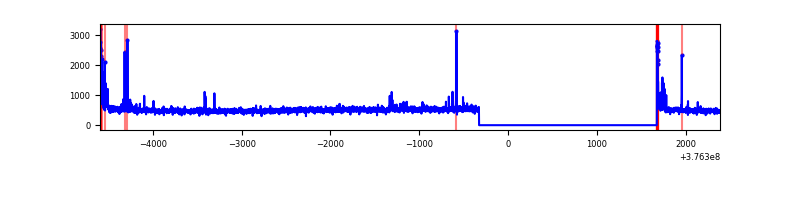 |
| D | 6980 | 4978 | 2695 | 2695 | 38.61% | 54.14% | 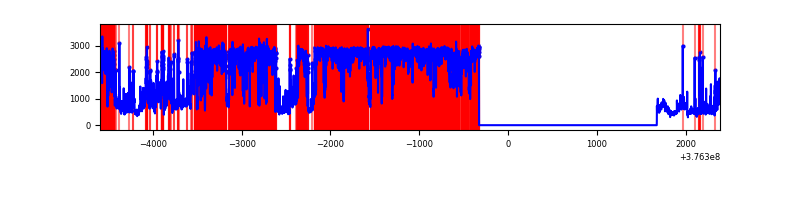 |
Top three noisy pixels from each quadrant. If the there are fewer than three noisy pixels in the level2.evt file, extra rows are filled as -1
| Pixel properties | Quadrant properties | ||||||
|---|---|---|---|---|---|---|---|
| Quadrant | DetID | PixID | Counts | Sigma | Mean | Median | Sigma |
| A | 15 | 47 | 182804 | 1523.58 | 595 | 585 | 119.6 |
| A | 13 | 6 | 13943 | 111.69 | 595 | 585 | 119.6 |
| A | 13 | 254 | 8409 | 65.42 | 595 | 585 | 119.6 |
| B | 5 | 172 | 787733 | 7175.83 | 575 | 562 | 109.7 |
| B | 5 | 255 | 225623 | 2051.65 | 575 | 562 | 109.7 |
| B | 0 | 213 | 61105 | 551.91 | 575 | 562 | 109.7 |
| C | 15 | 214 | 219018 | 1702.94 | 565 | 569 | 128.3 |
| C | 0 | 10 | 109688 | 850.65 | 565 | 569 | 128.3 |
| C | 14 | 254 | 35001 | 268.42 | 565 | 569 | 128.3 |
| D | 1 | 52 | 6674840 | 68184.84 | 399 | 389 | 97.9 |
| D | 8 | 195 | 568301 | 5801.67 | 399 | 389 | 97.9 |
| D | 2 | 250 | 108599 | 1105.45 | 399 | 389 | 97.9 |
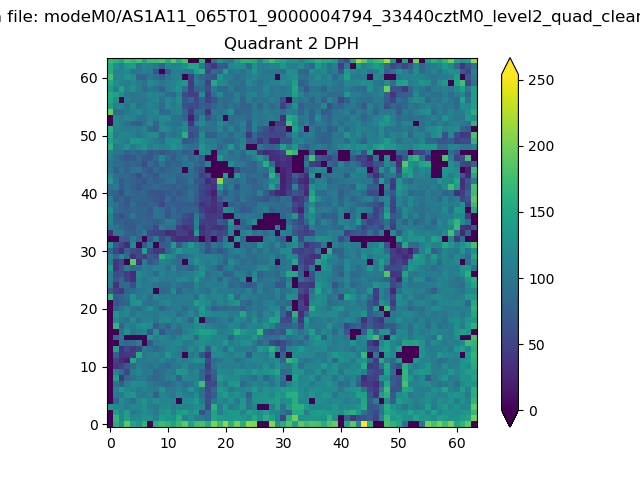
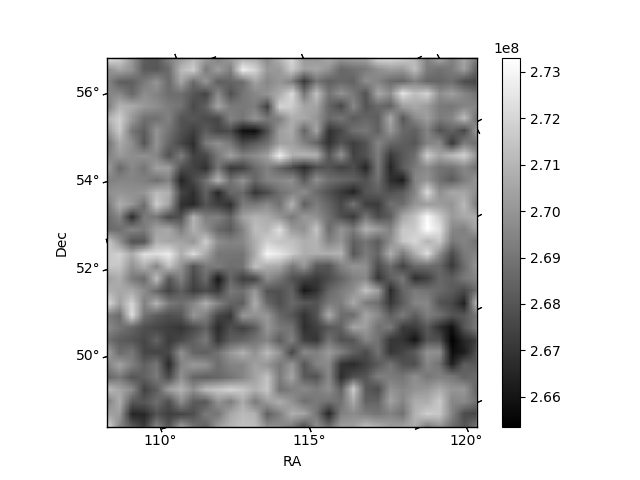
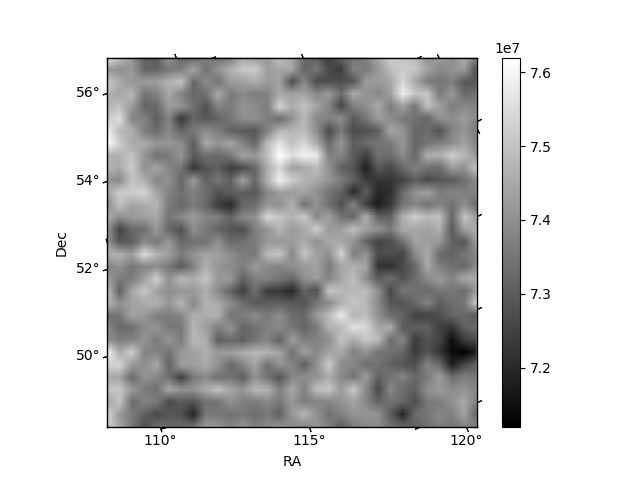
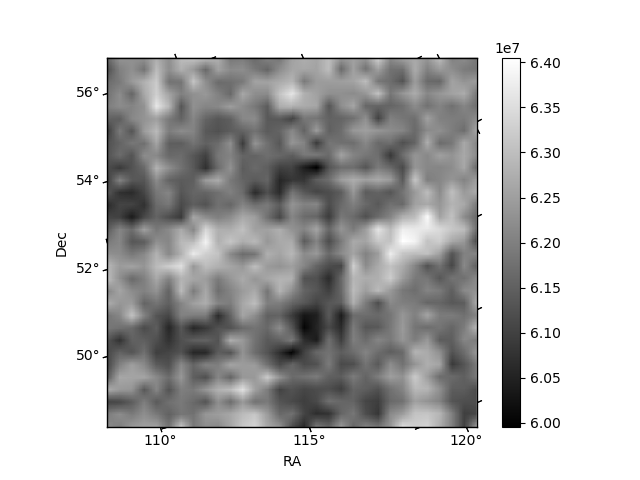
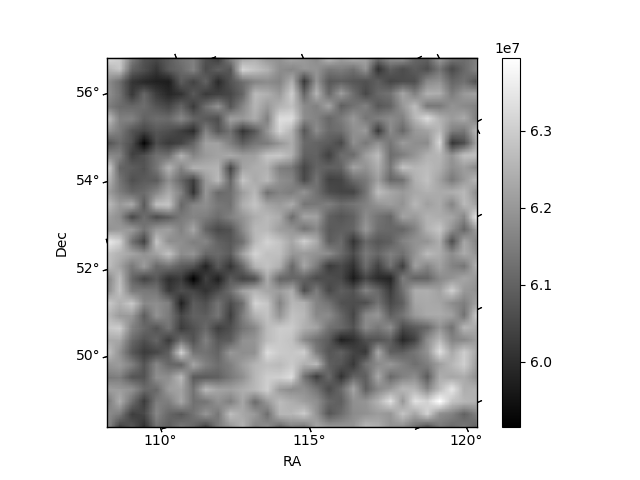
Histogram calculated using DETX and DETY for each event in the final _common_clean file
| Quadrant A | 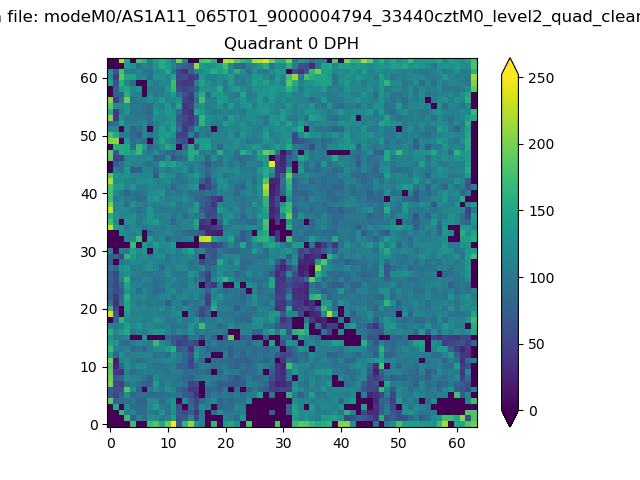 |
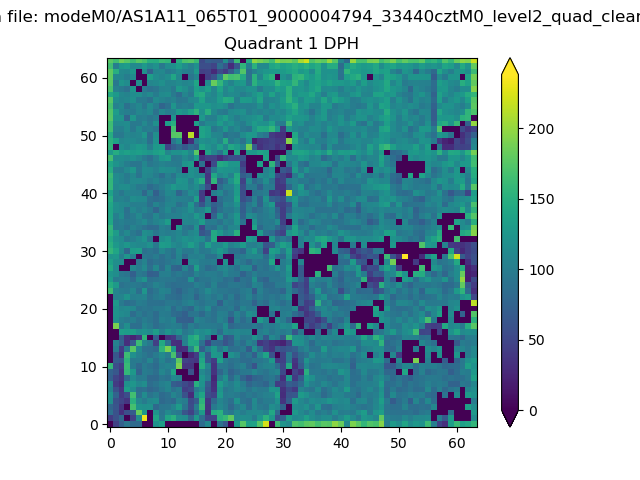 |
Quadrant B |
|---|---|---|---|
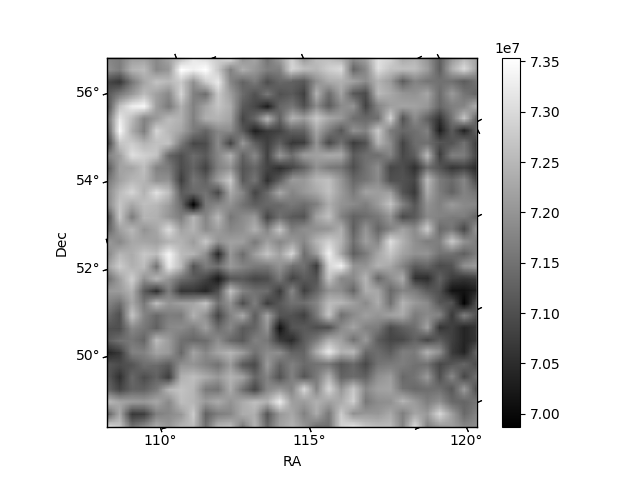
| Quadrant D | 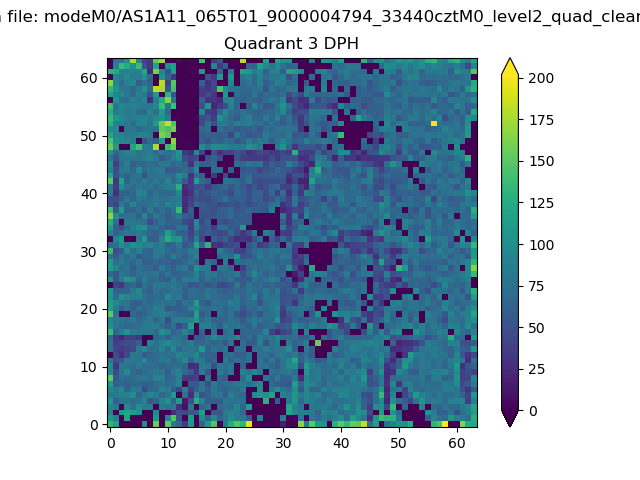 |
 |
Quadrant C |
| Plot type | Count rate plots | Images |
|---|---|---|
| Comparison with Poisson distribution Blue bars denote a histogram of data divided into 1 sec bins. Red curve is a Poisson curve with rate = median count rate of data. |
 |
 |
| Quadrant-wise count rates Data is divided into 100 sec bins |
 |
|
| Module-wise count rates for Quadrant A Data is divided into 100 sec bins |
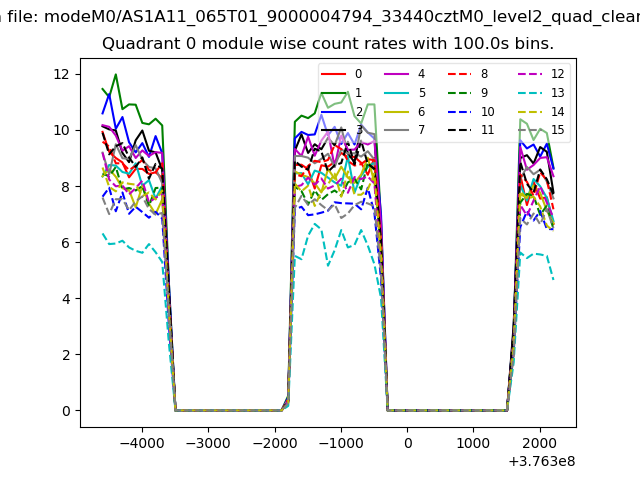 |
 |
| Module-wise count rates for Quadrant B Data is divided into 100 sec bins |
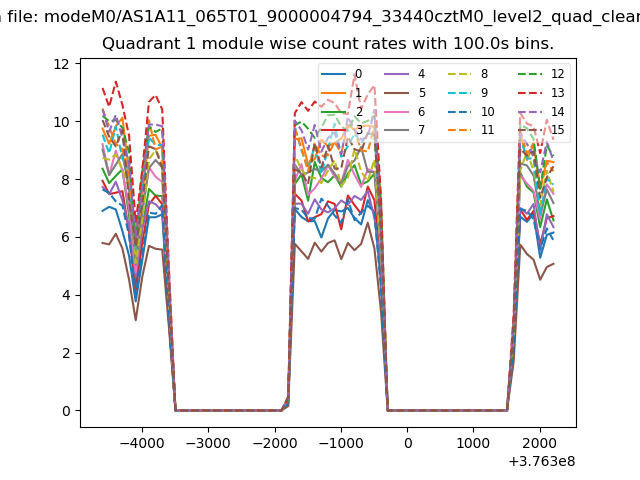 |
 |
| Module-wise count rates for Quadrant C Data is divided into 100 sec bins |
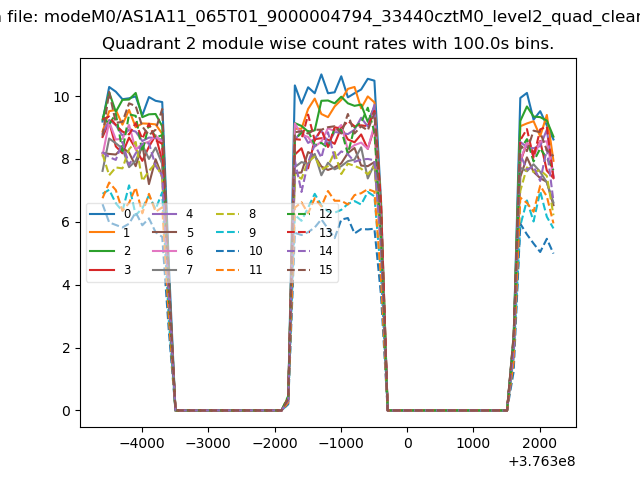 |
 |
| Module-wise count rates for Quadrant D Data is divided into 100 sec bins |
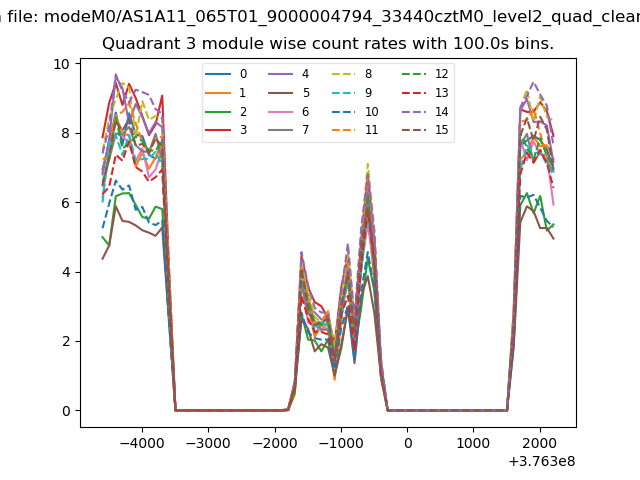 |
 |
| Parameter | Plot |
|---|---|
| CZT HV Monitor | 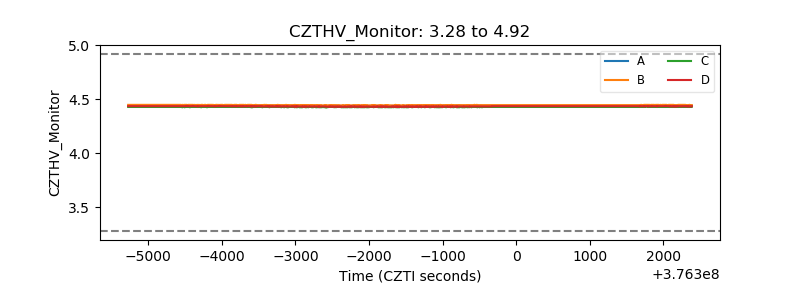 |
| D_VDD | 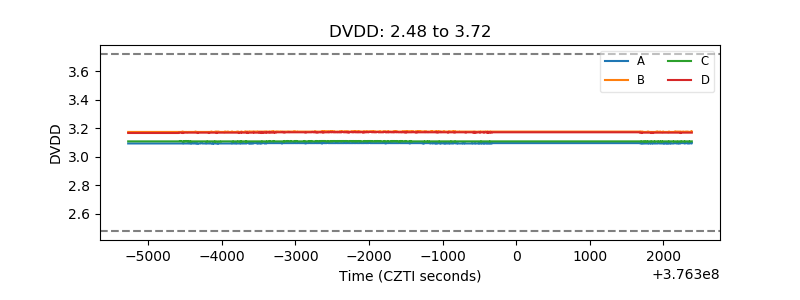 |
| Temperature 1 | 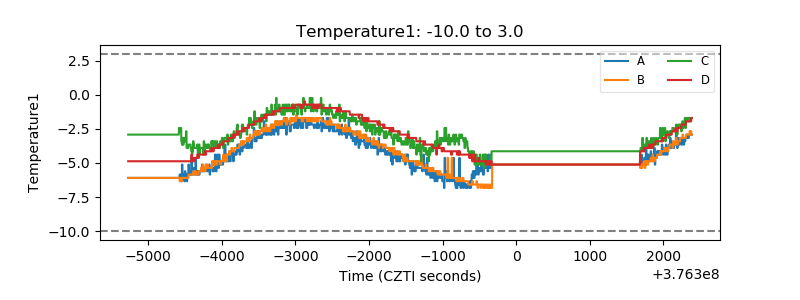 |
| Veto HV Monitor | 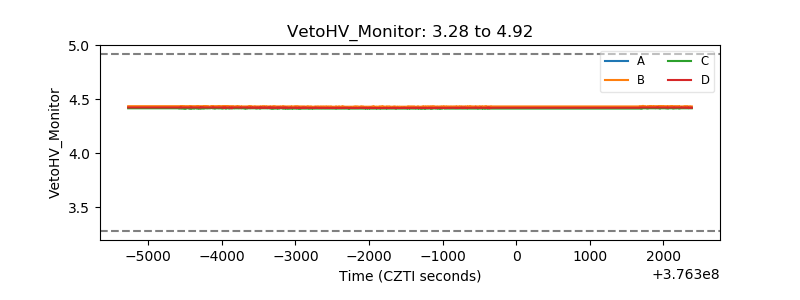 |
| Veto LLD | 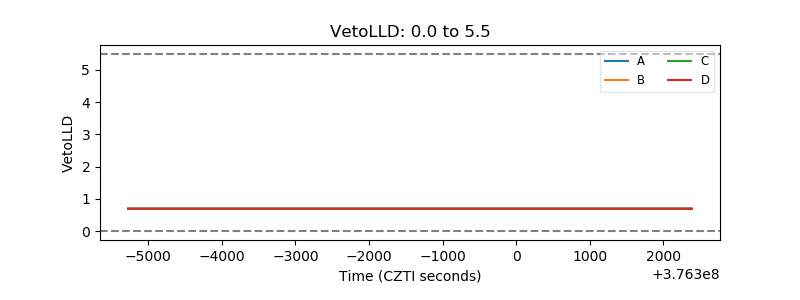 |
| Alpha Counter | 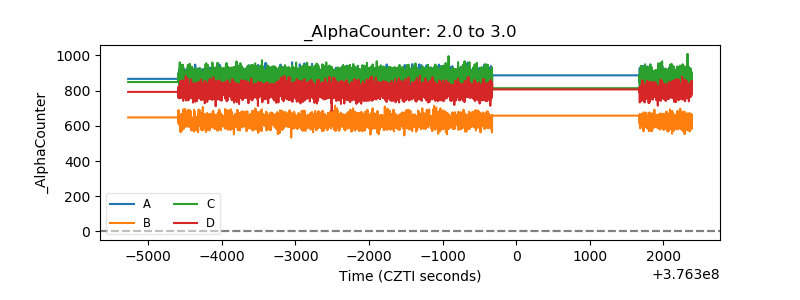 |
| _CPM_Rate |  |
| CZT Counter | 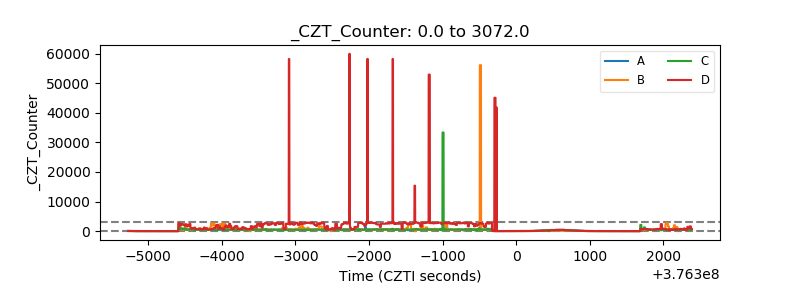 |
| +2.5 Volts monitor |  |
| +5 Volts monitor | 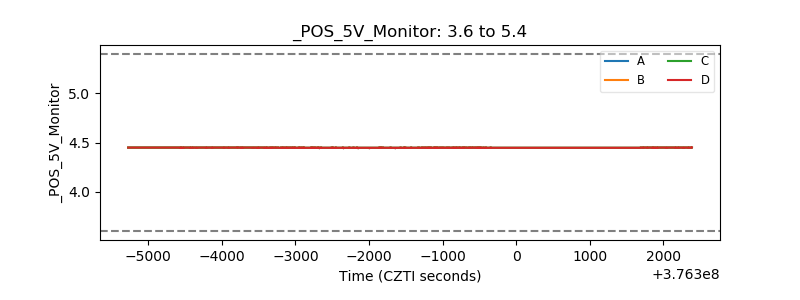 |
| _ROLL_ROT | 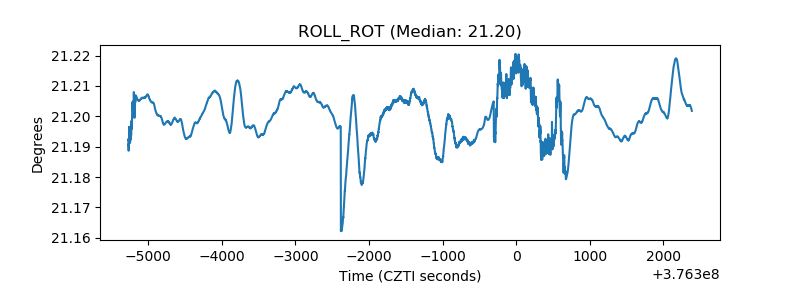 |
| _Roll_DEC | 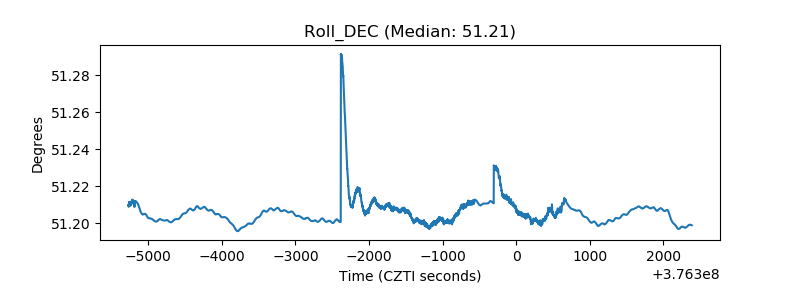 |
| _Roll_RA | 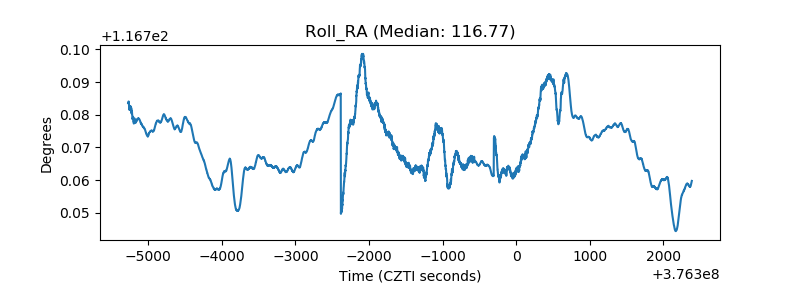 |
| Veto Counter | 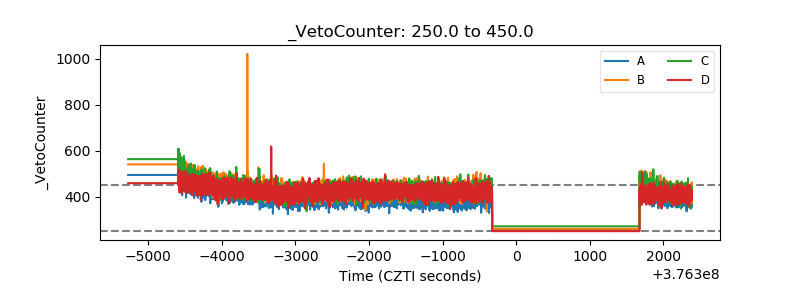 |