| Param | Original file | Final file |
|---|---|---|
| Filename | modeM0/AS1A11_065T01_9000004794_33441cztM0_level2.evt | modeM0/AS1A11_065T01_9000004794_33441cztM0_level2_quad_clean.evt |
| Size (bytes) | 484,827,840 | 61,251,840 |
| Size | 462.4 MB | 58.4 MB |
| Events in quadrant A | 2,549,968 | 379,585 |
| Events in quadrant B | 3,549,356 | 368,823 |
| Events in quadrant C | 2,875,056 | 371,114 |
| Events in quadrant D | 5,333,124 | 347,243 |
| Mode SS | |||
|---|---|---|---|
| Quadrant | BADHDUFLAG | Total packets | Discarded packets |
| A | 0 | 112 | 0 |
| B | 0 | 112 | 0 |
| C | 0 | 112 | 0 |
| D | 0 | 112 | 0 |
| Mode M0 | |||
|---|---|---|---|
| Quadrant | BADHDUFLAG | Total packets | Discarded packets |
| A | 0 | 11167 | 3 |
| B | 0 | 13995 | 2 |
| C | 0 | 11705 | 2 |
| D | 0 | 19590 | 2 |
| Mode M9 | |||
|---|---|---|---|
| Quadrant | BADHDUFLAG | Total packets | Discarded packets |
| A | 0 | 17 | 0 |
| B | 0 | 17 | 0 |
| C | 0 | 17 | 0 |
| D | 0 | 18 | 0 |
| Quadrant | Total seconds | Saturated seconds | Saturation percentage |
|---|---|---|---|
| A | 5542 | 4 | 0.072176% |
| B | 5542 | 274 | 4.944064% |
| C | 5542 | 32 | 0.577409% |
| D | 5542 | 283 | 5.106460% |
Noise dominated data is calculated using 1-second bins in cleaned event files. If a bin has >2000 counts, and if more than 50% of those come from <1% of pixels, then it is considered to be noise-dominated and hence unusable.
| Quadrant | # 1 sec bins | Bins with >0 counts | Bins with >2000 counts | High rate bins dominated by noise | Noise dominated (total time) | Noise dominated (detector-on time) | Marked lightcurve |
|---|---|---|---|---|---|---|---|
| A | 7245 | 5543 | 0 | 0 | 0.00% | 0.00% | 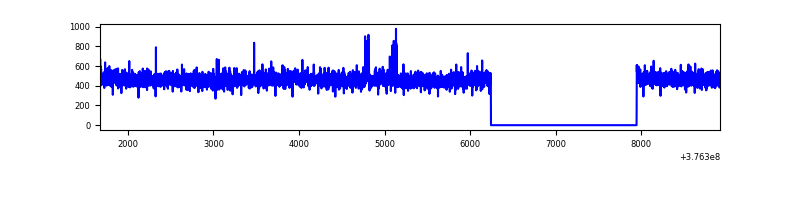 |
| B | 7245 | 5543 | 224 | 224 | 3.09% | 4.04% | 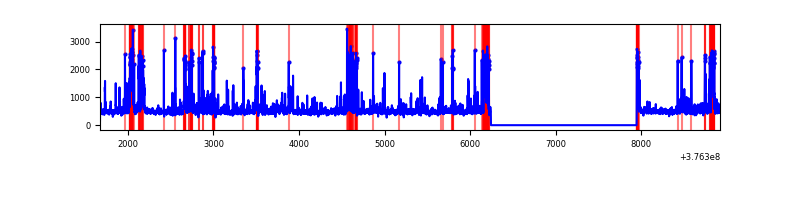 |
| C | 7245 | 5543 | 29 | 29 | 0.40% | 0.52% | 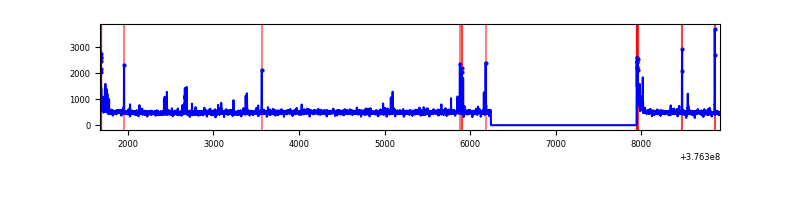 |
| D | 7245 | 5543 | 261 | 261 | 3.60% | 4.71% | 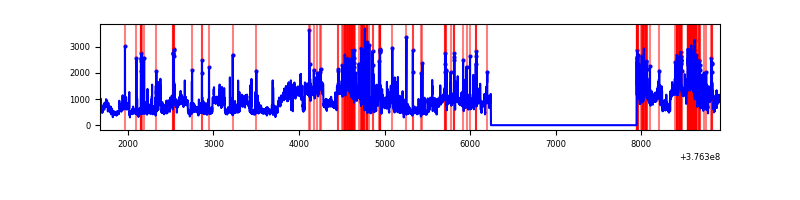 |
Top three noisy pixels from each quadrant. If the there are fewer than three noisy pixels in the level2.evt file, extra rows are filled as -1
| Pixel properties | Quadrant properties | ||||||
|---|---|---|---|---|---|---|---|
| Quadrant | DetID | PixID | Counts | Sigma | Mean | Median | Sigma |
| A | 4 | 48 | 23529 | 176.3 | 648 | 635 | 129.9 |
| A | 13 | 6 | 20117 | 150.02 | 648 | 635 | 129.9 |
| A | 13 | 254 | 9773 | 70.37 | 648 | 635 | 129.9 |
| B | 5 | 172 | 605510 | 4969.73 | 630 | 613 | 121.7 |
| B | 5 | 255 | 269238 | 2206.98 | 630 | 613 | 121.7 |
| B | 0 | 213 | 53317 | 433.01 | 630 | 613 | 121.7 |
| C | 15 | 214 | 242412 | 1691.71 | 620 | 624 | 142.9 |
| C | 0 | 10 | 100688 | 700.11 | 620 | 624 | 142.9 |
| C | 14 | 254 | 56559 | 391.36 | 620 | 624 | 142.9 |
| D | 8 | 195 | 1864307 | 11498.79 | 611 | 595 | 162.1 |
| D | 12 | 218 | 307657 | 1894.52 | 611 | 595 | 162.1 |
| D | 2 | 250 | 185197 | 1138.96 | 611 | 595 | 162.1 |
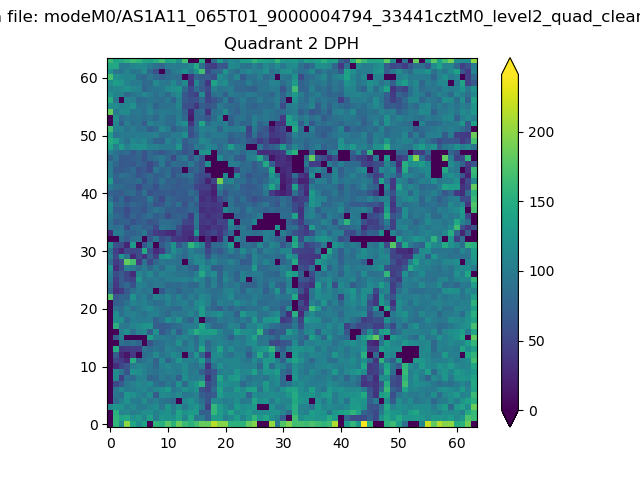
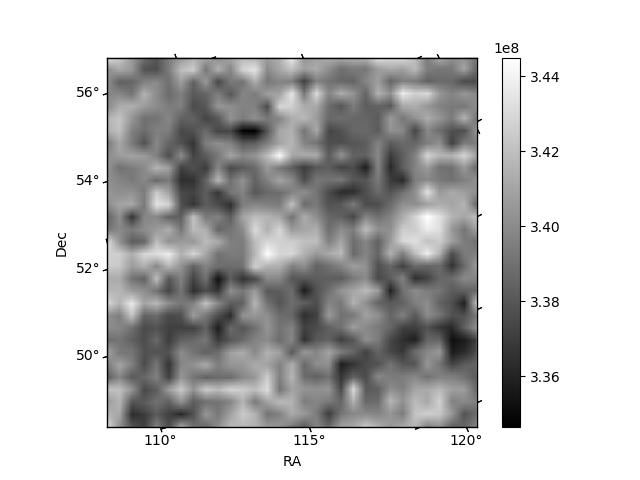
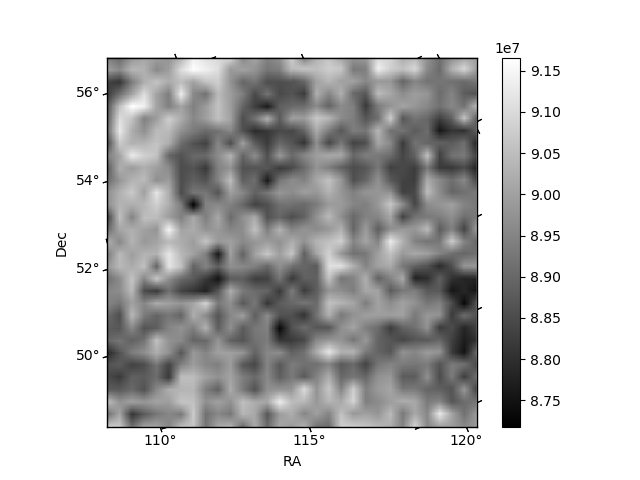
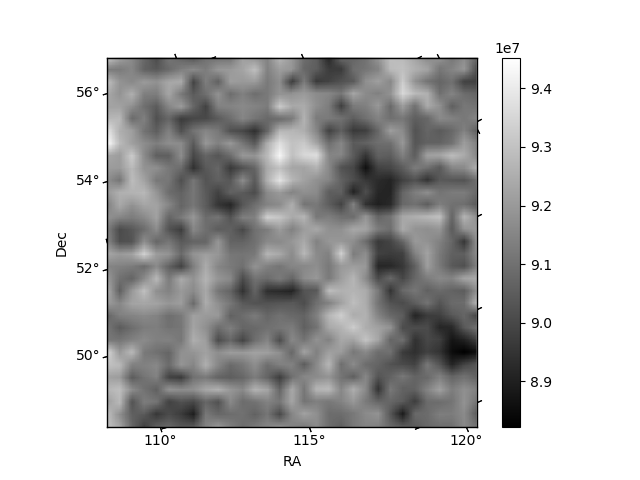
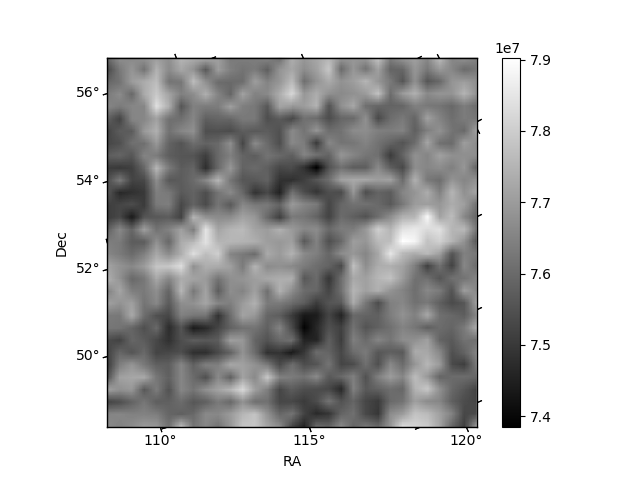
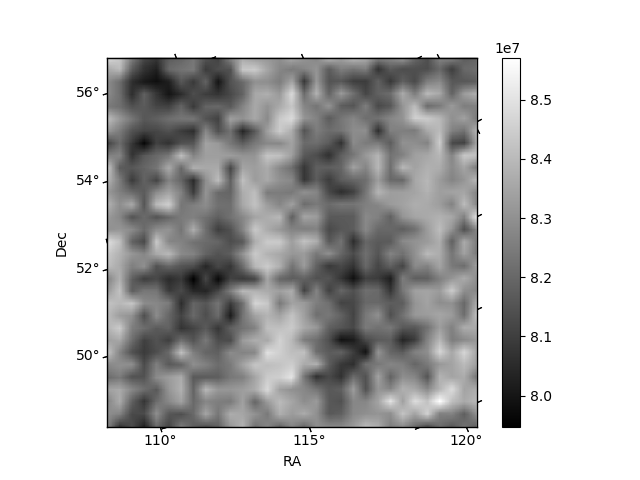
Histogram calculated using DETX and DETY for each event in the final _common_clean file
| Quadrant A | 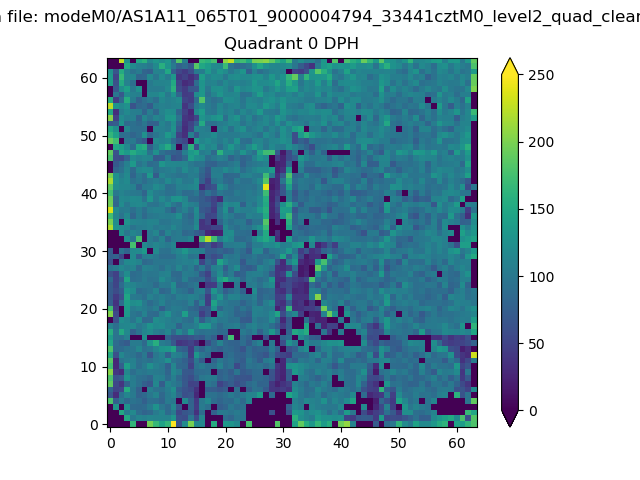 |
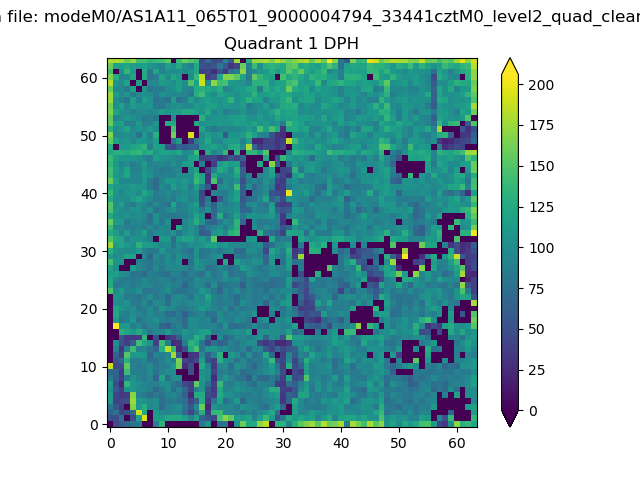 |
Quadrant B |
|---|---|---|---|
| Quadrant D | 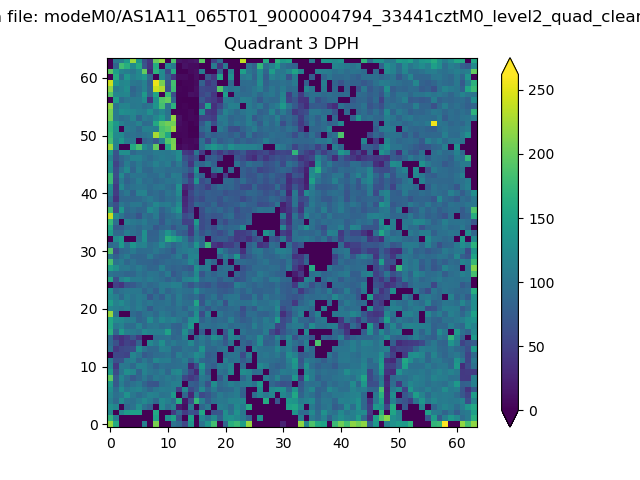 |
 |
Quadrant C |
| Plot type | Count rate plots | Images |
|---|---|---|
| Comparison with Poisson distribution Blue bars denote a histogram of data divided into 1 sec bins. Red curve is a Poisson curve with rate = median count rate of data. |
 |
 |
| Quadrant-wise count rates Data is divided into 100 sec bins |
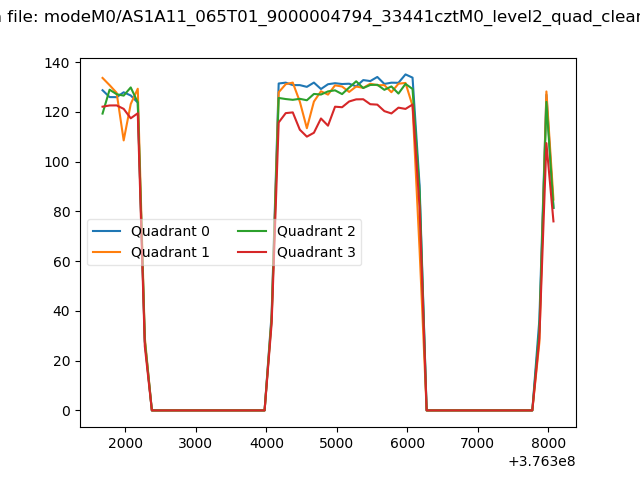 |
|
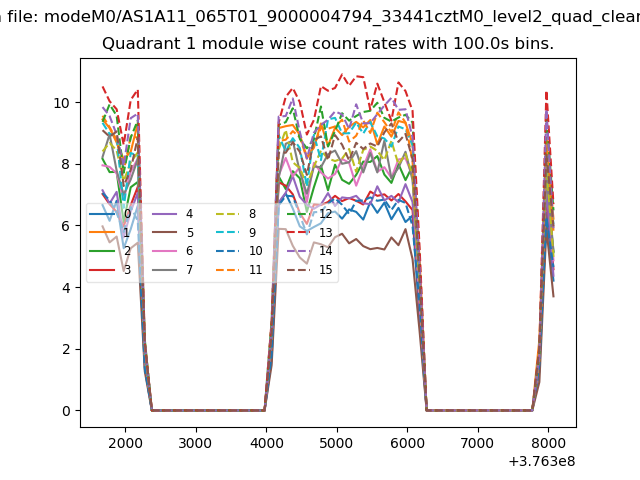
| Module-wise count rates for Quadrant A Data is divided into 100 sec bins |
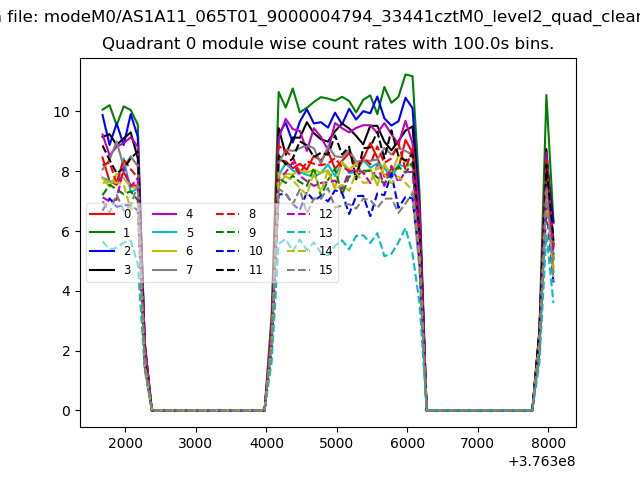 |
 |
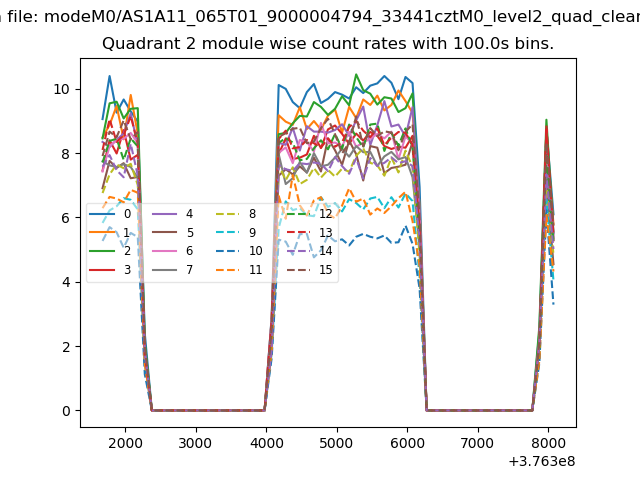
| Module-wise count rates for Quadrant B Data is divided into 100 sec bins |
 |
 |
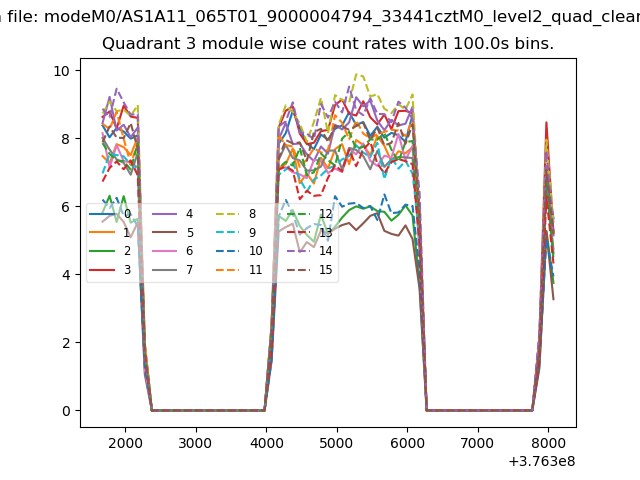
| Module-wise count rates for Quadrant C Data is divided into 100 sec bins |
 |
 |
| Module-wise count rates for Quadrant D Data is divided into 100 sec bins |
 |
 |
| Parameter | Plot |
|---|---|
| CZT HV Monitor | 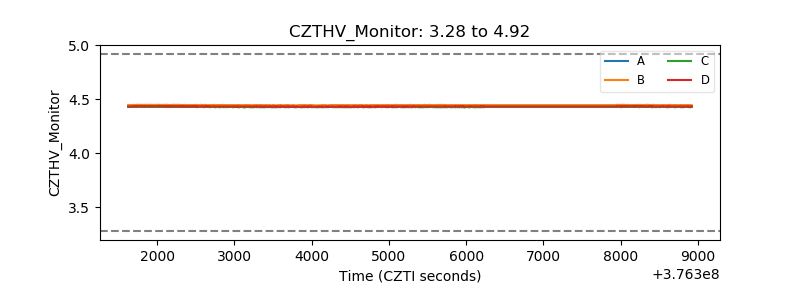 |
| D_VDD | 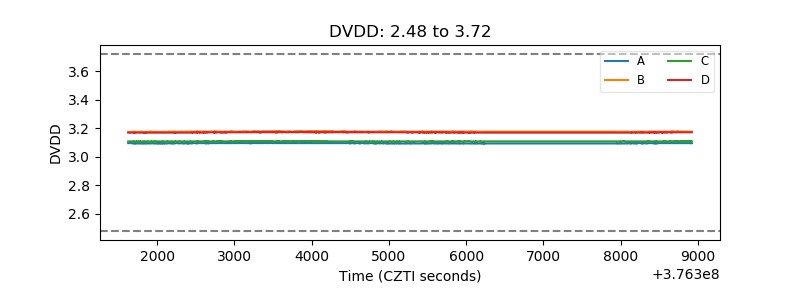 |
| Temperature 1 | 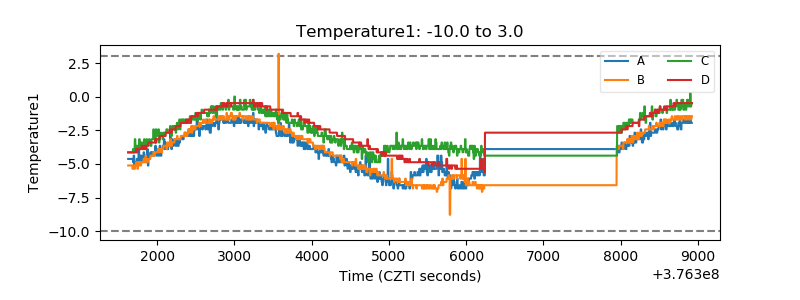 |
| Veto HV Monitor | 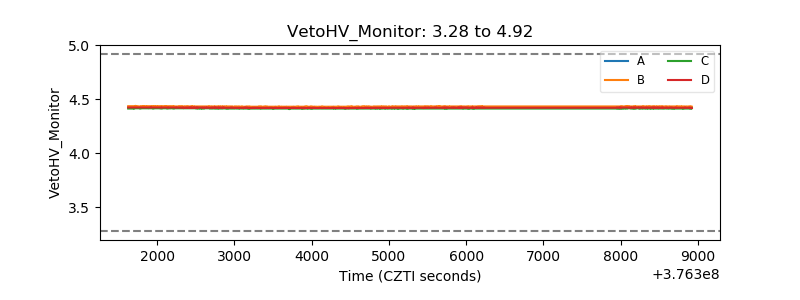 |
| Veto LLD | 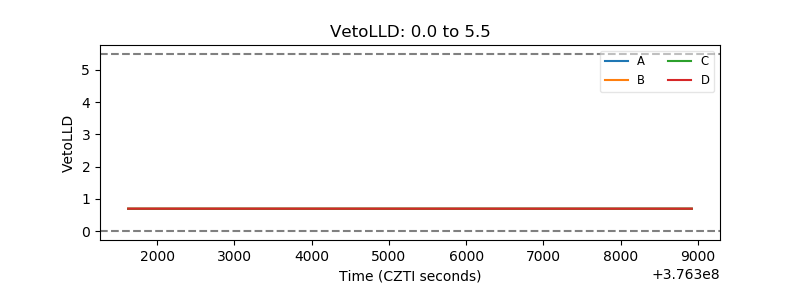 |
| Alpha Counter | 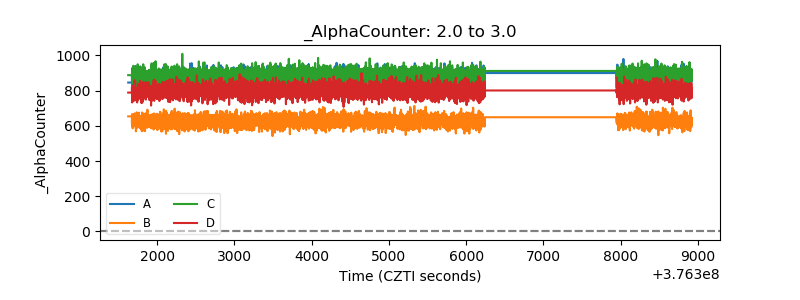 |
| _CPM_Rate | 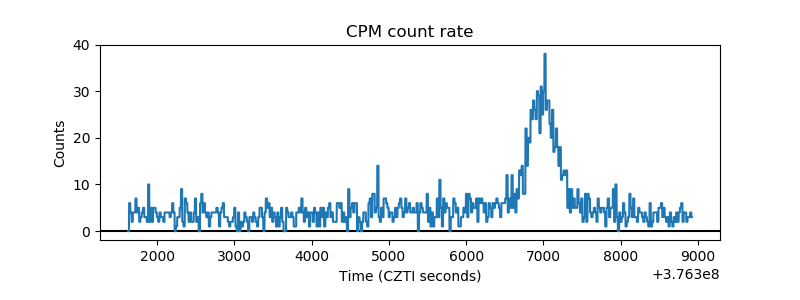 |
| CZT Counter | 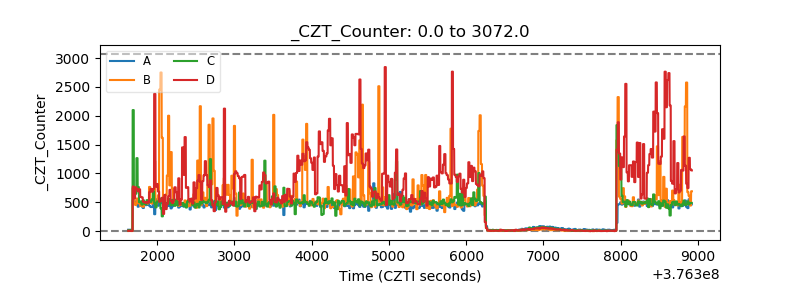 |
| +2.5 Volts monitor |  |
| +5 Volts monitor |  |
| _ROLL_ROT | 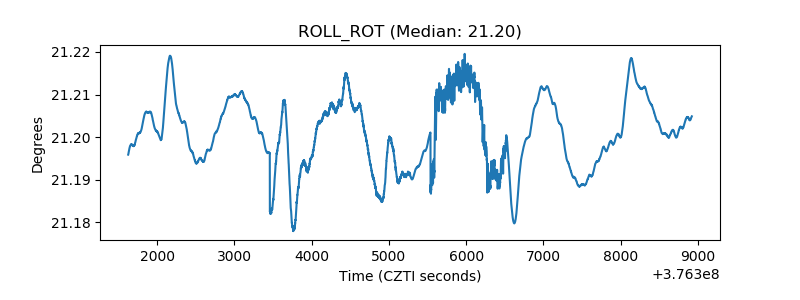 |
| _Roll_DEC |  |
| _Roll_RA | 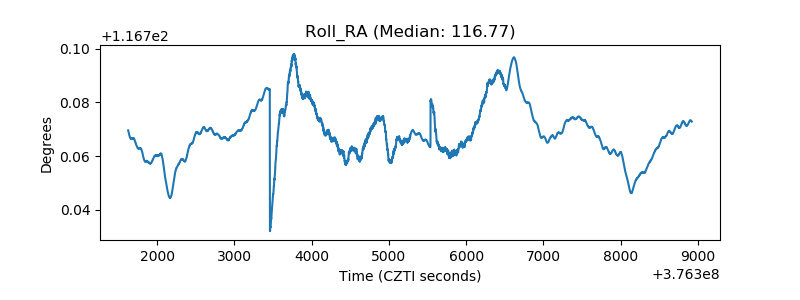 |
| Veto Counter | 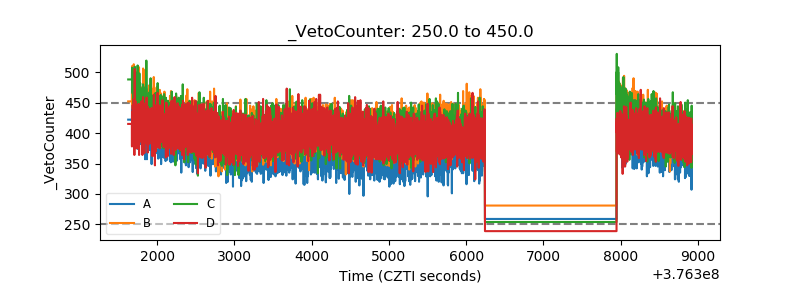 |