| Param | Original file | Final file |
|---|---|---|
| Filename | modeM0/AS1A11_065T01_9000004794_33442cztM0_level2.evt | modeM0/AS1A11_065T01_9000004794_33442cztM0_level2_quad_clean.evt |
| Size (bytes) | 587,085,120 | 62,311,680 |
| Size | 559.9 MB | 59.4 MB |
| Events in quadrant A | 2,645,610 | 387,820 |
| Events in quadrant B | 3,424,218 | 380,432 |
| Events in quadrant C | 3,281,804 | 372,497 |
| Events in quadrant D | 8,033,534 | 338,268 |
| Mode SS | |||
|---|---|---|---|
| Quadrant | BADHDUFLAG | Total packets | Discarded packets |
| A | 0 | 118 | 0 |
| B | 0 | 118 | 0 |
| C | 0 | 118 | 0 |
| D | 0 | 118 | 0 |
| Mode M0 | |||
|---|---|---|---|
| Quadrant | BADHDUFLAG | Total packets | Discarded packets |
| A | 0 | 11693 | 3 |
| B | 0 | 13868 | 2 |
| C | 0 | 13122 | 2 |
| D | 0 | 27959 | 2 |
| Mode M9 | |||
|---|---|---|---|
| Quadrant | BADHDUFLAG | Total packets | Discarded packets |
| A | 0 | 15 | 0 |
| B | 0 | 15 | 0 |
| C | 0 | 15 | 0 |
| D | 0 | 16 | 0 |
| Quadrant | Total seconds | Saturated seconds | Saturation percentage |
|---|---|---|---|
| A | 5831 | 10 | 0.171497% |
| B | 5831 | 156 | 2.675356% |
| C | 5831 | 92 | 1.577774% |
| D | 5831 | 1421 | 24.369748% |
Noise dominated data is calculated using 1-second bins in cleaned event files. If a bin has >2000 counts, and if more than 50% of those come from <1% of pixels, then it is considered to be noise-dominated and hence unusable.
| Quadrant | # 1 sec bins | Bins with >0 counts | Bins with >2000 counts | High rate bins dominated by noise | Noise dominated (total time) | Noise dominated (detector-on time) | Marked lightcurve |
|---|---|---|---|---|---|---|---|
| A | 7234 | 5832 | 0 | 0 | 0.00% | 0.00% | 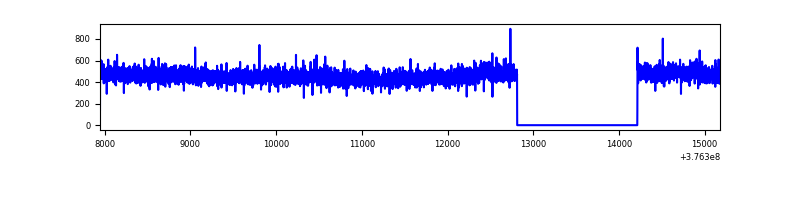 |
| B | 7234 | 5832 | 110 | 110 | 1.52% | 1.89% | 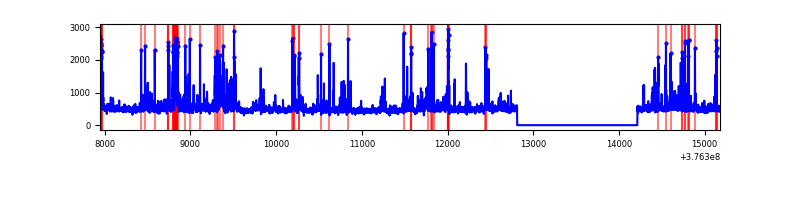 |
| C | 7234 | 5832 | 89 | 89 | 1.23% | 1.53% | 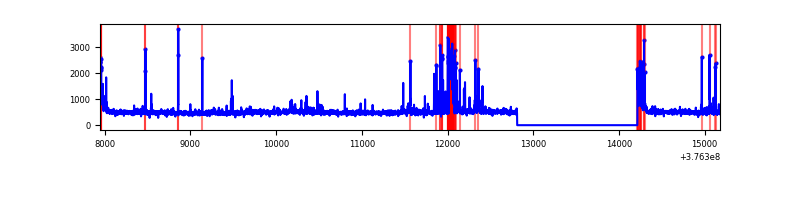 |
| D | 7233 | 5831 | 1339 | 1339 | 18.51% | 22.96% | 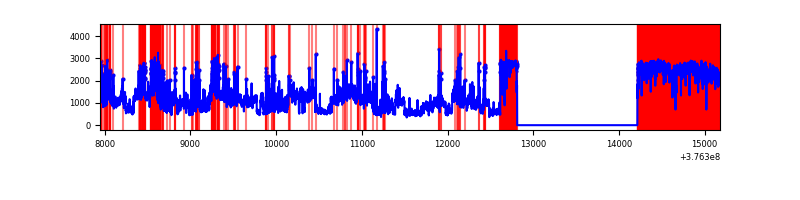 |
Top three noisy pixels from each quadrant. If the there are fewer than three noisy pixels in the level2.evt file, extra rows are filled as -1
| Pixel properties | Quadrant properties | ||||||
|---|---|---|---|---|---|---|---|
| Quadrant | DetID | PixID | Counts | Sigma | Mean | Median | Sigma |
| A | 13 | 6 | 16457 | 116.17 | 679 | 665 | 135.9 |
| A | 13 | 254 | 11091 | 76.7 | 679 | 665 | 135.9 |
| A | 3 | 137 | 6777 | 44.96 | 679 | 665 | 135.9 |
| B | 5 | 172 | 489394 | 3810.89 | 667 | 650 | 128.2 |
| B | 5 | 200 | 81419 | 629.78 | 667 | 650 | 128.2 |
| B | 5 | 255 | 69727 | 538.61 | 667 | 650 | 128.2 |
| C | 15 | 214 | 251640 | 1682.65 | 649 | 654 | 149.2 |
| C | 14 | 254 | 202316 | 1351.97 | 649 | 654 | 149.2 |
| C | 0 | 10 | 117656 | 784.4 | 649 | 654 | 149.2 |
| D | 1 | 52 | 2623818 | 18508.27 | 529 | 516 | 141.7 |
| D | 8 | 195 | 2194457 | 15478.98 | 529 | 516 | 141.7 |
| D | 12 | 218 | 472013 | 3326.57 | 529 | 516 | 141.7 |
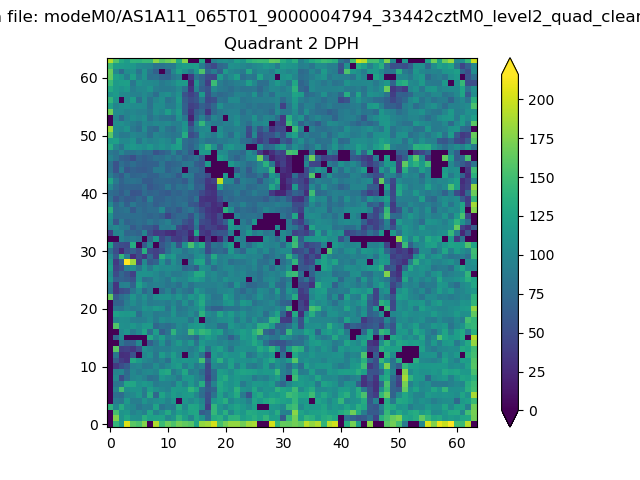
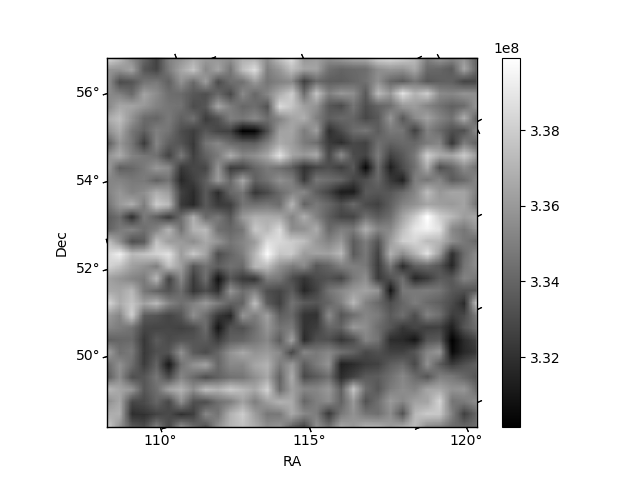
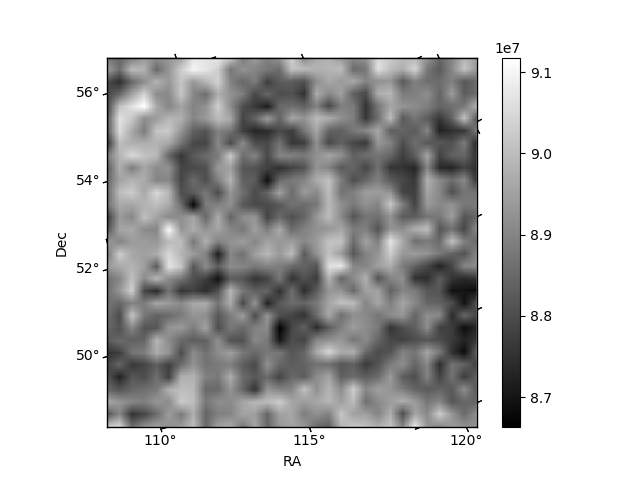
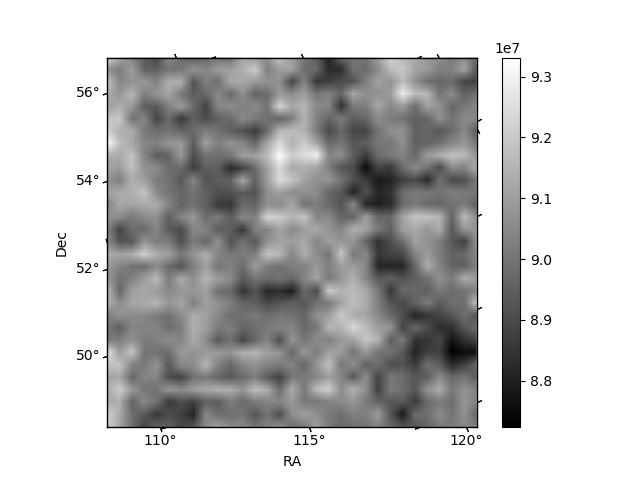
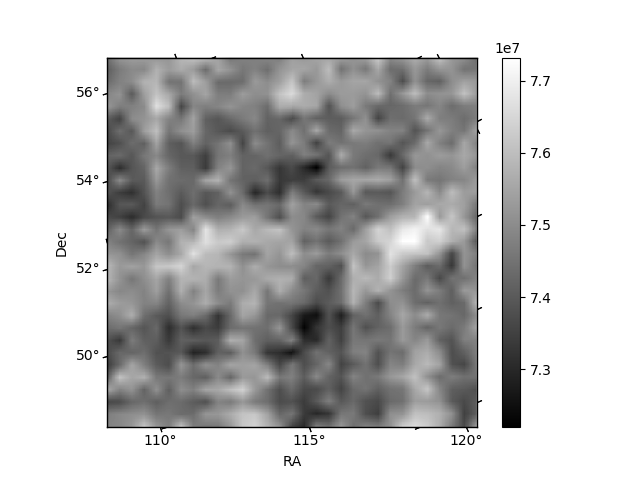
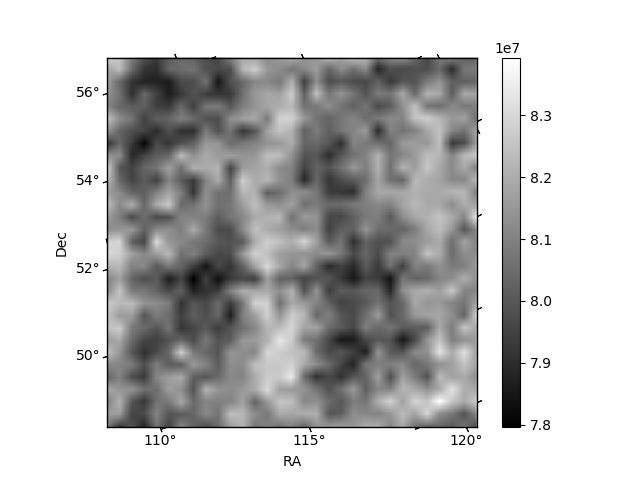
Histogram calculated using DETX and DETY for each event in the final _common_clean file
| Quadrant A | 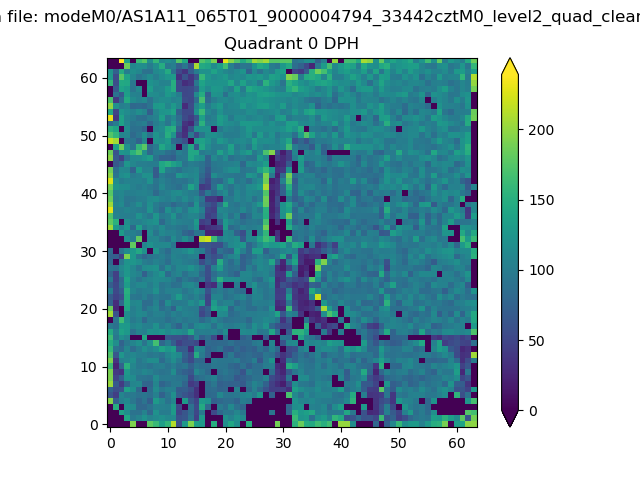 |
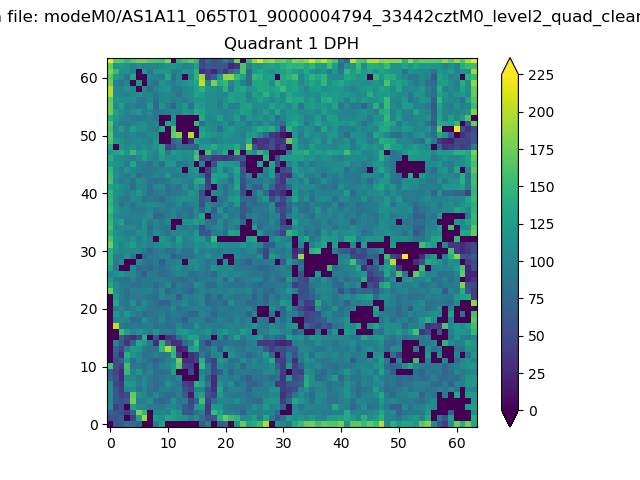 |
Quadrant B |
|---|---|---|---|
| Quadrant D | 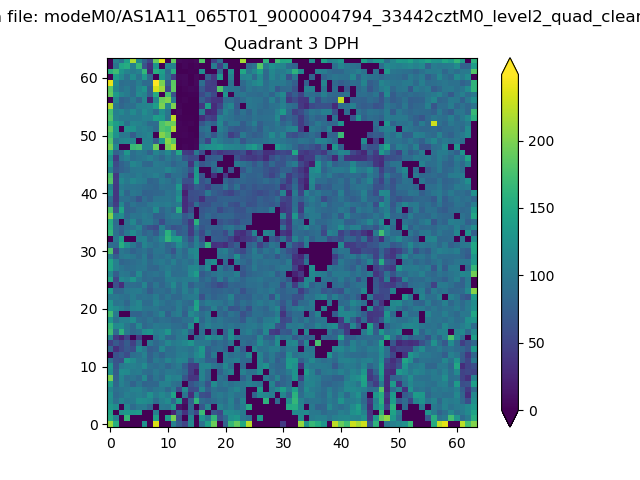 |
 |
Quadrant C |
| Plot type | Count rate plots | Images |
|---|---|---|
| Comparison with Poisson distribution Blue bars denote a histogram of data divided into 1 sec bins. Red curve is a Poisson curve with rate = median count rate of data. |
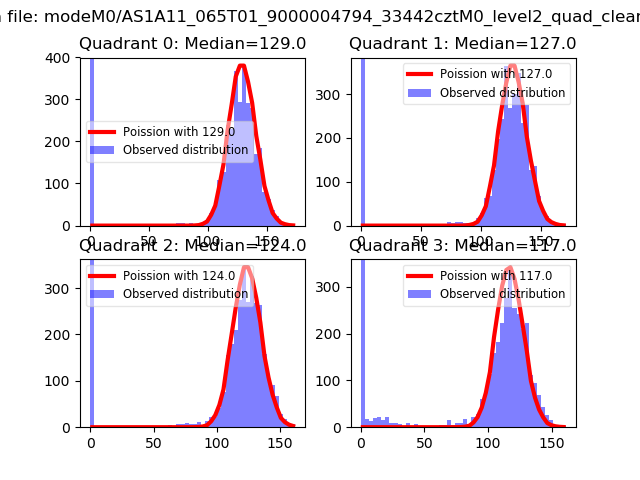 |
 |
| Quadrant-wise count rates Data is divided into 100 sec bins |
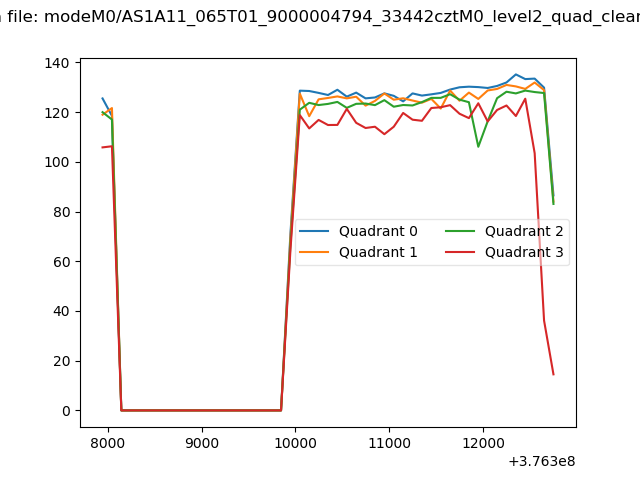 |
|
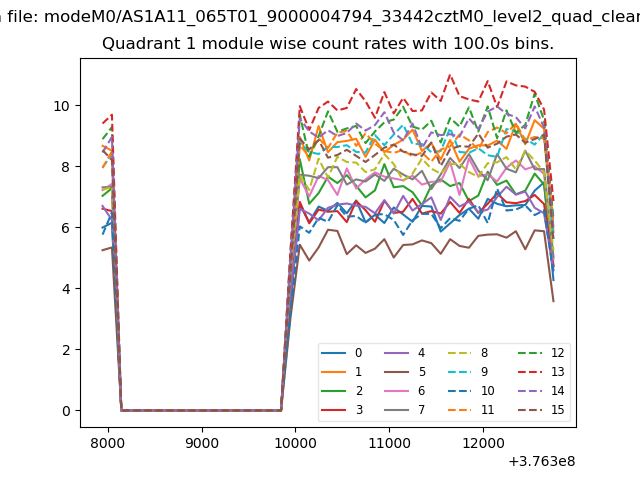
| Module-wise count rates for Quadrant A Data is divided into 100 sec bins |
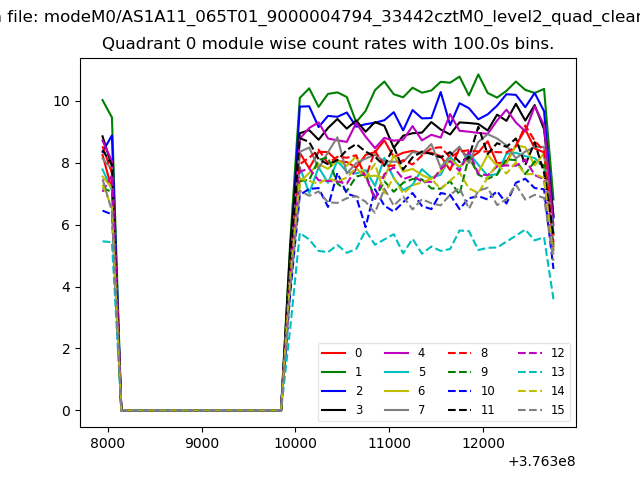 |
 |
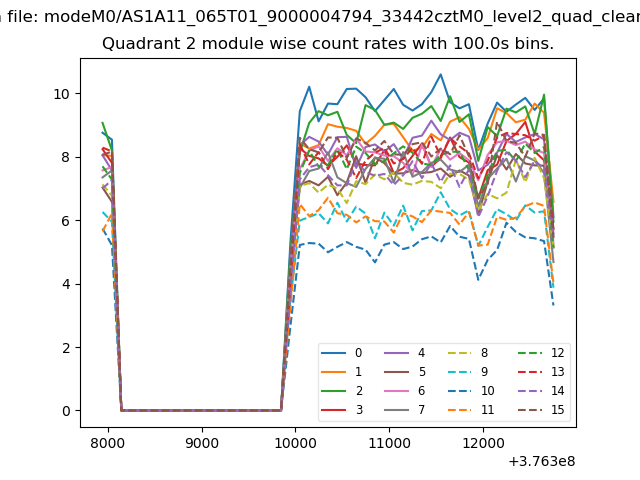
| Module-wise count rates for Quadrant B Data is divided into 100 sec bins |
 |
 |
| Module-wise count rates for Quadrant C Data is divided into 100 sec bins |
 |
 |
| Module-wise count rates for Quadrant D Data is divided into 100 sec bins |
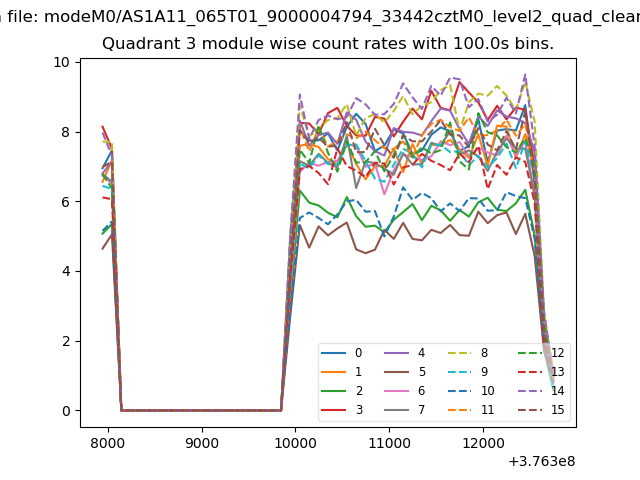 |
 |
| Parameter | Plot |
|---|---|
| CZT HV Monitor | 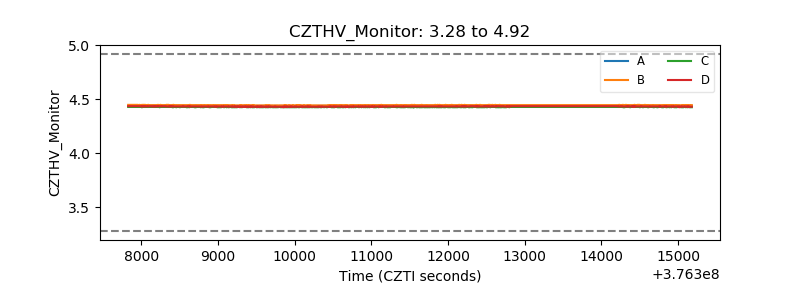 |
| D_VDD | 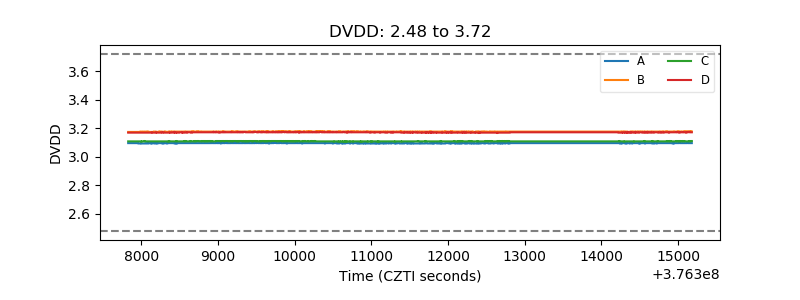 |
| Temperature 1 | 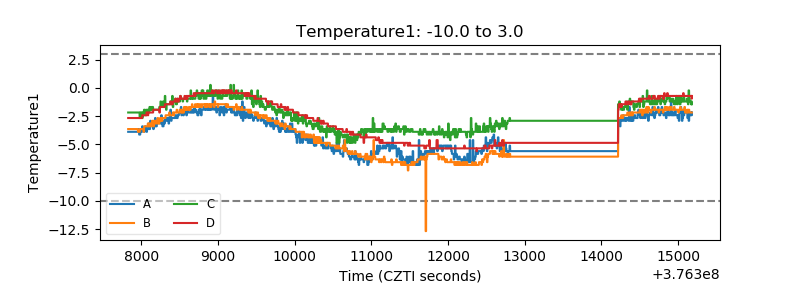 |
| Veto HV Monitor | 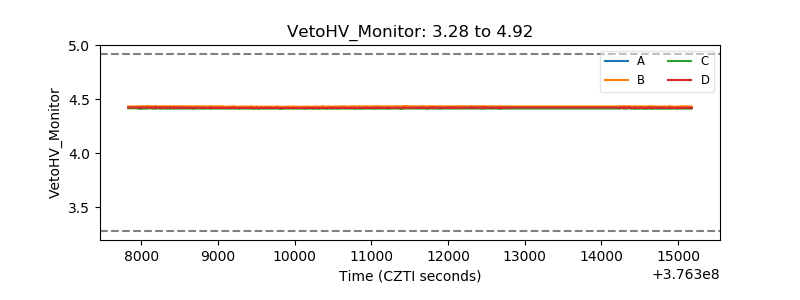 |
| Veto LLD | 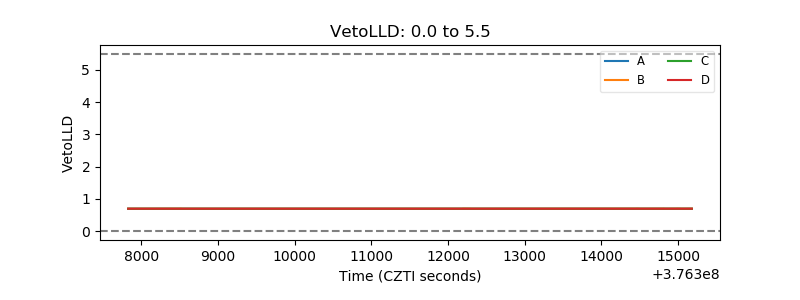 |
| Alpha Counter | 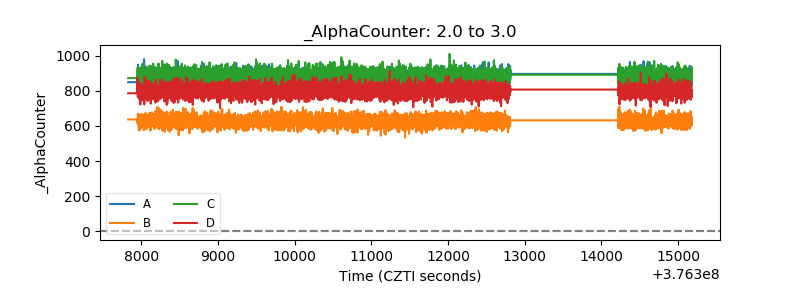 |
| _CPM_Rate | 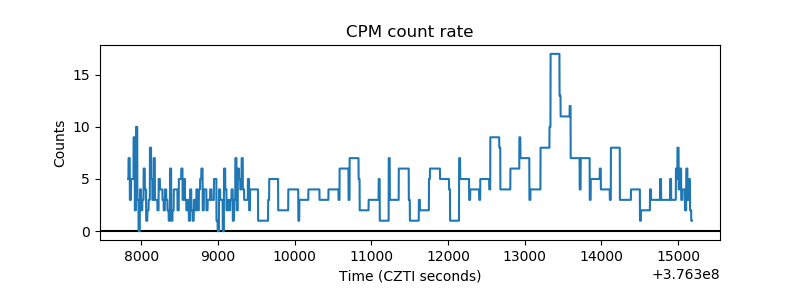 |
| CZT Counter | 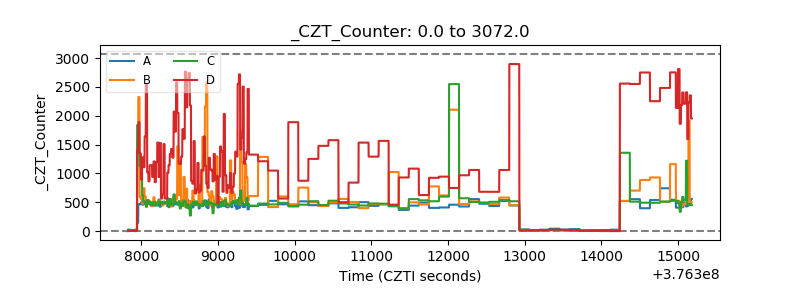 |
| +2.5 Volts monitor | 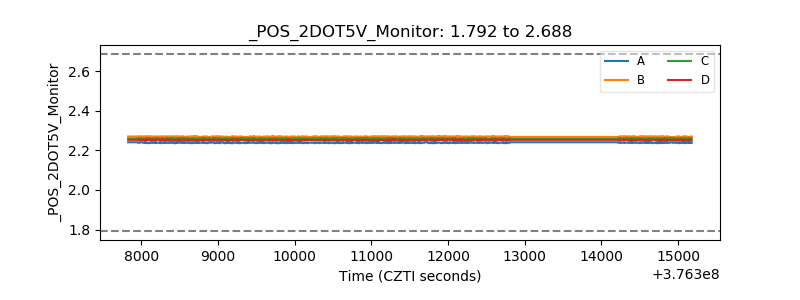 |
| +5 Volts monitor |  |
| _ROLL_ROT | 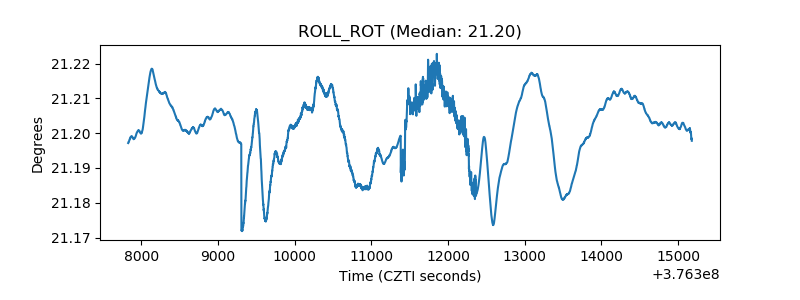 |
| _Roll_DEC | 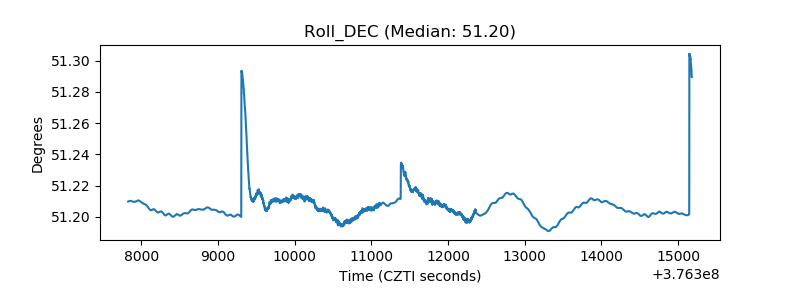 |
| _Roll_RA | 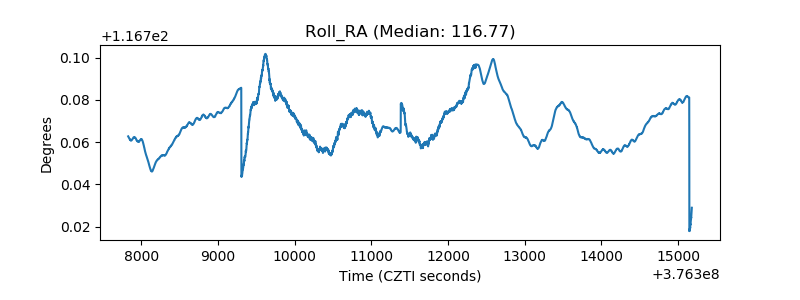 |
| Veto Counter | 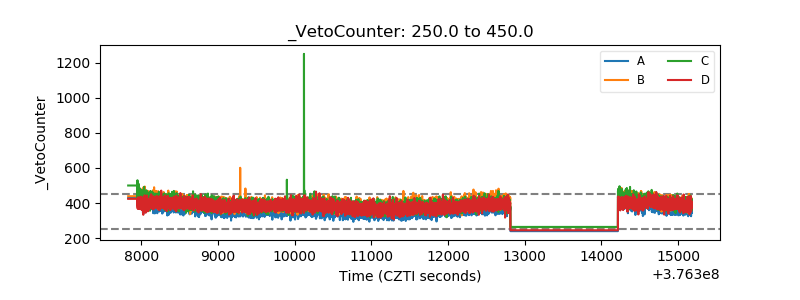 |