| Param | Original file | Final file |
|---|---|---|
| Filename | modeM0/AS1A11_065T02_9000004796cztM0_level2.fits | modeM0/AS1A11_065T02_9000004796cztM0_level2_quad_clean.evt |
| Size (bytes) | 157,271,040 | 203,440,320 |
| Size | 150.0 MB | 194.0 MB |
| Events in quadrant A | 974,288 | 1,335,511 |
| Events in quadrant B | 906,832 | 1,276,014 |
| Events in quadrant C | 938,852 | 1,248,262 |
| Events in quadrant D | 735,174 | 1,094,532 |
| Mode SS | |||
|---|---|---|---|
| Quadrant | BADHDUFLAG | Total packets | Discarded packets |
| A | 0 | 358 | 0 |
| B | 0 | 358 | 0 |
| C | 0 | 358 | 0 |
| D | 0 | 358 | 0 |
| Mode M9 | |||
|---|---|---|---|
| Quadrant | BADHDUFLAG | Total packets | Discarded packets |
| A | 0 | 55 | 0 |
| B | 0 | 55 | 0 |
| C | 0 | 55 | 0 |
| D | 0 | 55 | 0 |
| Mode M0 | |||
|---|---|---|---|
| Quadrant | BADHDUFLAG | Total packets | Discarded packets |
| A | 0 | 36509 | 0 |
| B | 0 | 41290 | 0 |
| C | 0 | 37817 | 0 |
| D | 0 | 68126 | 0 |
| Quadrant | Total seconds | Saturated seconds | Saturation percentage |
|---|---|---|---|
| A | 17509 | 26 | 0.148495% |
| B | 17509 | 491 | 2.804272% |
| C | 17509 | 143 | 0.816723% |
| D | 17509 | 2246 | 12.827689% |
Noise dominated data is calculated using 1-second bins in cleaned event files. If a bin has >2000 counts, and if more than 50% of those come from <1% of pixels, then it is considered to be noise-dominated and hence unusable.
| Quadrant | # 1 sec bins | Bins with >0 counts | Bins with >2000 counts | High rate bins dominated by noise | Noise dominated (total time) | Noise dominated (detector-on time) | Marked lightcurve |
|---|---|---|---|---|---|---|---|
| A | 23002 | 17510 | 0 | 0 | 0.00% | 0.00% |  |
| B | 23002 | 17504 | 0 | 0 | 0.00% | 0.00% |  |
| C | 23002 | 17505 | 0 | 0 | 0.00% | 0.00% |  |
| D | 23002 | 17029 | 0 | 0 | 0.00% | 0.00% |  |
Top three noisy pixels from each quadrant. If the there are fewer than three noisy pixels in the level2.evt file, extra rows are filled as -1
| Pixel properties | Quadrant properties | ||||||
|---|---|---|---|---|---|---|---|
| Quadrant | DetID | PixID | Counts | Sigma | Mean | Median | Sigma |
| A | 0 | 29 | 820 | 8.85 | 254 | 238 | 65.7 |
| A | 7 | 110 | 800 | 8.55 | 254 | 238 | 65.7 |
| A | 9 | 19 | 799 | 8.53 | 254 | 238 | 65.7 |
| B | 2 | 9 | 819 | 11.94 | 240 | 230 | 49.3 |
| B | 2 | 8 | 649 | 8.49 | 240 | 230 | 49.3 |
| B | 3 | 80 | 646 | 8.43 | 240 | 230 | 49.3 |
| C | 3 | 202 | 739 | 7.74 | 248 | 232 | 65.5 |
| C | 3 | 203 | 691 | 7.0 | 248 | 232 | 65.5 |
| C | 3 | 187 | 672 | 6.71 | 248 | 232 | 65.5 |
| D | 4 | 160 | 587 | 6.89 | 209 | 191 | 57.5 |
| D | 7 | 3 | 575 | 6.68 | 209 | 191 | 57.5 |
| D | 15 | 47 | 565 | 6.51 | 209 | 191 | 57.5 |
Histogram calculated using DETX and DETY for each event in the final _common_clean file
| Quadrant A | 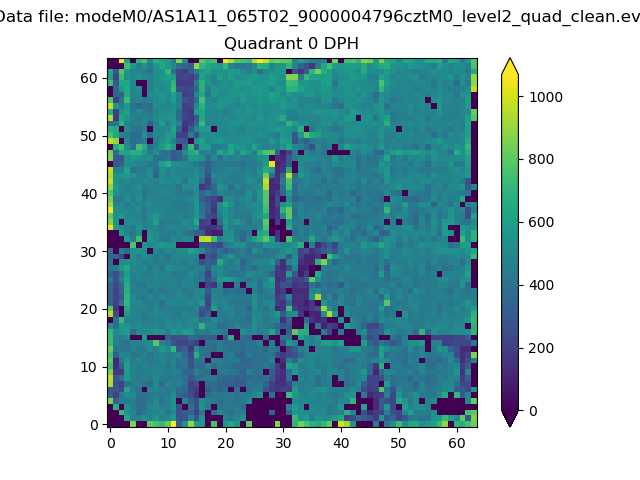 |
 |
Quadrant B |
|---|---|---|---|
| Quadrant D |  |
 |
Quadrant C |
| Plot type | Count rate plots | Images |
|---|---|---|
| Comparison with Poisson distribution Blue bars denote a histogram of data divided into 1 sec bins. Red curve is a Poisson curve with rate = median count rate of data. |
 |
 |
| Quadrant-wise count rates Data is divided into 100 sec bins |
 |
|
| Module-wise count rates for Quadrant A Data is divided into 100 sec bins |
 |
 |
| Module-wise count rates for Quadrant B Data is divided into 100 sec bins |
 |
 |
| Module-wise count rates for Quadrant C Data is divided into 100 sec bins |
 |
 |
| Module-wise count rates for Quadrant D Data is divided into 100 sec bins |
 |
 |
| Parameter | Plot |
|---|---|
| CZT HV Monitor | 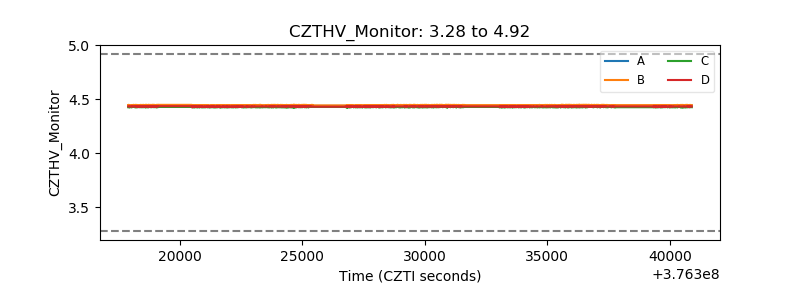 |
| D_VDD | 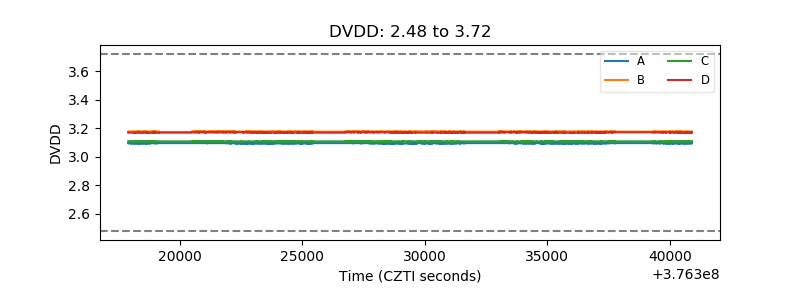 |
| Temperature 1 |  |
| Veto HV Monitor |  |
| Veto LLD | 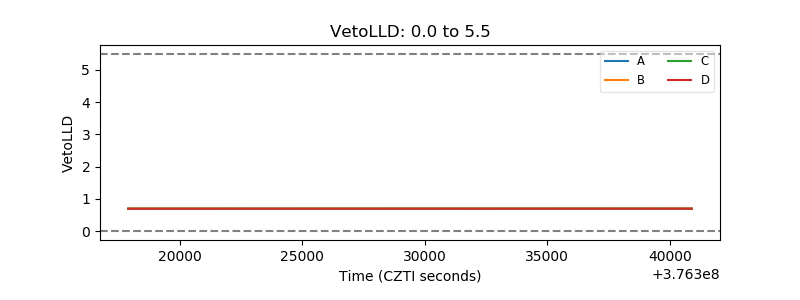 |
| Alpha Counter | 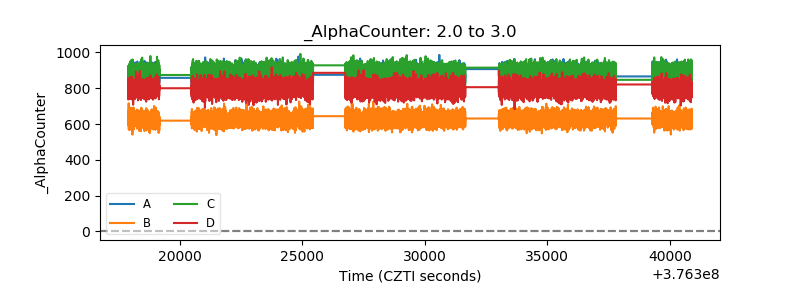 |
| _CPM_Rate |  |
| CZT Counter |  |
| +2.5 Volts monitor |  |
| +5 Volts monitor | 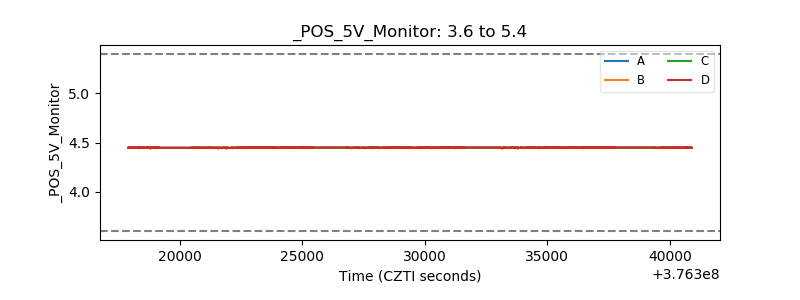 |
| _ROLL_ROT | 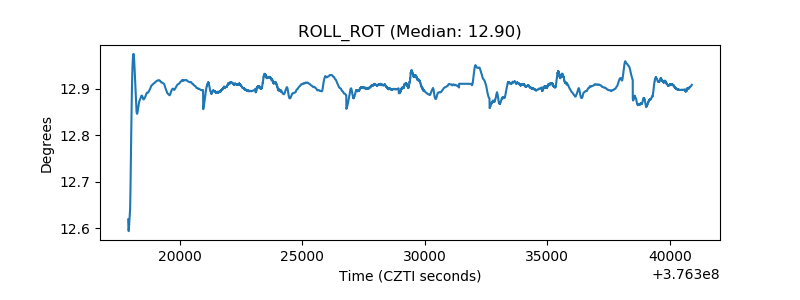 |
| _Roll_DEC |  |
| _Roll_RA |  |
| Veto Counter |  |