| Param | Original file | Final file |
|---|---|---|
| Filename | modeM0/AS1A11_065T02_9000004796_33447cztM0_level2.evt | modeM0/AS1A11_065T02_9000004796_33447cztM0_level2_quad_clean.evt |
| Size (bytes) | 143,326,080 | 29,067,840 |
| Size | 136.7 MB | 27.7 MB |
| Events in quadrant A | 717,281 | 197,233 |
| Events in quadrant B | 975,482 | 192,359 |
| Events in quadrant C | 1,033,609 | 191,968 |
| Events in quadrant D | 1,503,077 | 180,117 |
| Mode SS | |||
|---|---|---|---|
| Quadrant | BADHDUFLAG | Total packets | Discarded packets |
| A | 0 | 32 | 0 |
| B | 0 | 32 | 0 |
| C | 0 | 32 | 0 |
| D | 0 | 32 | 0 |
| Mode M9 | |||
|---|---|---|---|
| Quadrant | BADHDUFLAG | Total packets | Discarded packets |
| A | 0 | 5 | 0 |
| B | 0 | 5 | 0 |
| C | 0 | 5 | 0 |
| D | 0 | 6 | 0 |
| Mode M0 | |||
|---|---|---|---|
| Quadrant | BADHDUFLAG | Total packets | Discarded packets |
| A | 0 | 3234 | 1 |
| B | 0 | 3940 | 1 |
| C | 0 | 4345 | 1 |
| D | 0 | 5543 | 1 |
| Quadrant | Total seconds | Saturated seconds | Saturation percentage |
|---|---|---|---|
| A | 1603 | 1 | 0.062383% |
| B | 1603 | 47 | 2.932002% |
| C | 1603 | 13 | 0.810979% |
| D | 1603 | 68 | 4.242046% |
Noise dominated data is calculated using 1-second bins in cleaned event files. If a bin has >2000 counts, and if more than 50% of those come from <1% of pixels, then it is considered to be noise-dominated and hence unusable.
| Quadrant | # 1 sec bins | Bins with >0 counts | Bins with >2000 counts | High rate bins dominated by noise | Noise dominated (total time) | Noise dominated (detector-on time) | Marked lightcurve |
|---|---|---|---|---|---|---|---|
| A | 1603 | 1603 | 0 | 0 | 0.00% | 0.00% | 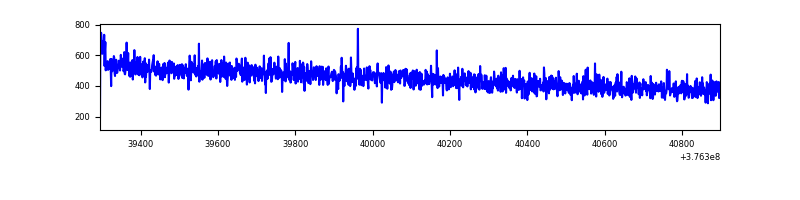 |
| B | 1603 | 1603 | 33 | 33 | 2.06% | 2.06% | 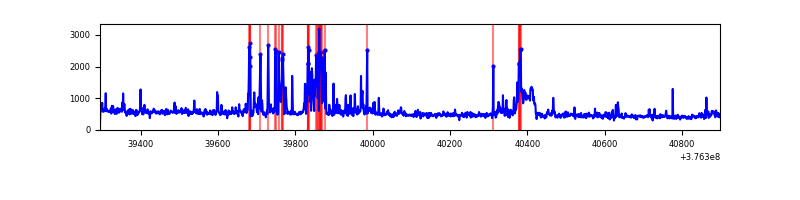 |
| C | 1603 | 1603 | 10 | 10 | 0.62% | 0.62% | 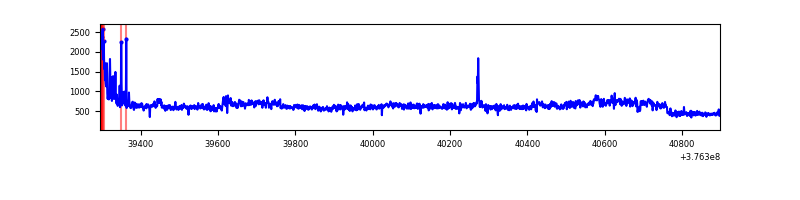 |
| D | 1603 | 1603 | 70 | 70 | 4.37% | 4.37% | 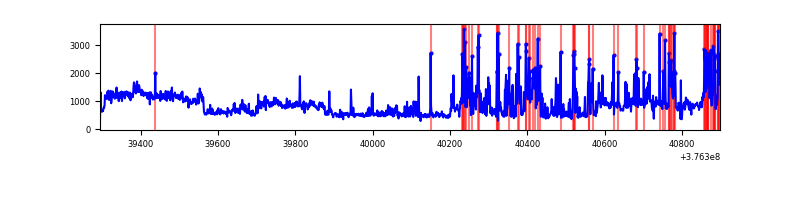 |
Top three noisy pixels from each quadrant. If the there are fewer than three noisy pixels in the level2.evt file, extra rows are filled as -1
| Pixel properties | Quadrant properties | ||||||
|---|---|---|---|---|---|---|---|
| Quadrant | DetID | PixID | Counts | Sigma | Mean | Median | Sigma |
| A | 13 | 6 | 3182 | 75.68 | 184 | 179 | 39.7 |
| A | 13 | 254 | 2800 | 66.05 | 184 | 179 | 39.7 |
| A | 10 | 83 | 2299 | 53.43 | 184 | 179 | 39.7 |
| B | 5 | 172 | 139787 | 3779.86 | 183 | 178 | 36.9 |
| B | 5 | 200 | 43128 | 1162.85 | 183 | 178 | 36.9 |
| B | 0 | 190 | 18461 | 495.01 | 183 | 178 | 36.9 |
| C | 10 | 49 | 194675 | 4420.77 | 182 | 183 | 44.0 |
| C | 15 | 214 | 71364 | 1617.93 | 182 | 183 | 44.0 |
| C | 0 | 10 | 46677 | 1056.8 | 182 | 183 | 44.0 |
| D | 8 | 195 | 416550 | 9051.57 | 178 | 172 | 46.0 |
| D | 12 | 218 | 201975 | 4386.96 | 178 | 172 | 46.0 |
| D | 12 | 6 | 69429 | 1505.57 | 178 | 172 | 46.0 |
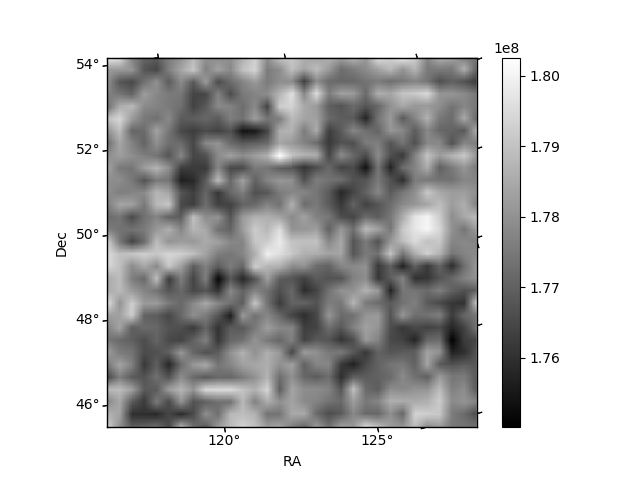
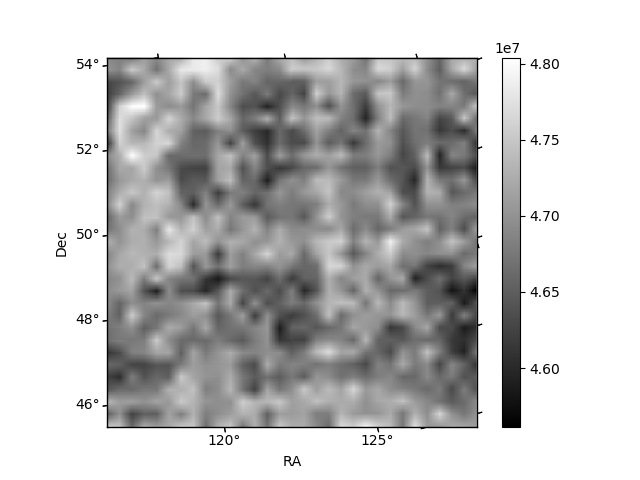
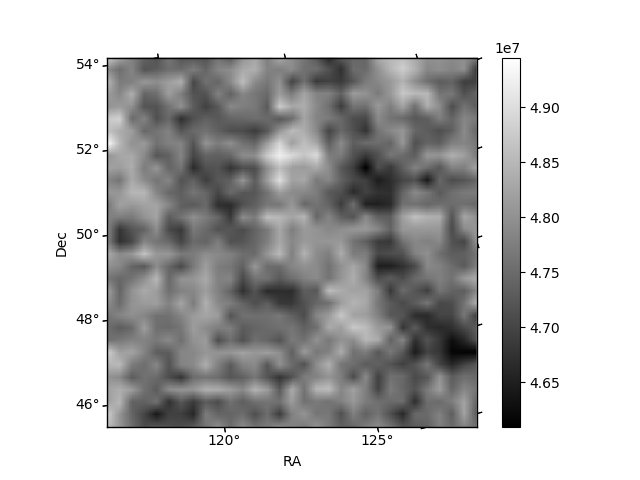
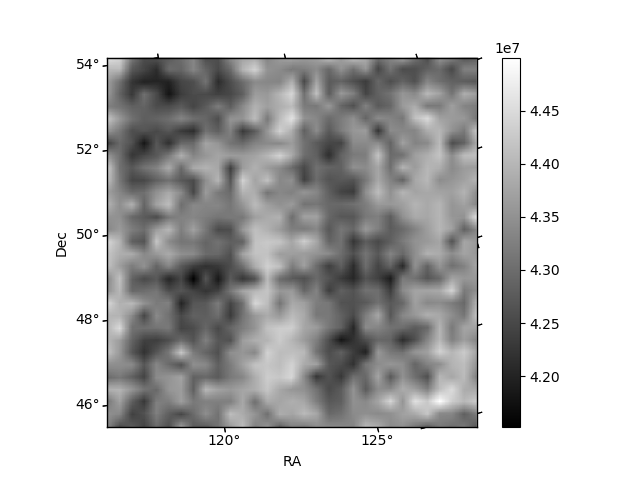
Histogram calculated using DETX and DETY for each event in the final _common_clean file
| Quadrant A | 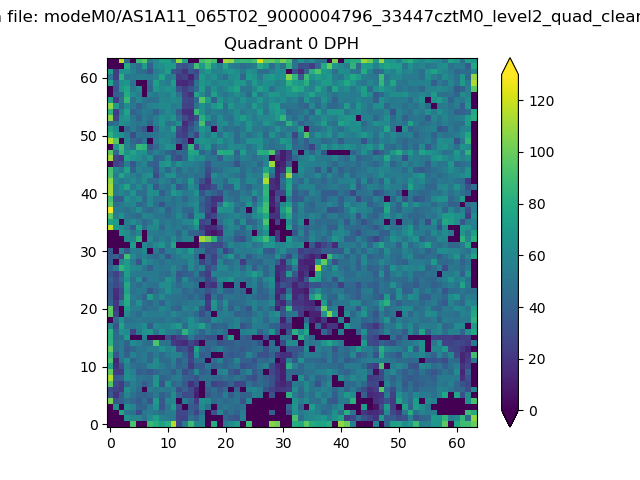 |
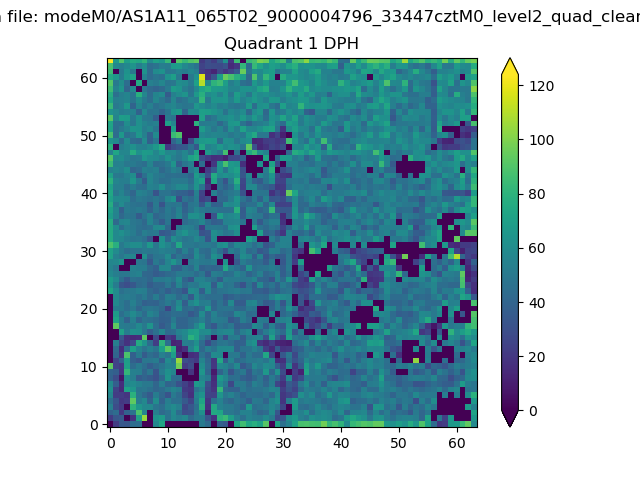 |
Quadrant B |
|---|---|---|---|
| Quadrant D | 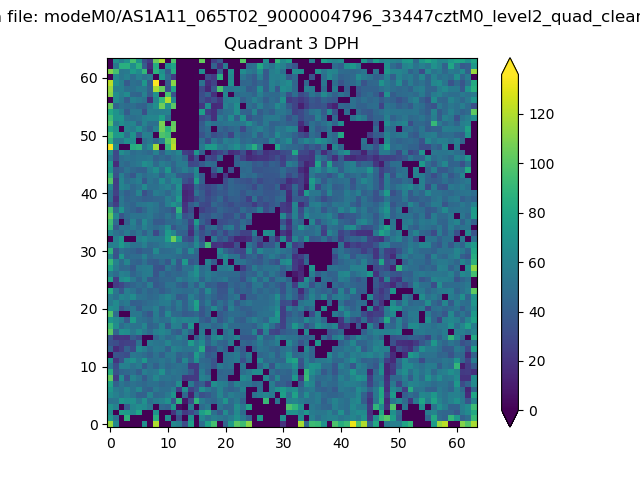 |
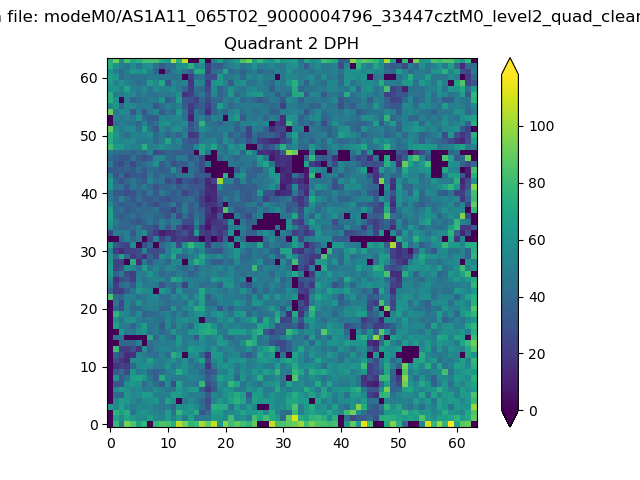 |
Quadrant C |
| Plot type | Count rate plots | Images |
|---|---|---|
| Comparison with Poisson distribution Blue bars denote a histogram of data divided into 1 sec bins. Red curve is a Poisson curve with rate = median count rate of data. |
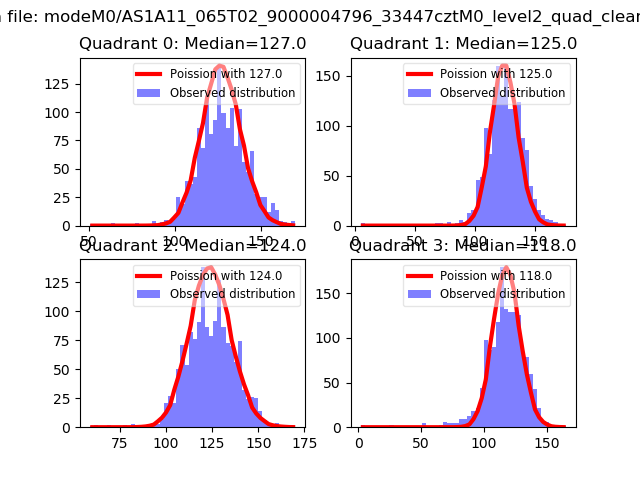 |
 |
| Quadrant-wise count rates Data is divided into 100 sec bins |
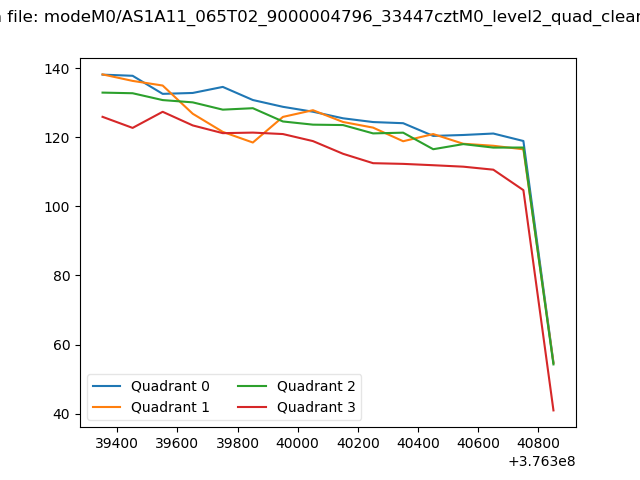 |
|
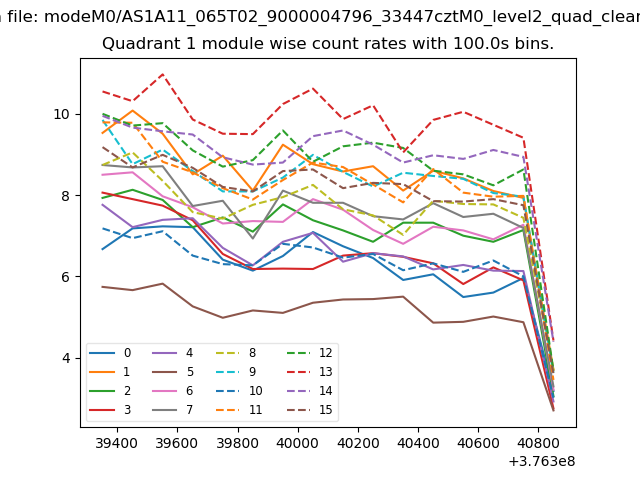
| Module-wise count rates for Quadrant A Data is divided into 100 sec bins |
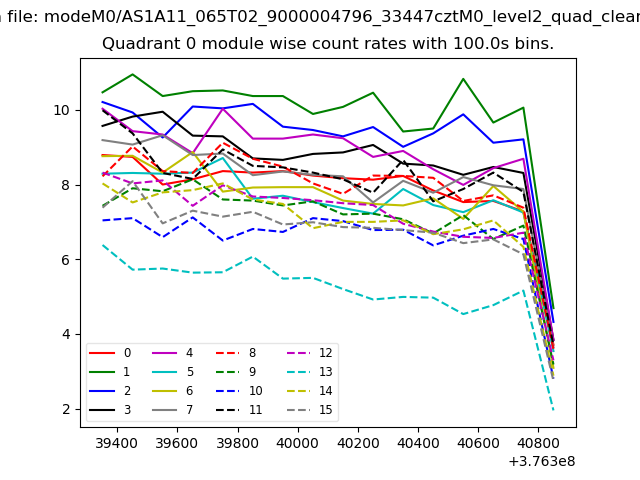 |
 |
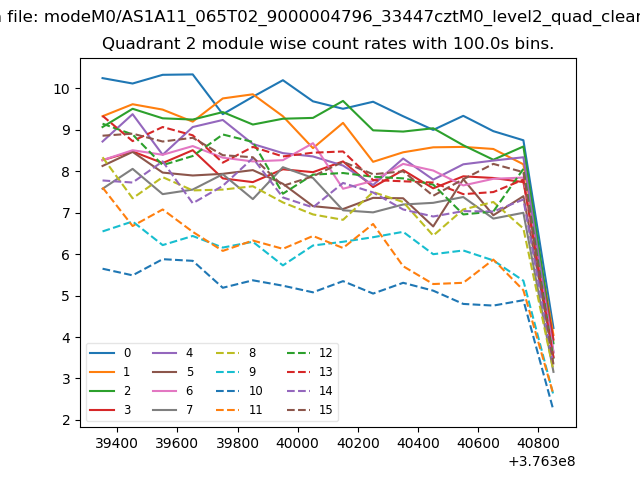
| Module-wise count rates for Quadrant B Data is divided into 100 sec bins |
 |
 |
| Module-wise count rates for Quadrant C Data is divided into 100 sec bins |
 |
 |
| Module-wise count rates for Quadrant D Data is divided into 100 sec bins |
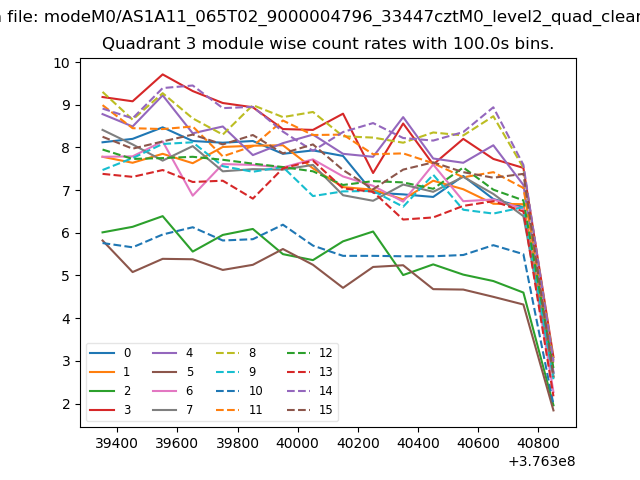 |
 |
| Parameter | Plot |
|---|---|
| CZT HV Monitor | 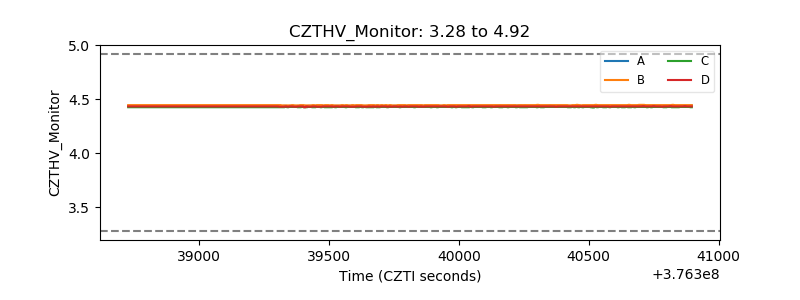 |
| D_VDD | 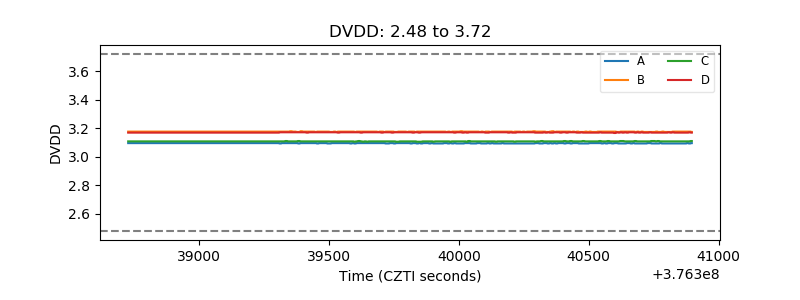 |
| Temperature 1 | 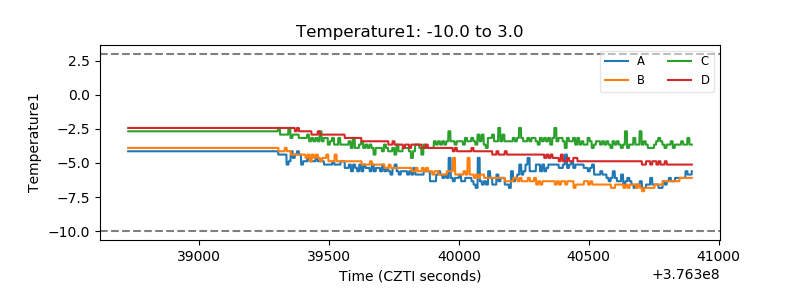 |
| Veto HV Monitor | 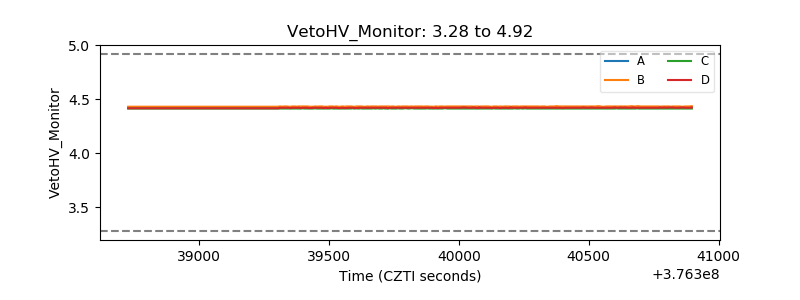 |
| Veto LLD | 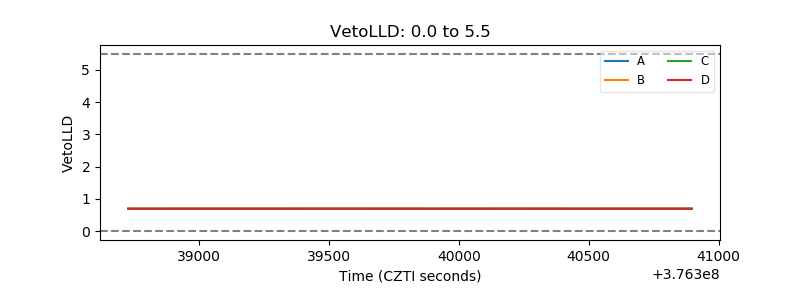 |
| Alpha Counter | 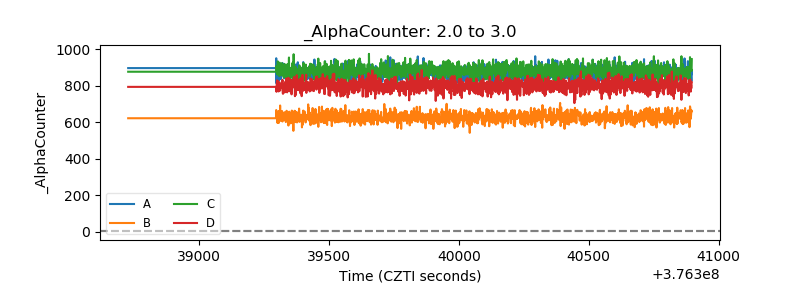 |
| _CPM_Rate | 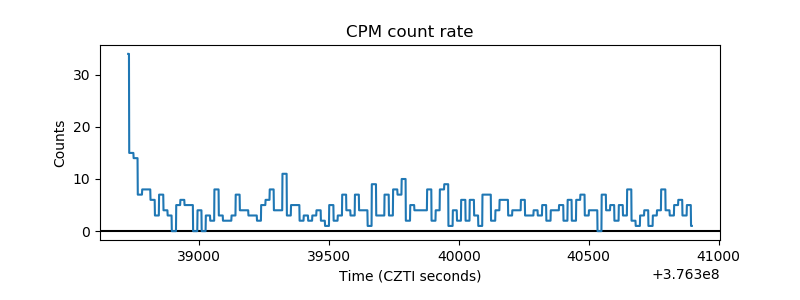 |
| CZT Counter | 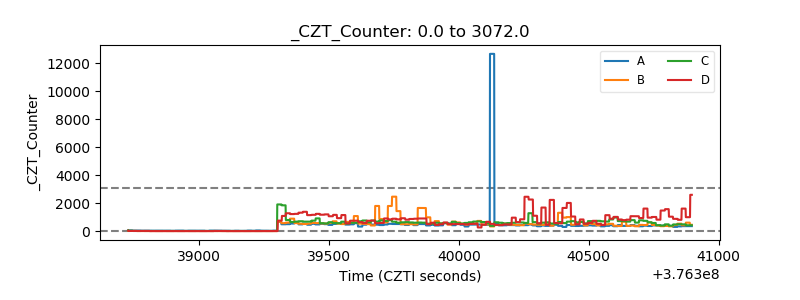 |
| +2.5 Volts monitor |  |
| +5 Volts monitor | 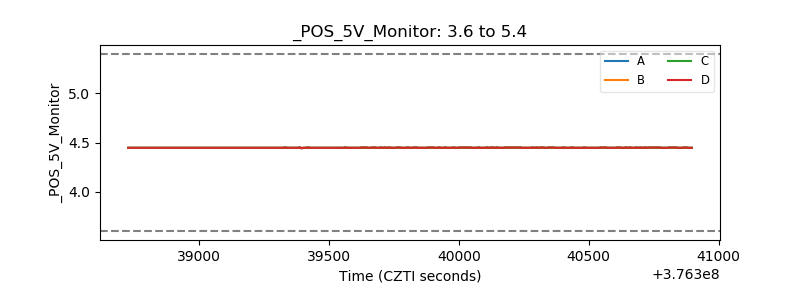 |
| _ROLL_ROT | 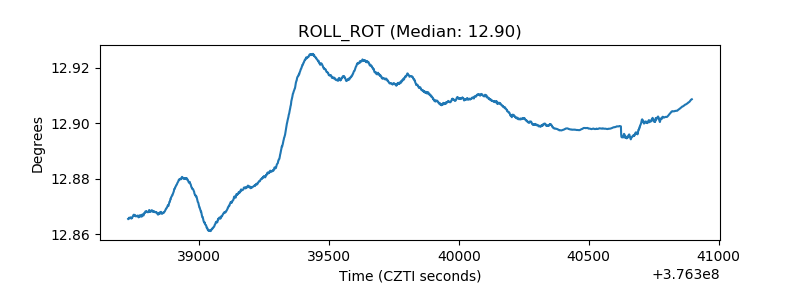 |
| _Roll_DEC | 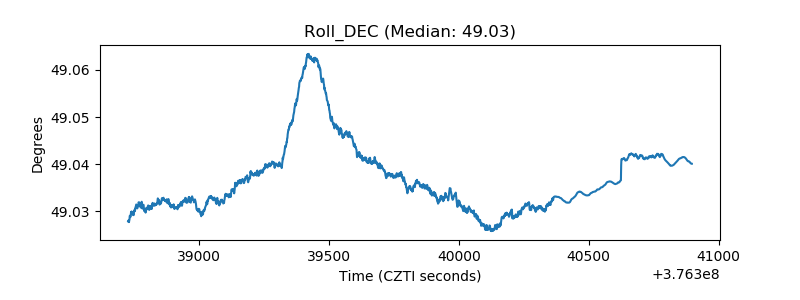 |
| _Roll_RA | 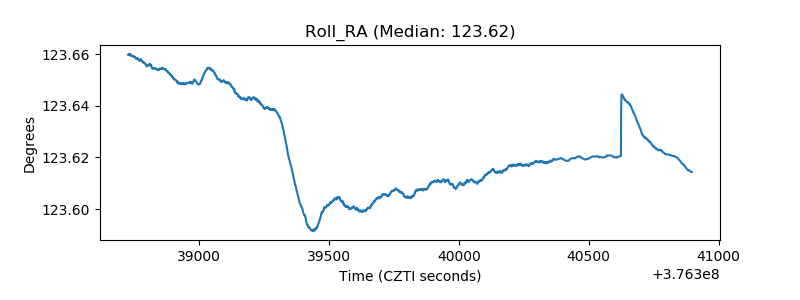 |
| Veto Counter | 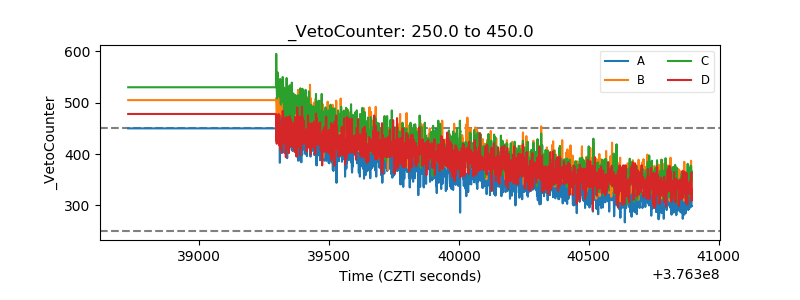 |