| Param | Original file | Final file |
|---|---|---|
| Filename | modeM0/AS1A11_065T07_9000004798cztM0_level2.fits | modeM0/AS1A11_065T07_9000004798cztM0_level2_quad_clean.evt |
| Size (bytes) | 371,848,320 | 260,205,120 |
| Size | 354.6 MB | 248.2 MB |
| Events in quadrant A | 2,338,968 | 1,400,045 |
| Events in quadrant B | 2,180,408 | 1,372,876 |
| Events in quadrant C | 2,212,184 | 1,314,802 |
| Events in quadrant D | 1,904,740 | 1,165,961 |
| Mode M9 | |||
|---|---|---|---|
| Quadrant | BADHDUFLAG | Total packets | Discarded packets |
| A | 0 | 171 | 0 |
| B | 0 | 171 | 0 |
| C | 0 | 171 | 0 |
| D | 0 | 171 | 0 |
| Mode SS | |||
|---|---|---|---|
| Quadrant | BADHDUFLAG | Total packets | Discarded packets |
| A | 0 | 780 | 0 |
| B | 0 | 780 | 0 |
| C | 0 | 780 | 0 |
| D | 0 | 780 | 0 |
| Mode M0 | |||
|---|---|---|---|
| Quadrant | BADHDUFLAG | Total packets | Discarded packets |
| A | 0 | 77108 | 0 |
| B | 0 | 100551 | 0 |
| C | 0 | 95159 | 0 |
| D | 0 | 128094 | 0 |
| Quadrant | Total seconds | Saturated seconds | Saturation percentage |
|---|---|---|---|
| A | 38220 | 42 | 0.109890% |
| B | 38220 | 1950 | 5.102041% |
| C | 38220 | 1275 | 3.335950% |
| D | 38220 | 1327 | 3.472004% |
Noise dominated data is calculated using 1-second bins in cleaned event files. If a bin has >2000 counts, and if more than 50% of those come from <1% of pixels, then it is considered to be noise-dominated and hence unusable.
| Quadrant | # 1 sec bins | Bins with >0 counts | Bins with >2000 counts | High rate bins dominated by noise | Noise dominated (total time) | Noise dominated (detector-on time) | Marked lightcurve |
|---|---|---|---|---|---|---|---|
| A | 55194 | 38219 | 0 | 0 | 0.00% | 0.00% |  |
| B | 55195 | 38207 | 0 | 0 | 0.00% | 0.00% |  |
| C | 55195 | 38197 | 0 | 0 | 0.00% | 0.00% |  |
| D | 55195 | 38209 | 0 | 0 | 0.00% | 0.00% | 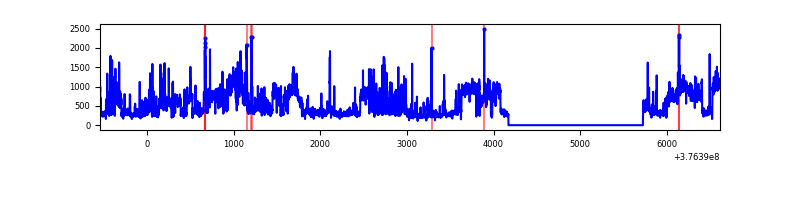 |
Top three noisy pixels from each quadrant. If the there are fewer than three noisy pixels in the level2.evt file, extra rows are filled as -1
| Pixel properties | Quadrant properties | ||||||
|---|---|---|---|---|---|---|---|
| Quadrant | DetID | PixID | Counts | Sigma | Mean | Median | Sigma |
| A | 0 | 29 | 1937 | 8.95 | 611 | 574 | 152.2 |
| A | 7 | 110 | 1887 | 8.62 | 611 | 574 | 152.2 |
| A | 9 | 19 | 1823 | 8.2 | 611 | 574 | 152.2 |
| B | 2 | 9 | 1881 | 11.54 | 578 | 553 | 115.1 |
| B | 3 | 80 | 1723 | 10.16 | 578 | 553 | 115.1 |
| B | 2 | 8 | 1548 | 8.64 | 578 | 553 | 115.1 |
| C | 1 | 81 | 1834 | 8.62 | 584 | 551 | 148.8 |
| C | 1 | 80 | 1736 | 7.96 | 584 | 551 | 148.8 |
| C | 1 | 65 | 1496 | 6.35 | 584 | 551 | 148.8 |
| D | 10 | 189 | 1439 | 6.42 | 546 | 500 | 146.2 |
| D | 7 | 3 | 1421 | 6.3 | 546 | 500 | 146.2 |
| D | 6 | 62 | 1394 | 6.12 | 546 | 500 | 146.2 |
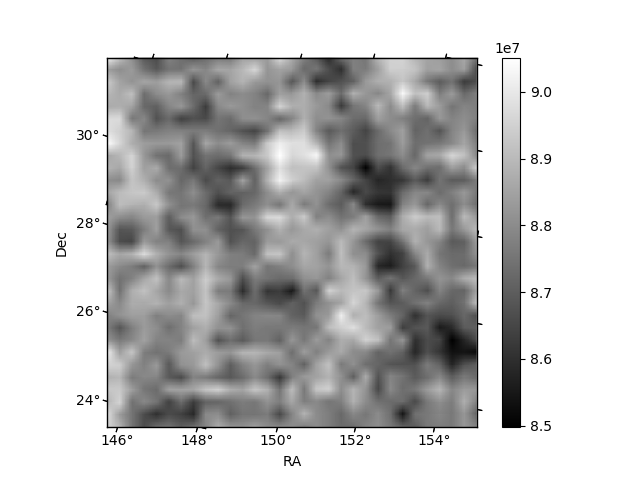
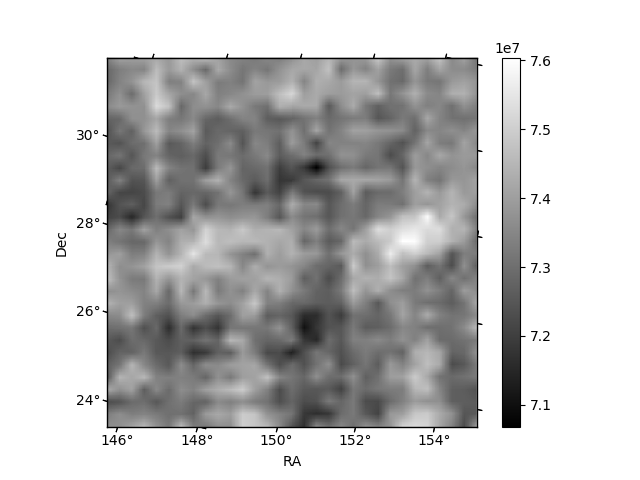
Histogram calculated using DETX and DETY for each event in the final _common_clean file
| Quadrant A | 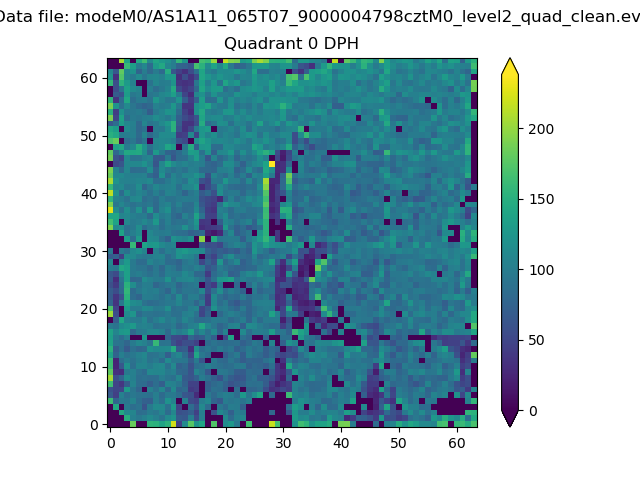 |
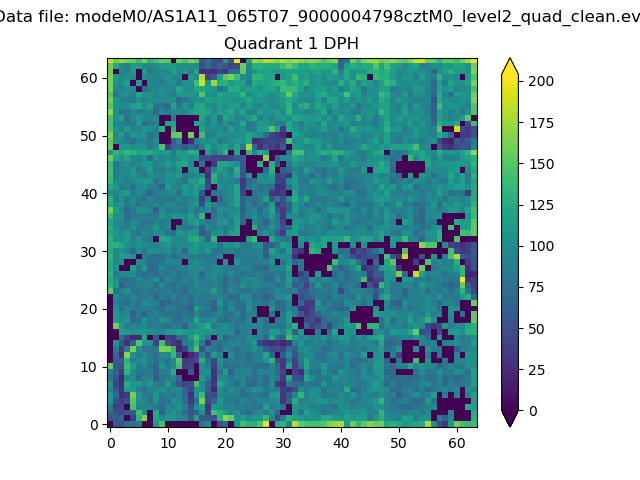 |
Quadrant B |
|---|---|---|---|
| Quadrant D |  |
 |
Quadrant C |
| Plot type | Count rate plots | Images |
|---|---|---|
| Comparison with Poisson distribution Blue bars denote a histogram of data divided into 1 sec bins. Red curve is a Poisson curve with rate = median count rate of data. |
 |
 |
| Quadrant-wise count rates Data is divided into 100 sec bins |
 |
|
| Module-wise count rates for Quadrant A Data is divided into 100 sec bins |
 |
 |
| Module-wise count rates for Quadrant B Data is divided into 100 sec bins |
 |
 |
| Module-wise count rates for Quadrant C Data is divided into 100 sec bins |
 |
 |
| Module-wise count rates for Quadrant D Data is divided into 100 sec bins |
 |
 |
| Parameter | Plot |
|---|---|
| CZT HV Monitor |  |
| D_VDD | 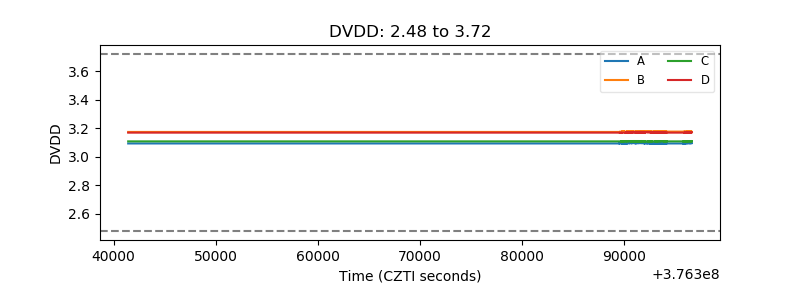 |
| Temperature 1 |  |
| Veto HV Monitor |  |
| Veto LLD |  |
| Alpha Counter |  |
| _CPM_Rate | 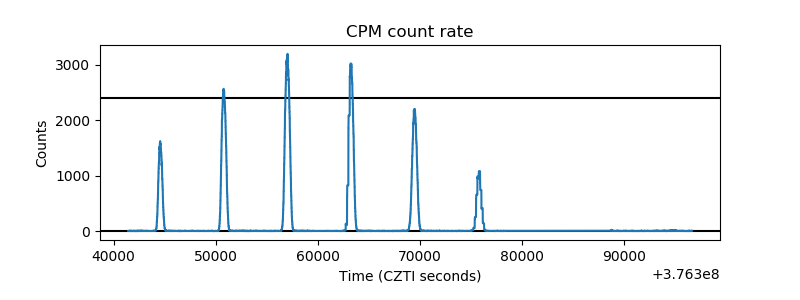 |
| CZT Counter | 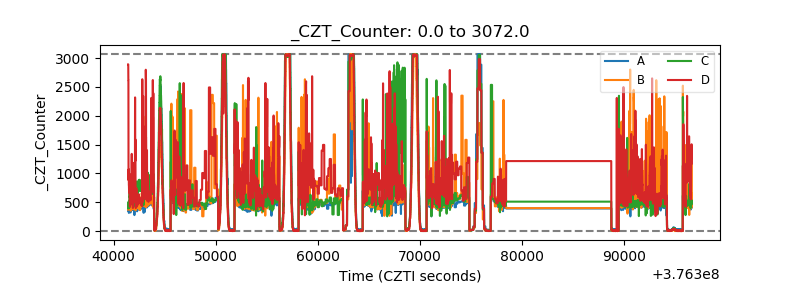 |
| +2.5 Volts monitor |  |
| +5 Volts monitor |  |
| _ROLL_ROT |  |
| _Roll_DEC | 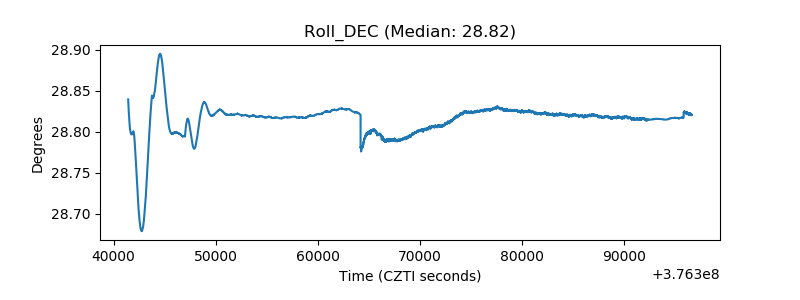 |
| _Roll_RA | 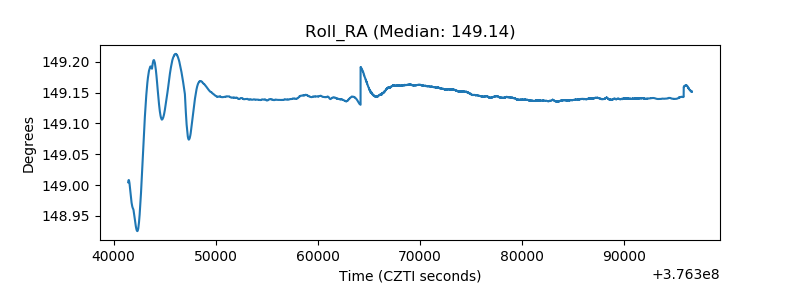 |
| Veto Counter |  |