| Param | Original file | Final file |
|---|---|---|
| Filename | modeM0/AS1A11_065T07_9000004798_33449cztM0_level2.evt | modeM0/AS1A11_065T07_9000004798_33449cztM0_level2_quad_clean.evt |
| Size (bytes) | 479,387,520 | 89,475,840 |
| Size | 457.2 MB | 85.3 MB |
| Events in quadrant A | 2,501,808 | 596,621 |
| Events in quadrant B | 3,611,390 | 595,070 |
| Events in quadrant C | 3,148,724 | 584,258 |
| Events in quadrant D | 4,886,105 | 551,608 |
| Mode M9 | |||
|---|---|---|---|
| Quadrant | BADHDUFLAG | Total packets | Discarded packets |
| A | 0 | 26 | 0 |
| B | 0 | 26 | 0 |
| C | 0 | 26 | 0 |
| D | 0 | 27 | 0 |
| Mode SS | |||
|---|---|---|---|
| Quadrant | BADHDUFLAG | Total packets | Discarded packets |
| A | 0 | 110 | 0 |
| B | 0 | 110 | 0 |
| C | 0 | 110 | 0 |
| D | 0 | 110 | 0 |
| Mode M0 | |||
|---|---|---|---|
| Quadrant | BADHDUFLAG | Total packets | Discarded packets |
| A | 0 | 11044 | 3 |
| B | 0 | 14368 | 2 |
| C | 0 | 12680 | 2 |
| D | 0 | 18415 | 2 |
| Quadrant | Total seconds | Saturated seconds | Saturation percentage |
|---|---|---|---|
| A | 5462 | 4 | 0.073233% |
| B | 5462 | 321 | 5.876968% |
| C | 5462 | 95 | 1.739290% |
| D | 5462 | 157 | 2.874405% |
Noise dominated data is calculated using 1-second bins in cleaned event files. If a bin has >2000 counts, and if more than 50% of those come from <1% of pixels, then it is considered to be noise-dominated and hence unusable.
| Quadrant | # 1 sec bins | Bins with >0 counts | Bins with >2000 counts | High rate bins dominated by noise | Noise dominated (total time) | Noise dominated (detector-on time) | Marked lightcurve |
|---|---|---|---|---|---|---|---|
| A | 7193 | 5463 | 0 | 0 | 0.00% | 0.00% | 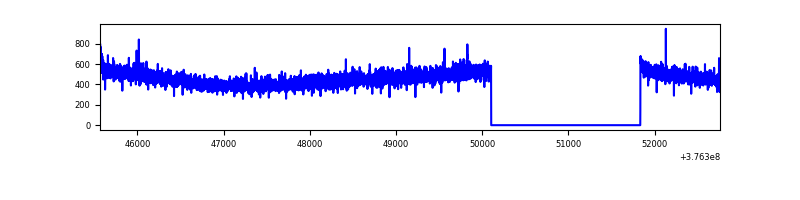 |
| B | 7193 | 5463 | 221 | 221 | 3.07% | 4.05% | 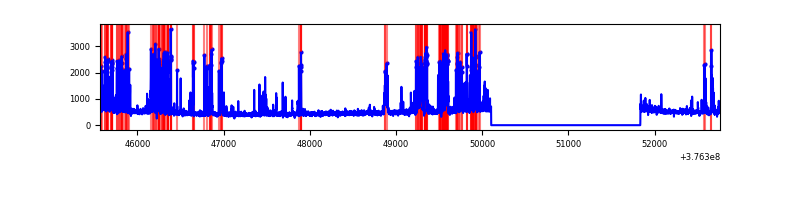 |
| C | 7193 | 5463 | 89 | 89 | 1.24% | 1.63% |  |
| D | 7193 | 5463 | 119 | 119 | 1.65% | 2.18% | 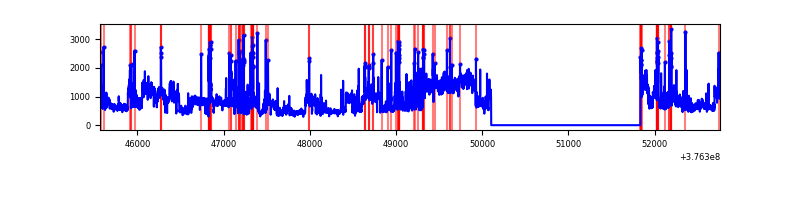 |
Top three noisy pixels from each quadrant. If the there are fewer than three noisy pixels in the level2.evt file, extra rows are filled as -1
| Pixel properties | Quadrant properties | ||||||
|---|---|---|---|---|---|---|---|
| Quadrant | DetID | PixID | Counts | Sigma | Mean | Median | Sigma |
| A | 13 | 254 | 9327 | 67.1 | 645 | 631 | 129.6 |
| A | 13 | 6 | 6552 | 45.69 | 645 | 631 | 129.6 |
| A | 3 | 137 | 6264 | 43.46 | 645 | 631 | 129.6 |
| B | 5 | 172 | 822996 | 6713.22 | 633 | 617 | 122.5 |
| B | 5 | 255 | 191519 | 1558.37 | 633 | 617 | 122.5 |
| B | 5 | 200 | 25176 | 200.48 | 633 | 617 | 122.5 |
| C | 1 | 23 | 298582 | 2065.56 | 624 | 629 | 144.2 |
| C | 15 | 214 | 234691 | 1622.63 | 624 | 629 | 144.2 |
| C | 0 | 10 | 88013 | 605.79 | 624 | 629 | 144.2 |
| D | 8 | 195 | 1803512 | 11812.34 | 617 | 599 | 152.6 |
| D | 2 | 249 | 177496 | 1159.0 | 617 | 599 | 152.6 |
| D | 2 | 250 | 171292 | 1118.35 | 617 | 599 | 152.6 |
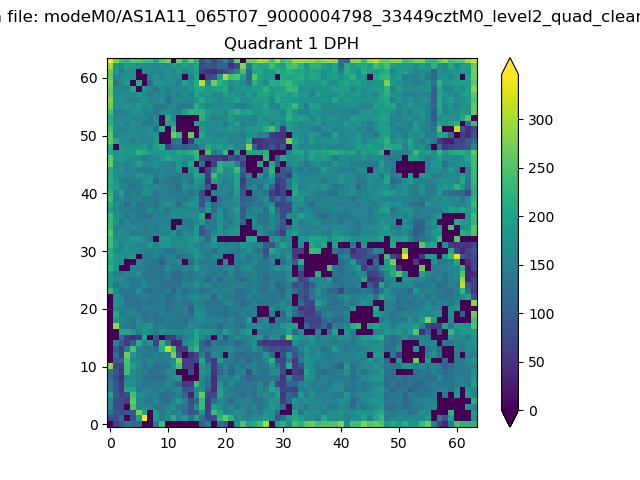
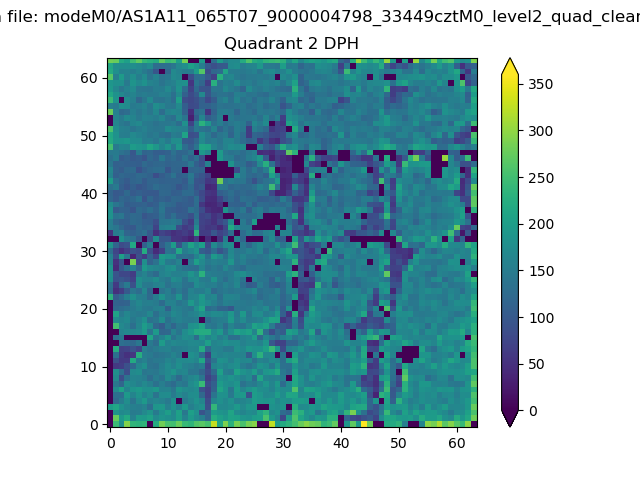
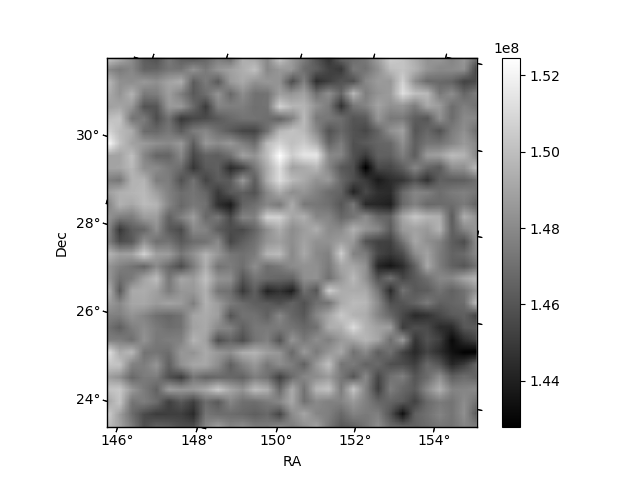
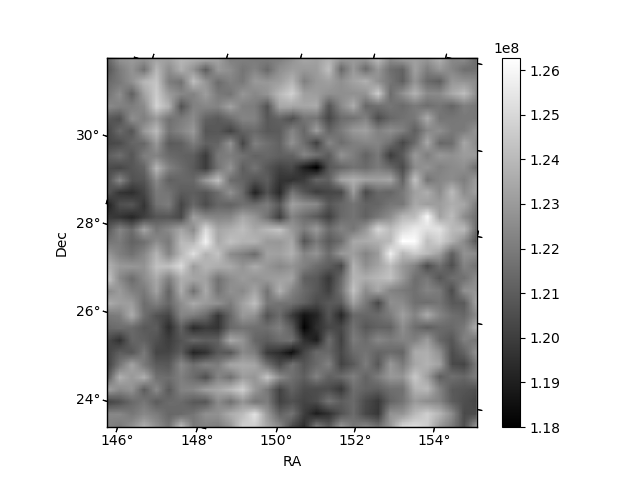
Histogram calculated using DETX and DETY for each event in the final _common_clean file
| Quadrant A | 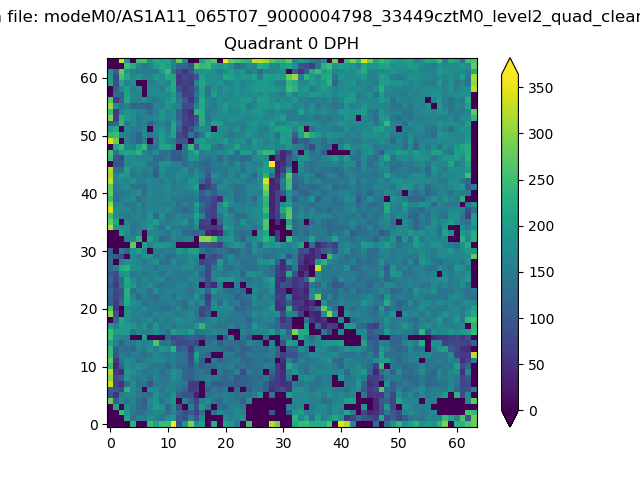 |
 |
Quadrant B |
|---|---|---|---|
| Quadrant D | 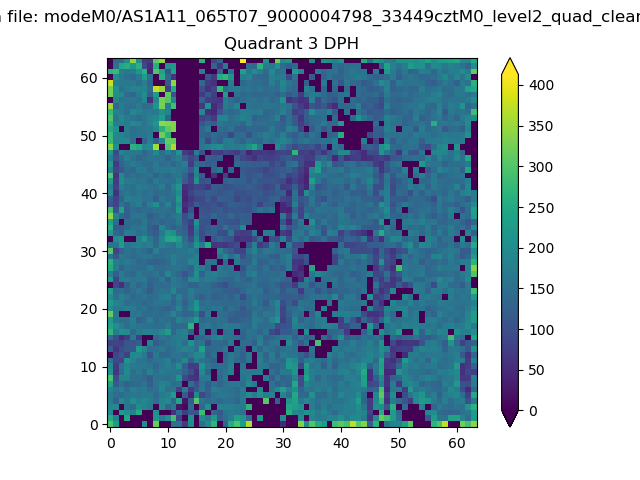 |
 |
Quadrant C |
| Plot type | Count rate plots | Images |
|---|---|---|
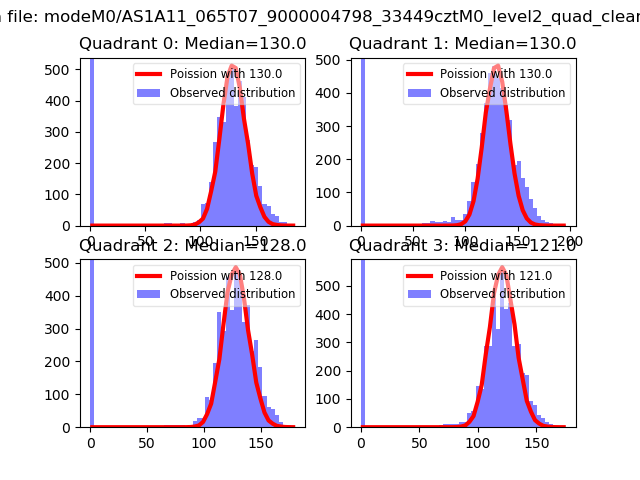
| Comparison with Poisson distribution Blue bars denote a histogram of data divided into 1 sec bins. Red curve is a Poisson curve with rate = median count rate of data. |
 |
 |
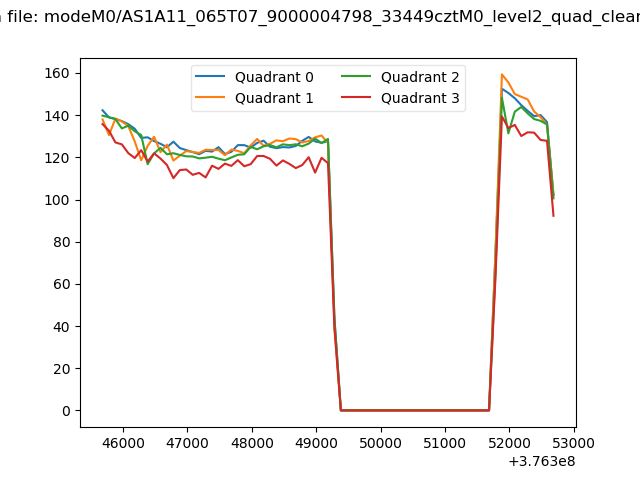
| Quadrant-wise count rates Data is divided into 100 sec bins |
 |
|
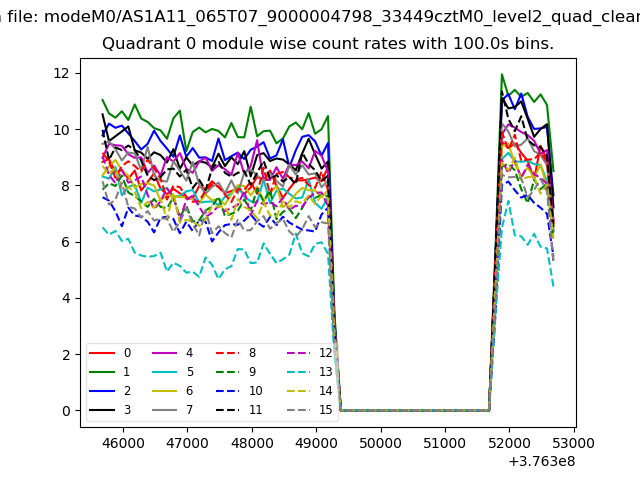
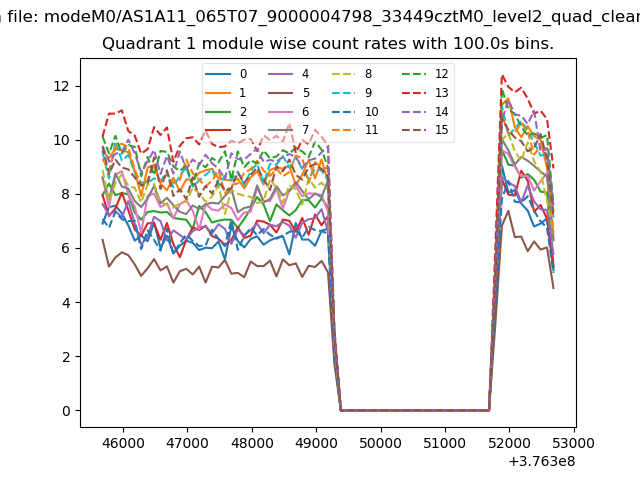
| Module-wise count rates for Quadrant A Data is divided into 100 sec bins |
 |
 |
| Module-wise count rates for Quadrant B Data is divided into 100 sec bins |
 |
 |
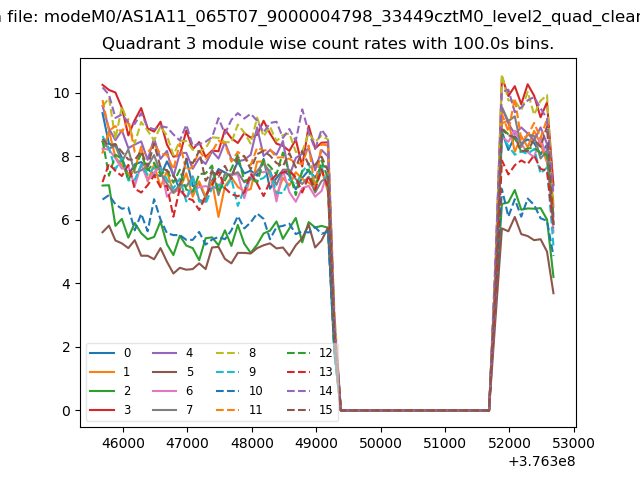
| Module-wise count rates for Quadrant C Data is divided into 100 sec bins |
 |
 |
| Module-wise count rates for Quadrant D Data is divided into 100 sec bins |
 |
 |
| Parameter | Plot |
|---|---|
| CZT HV Monitor | 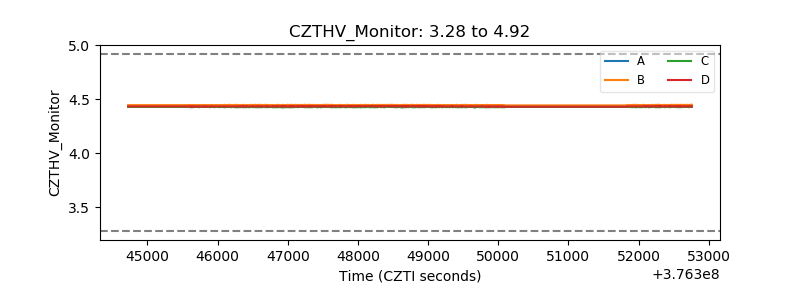 |
| D_VDD | 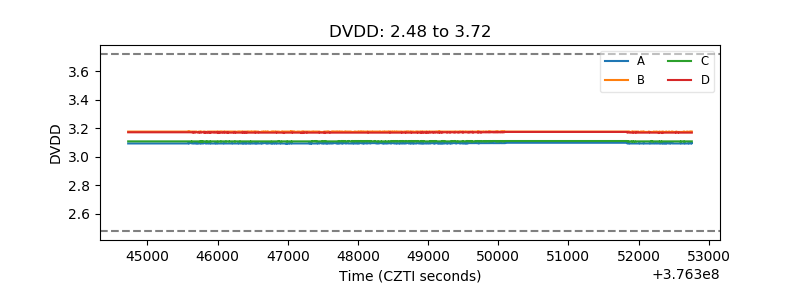 |
| Temperature 1 | 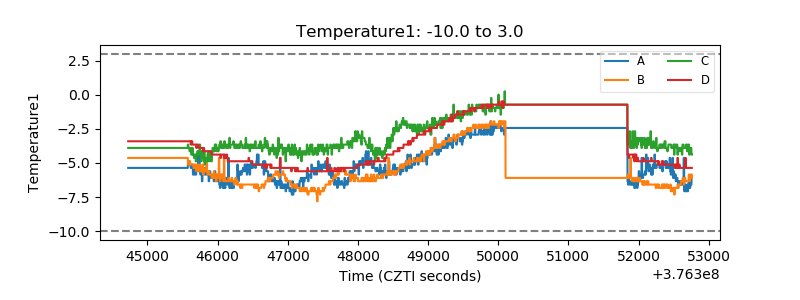 |
| Veto HV Monitor | 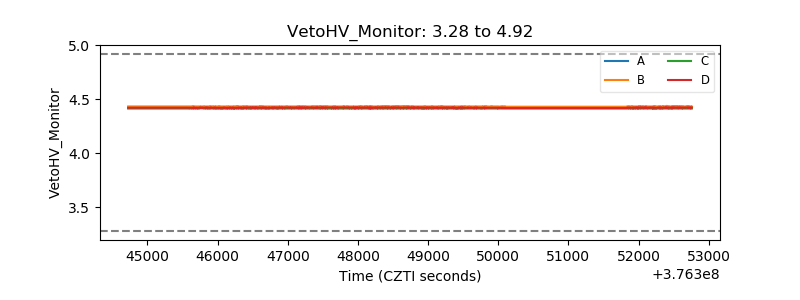 |
| Veto LLD | 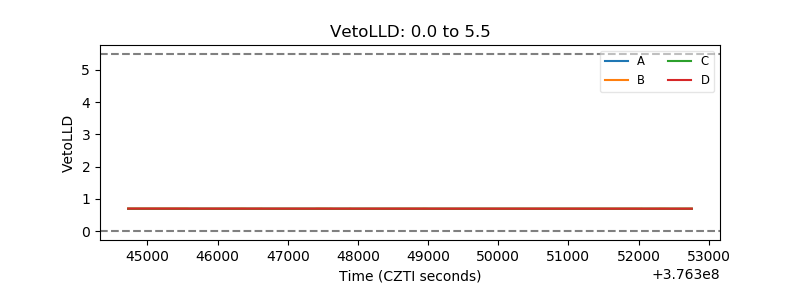 |
| Alpha Counter | 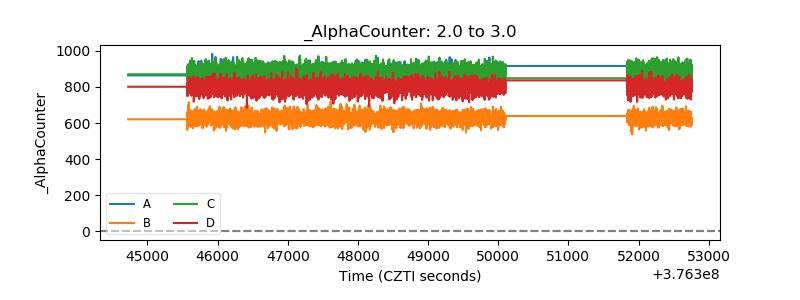 |
| _CPM_Rate | 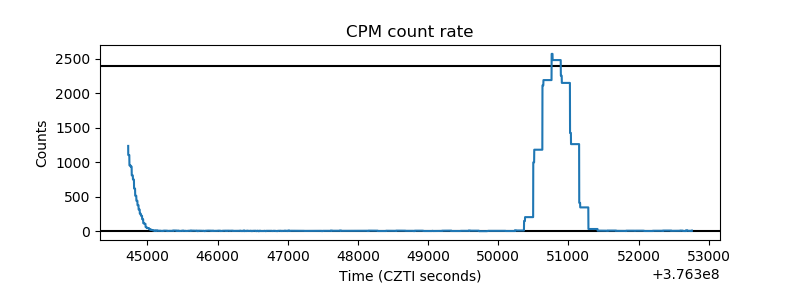 |
| CZT Counter | 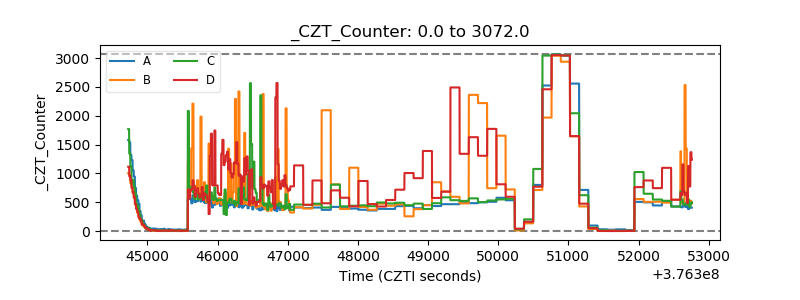 |
| +2.5 Volts monitor |  |
| +5 Volts monitor |  |
| _ROLL_ROT | 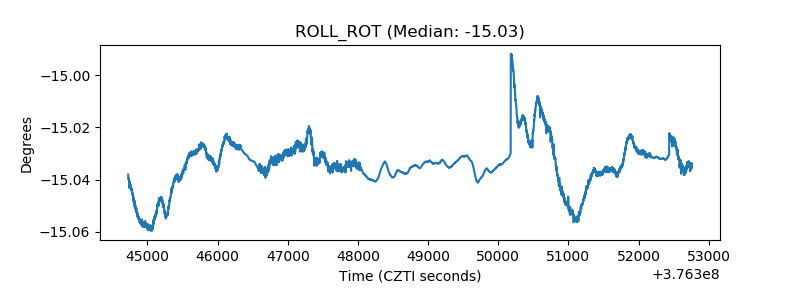 |
| _Roll_DEC | 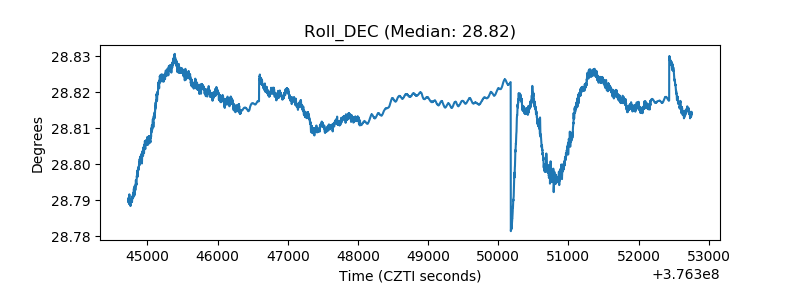 |
| _Roll_RA | 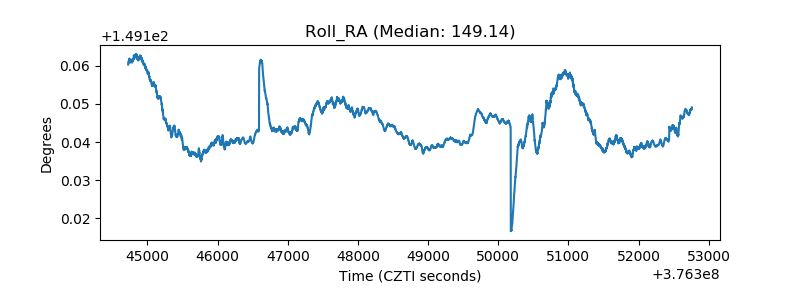 |
| Veto Counter | 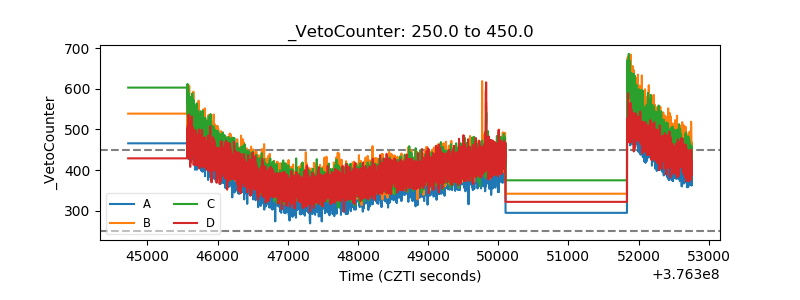 |