| Param | Original file | Final file |
|---|---|---|
| Filename | modeM0/AS1A11_065T07_9000004798_33450cztM0_level2.evt | modeM0/AS1A11_065T07_9000004798_33450cztM0_level2_quad_clean.evt |
| Size (bytes) | 495,711,360 | 91,630,080 |
| Size | 472.7 MB | 87.4 MB |
| Events in quadrant A | 2,575,467 | 612,953 |
| Events in quadrant B | 3,630,695 | 617,902 |
| Events in quadrant C | 3,265,705 | 601,282 |
| Events in quadrant D | 5,166,289 | 556,014 |
| Mode M9 | |||
|---|---|---|---|
| Quadrant | BADHDUFLAG | Total packets | Discarded packets |
| A | 0 | 29 | 0 |
| B | 0 | 29 | 0 |
| C | 0 | 29 | 0 |
| D | 0 | 30 | 0 |
| Mode SS | |||
|---|---|---|---|
| Quadrant | BADHDUFLAG | Total packets | Discarded packets |
| A | 0 | 112 | 0 |
| B | 0 | 112 | 0 |
| C | 0 | 112 | 0 |
| D | 0 | 112 | 0 |
| Mode M0 | |||
|---|---|---|---|
| Quadrant | BADHDUFLAG | Total packets | Discarded packets |
| A | 0 | 11170 | 3 |
| B | 0 | 14424 | 2 |
| C | 0 | 12916 | 2 |
| D | 0 | 19185 | 2 |
| Quadrant | Total seconds | Saturated seconds | Saturation percentage |
|---|---|---|---|
| A | 5528 | 9 | 0.162808% |
| B | 5528 | 208 | 3.762663% |
| C | 5528 | 82 | 1.483357% |
| D | 5528 | 276 | 4.992764% |
Noise dominated data is calculated using 1-second bins in cleaned event files. If a bin has >2000 counts, and if more than 50% of those come from <1% of pixels, then it is considered to be noise-dominated and hence unusable.
| Quadrant | # 1 sec bins | Bins with >0 counts | Bins with >2000 counts | High rate bins dominated by noise | Noise dominated (total time) | Noise dominated (detector-on time) | Marked lightcurve |
|---|---|---|---|---|---|---|---|
| A | 7411 | 5529 | 0 | 0 | 0.00% | 0.00% | 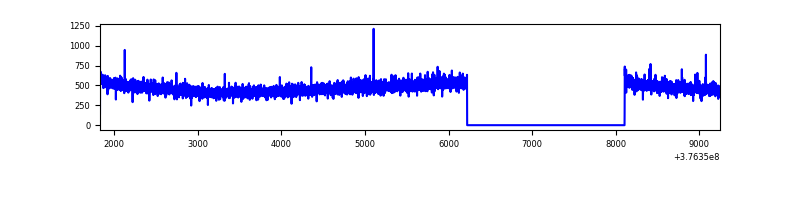 |
| B | 7411 | 5529 | 149 | 149 | 2.01% | 2.69% | 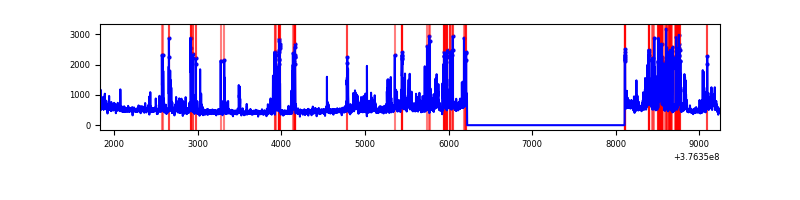 |
| C | 7411 | 5529 | 68 | 68 | 0.92% | 1.23% | 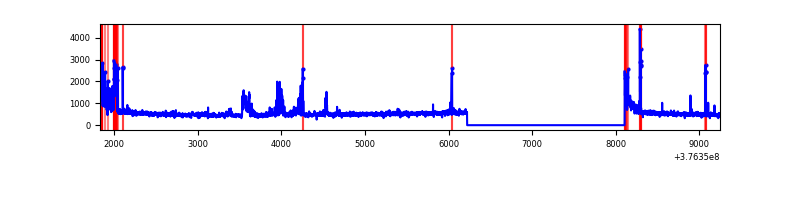 |
| D | 7411 | 5529 | 257 | 257 | 3.47% | 4.65% | 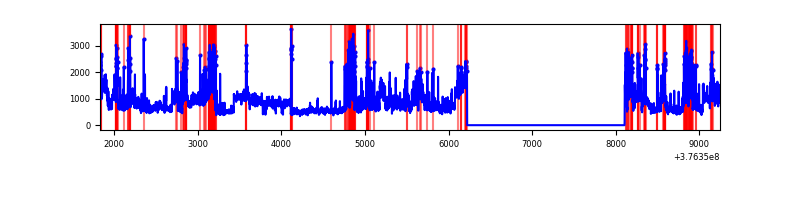 |
Top three noisy pixels from each quadrant. If the there are fewer than three noisy pixels in the level2.evt file, extra rows are filled as -1
| Pixel properties | Quadrant properties | ||||||
|---|---|---|---|---|---|---|---|
| Quadrant | DetID | PixID | Counts | Sigma | Mean | Median | Sigma |
| A | 13 | 6 | 11143 | 78.61 | 663 | 653 | 133.4 |
| A | 13 | 254 | 9140 | 63.6 | 663 | 653 | 133.4 |
| A | 3 | 137 | 6257 | 42.0 | 663 | 653 | 133.4 |
| B | 5 | 172 | 692003 | 5522.59 | 658 | 643 | 125.2 |
| B | 5 | 255 | 192444 | 1532.11 | 658 | 643 | 125.2 |
| B | 0 | 213 | 61742 | 488.06 | 658 | 643 | 125.2 |
| C | 1 | 23 | 253613 | 1716.56 | 639 | 644 | 147.4 |
| C | 15 | 214 | 239201 | 1618.77 | 639 | 644 | 147.4 |
| C | 9 | 187 | 161513 | 1091.6 | 639 | 644 | 147.4 |
| D | 8 | 195 | 1546494 | 10061.18 | 626 | 610 | 153.6 |
| D | 2 | 250 | 820438 | 5335.74 | 626 | 610 | 153.6 |
| D | 12 | 218 | 96122 | 621.63 | 626 | 610 | 153.6 |
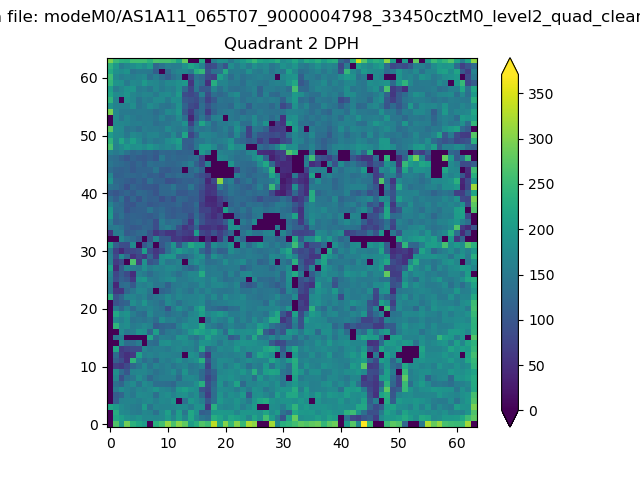
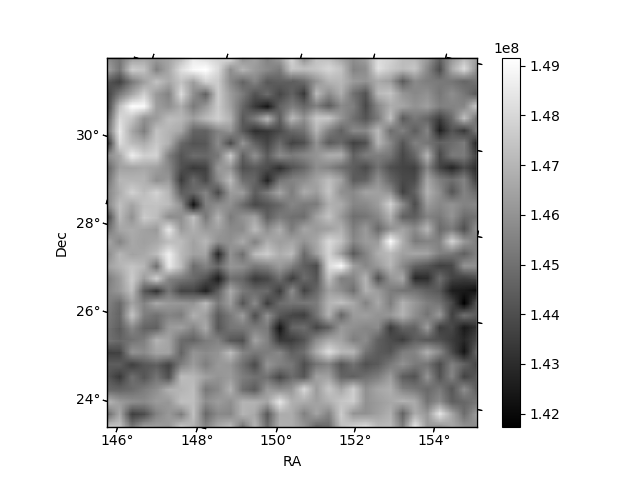
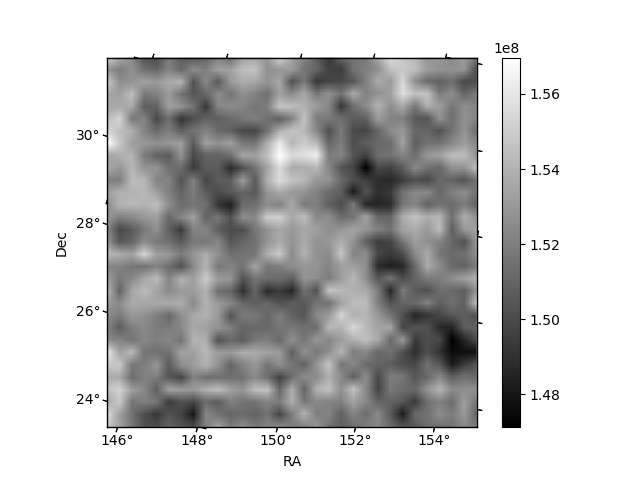
Histogram calculated using DETX and DETY for each event in the final _common_clean file
| Quadrant A |  |
 |
Quadrant B |
|---|---|---|---|
| Quadrant D | 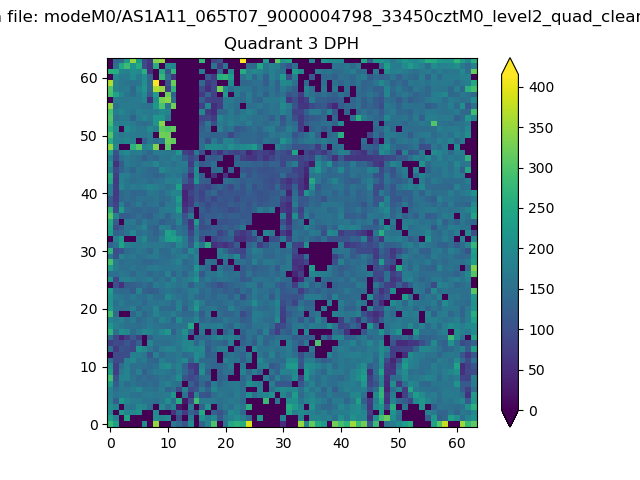 |
 |
Quadrant C |
| Plot type | Count rate plots | Images |
|---|---|---|
| Comparison with Poisson distribution Blue bars denote a histogram of data divided into 1 sec bins. Red curve is a Poisson curve with rate = median count rate of data. |
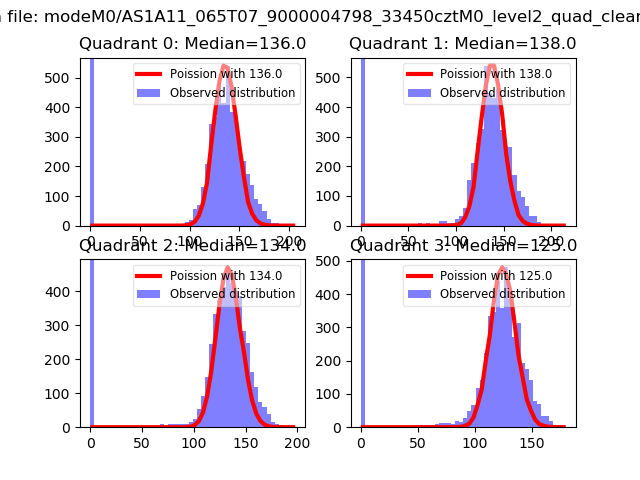 |
 |
| Quadrant-wise count rates Data is divided into 100 sec bins |
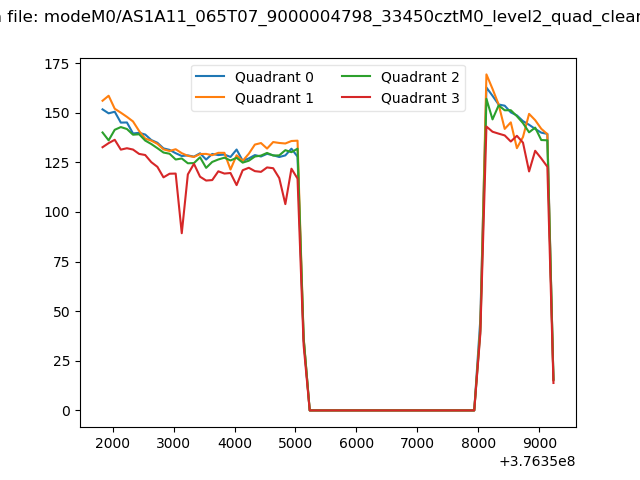 |
|
| Module-wise count rates for Quadrant A Data is divided into 100 sec bins |
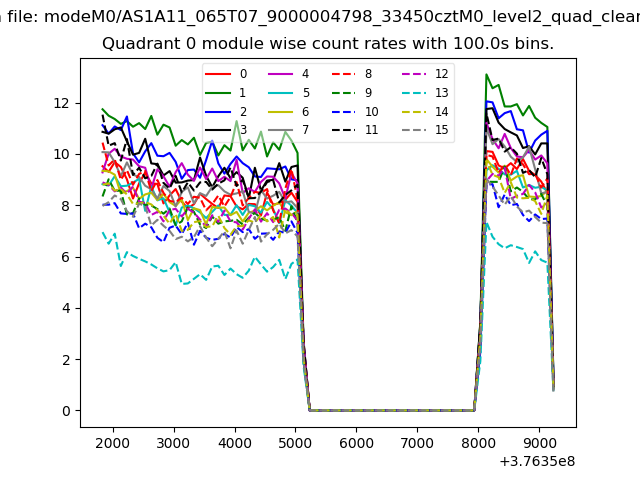 |
 |
| Module-wise count rates for Quadrant B Data is divided into 100 sec bins |
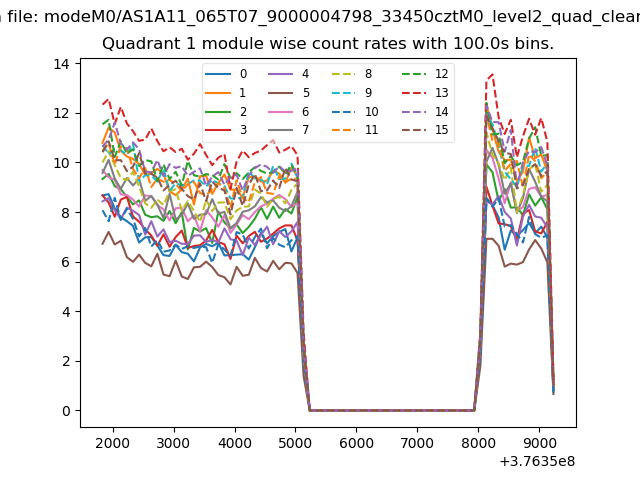 |
 |
| Module-wise count rates for Quadrant C Data is divided into 100 sec bins |
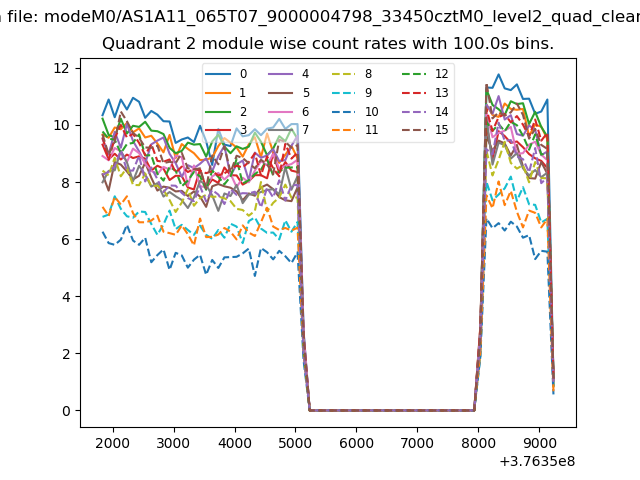 |
 |
| Module-wise count rates for Quadrant D Data is divided into 100 sec bins |
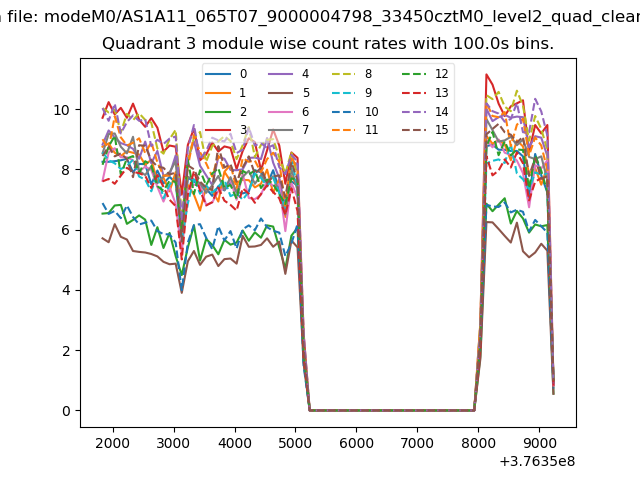 |
 |
| Parameter | Plot |
|---|---|
| CZT HV Monitor | 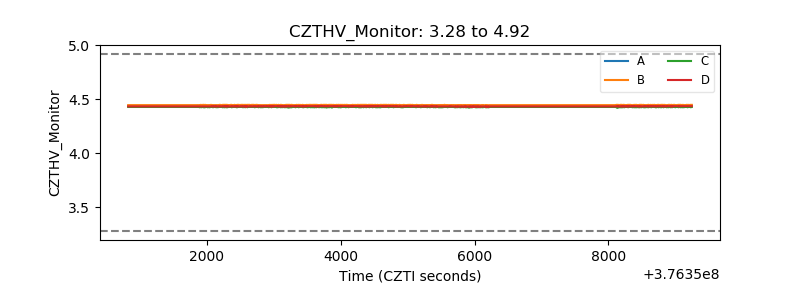 |
| D_VDD | 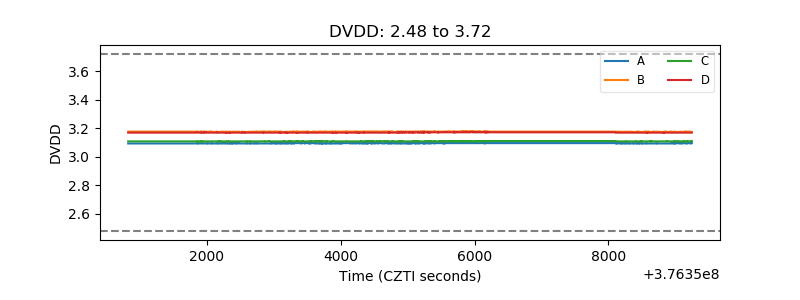 |
| Temperature 1 | 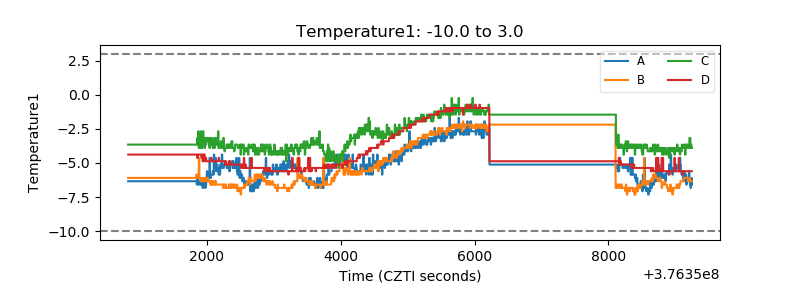 |
| Veto HV Monitor | 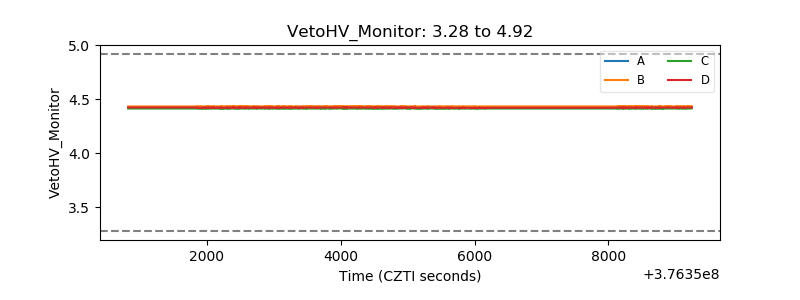 |
| Veto LLD | 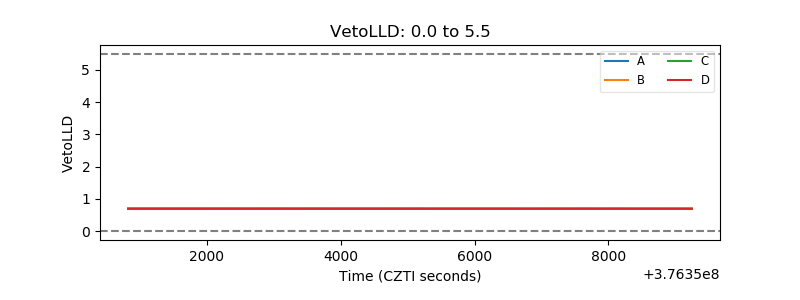 |
| Alpha Counter | 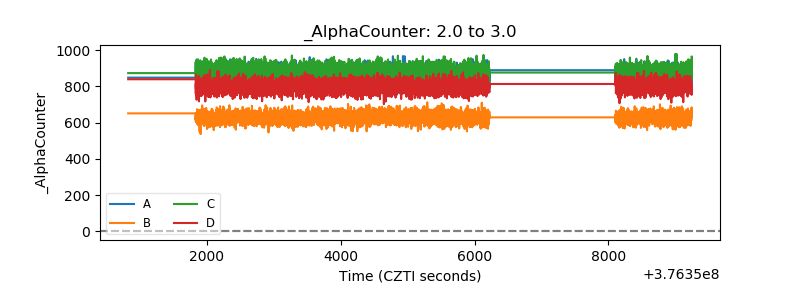 |
| _CPM_Rate | 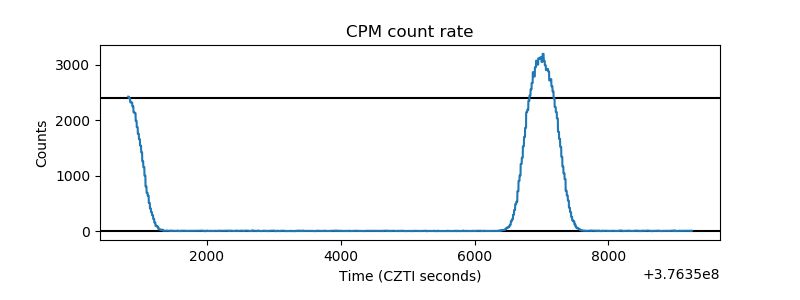 |
| CZT Counter | 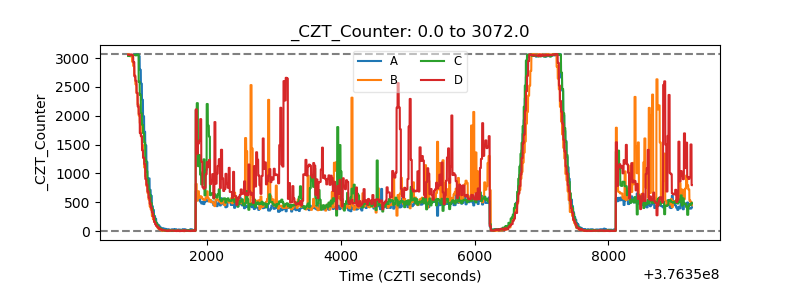 |
| +2.5 Volts monitor |  |
| +5 Volts monitor | 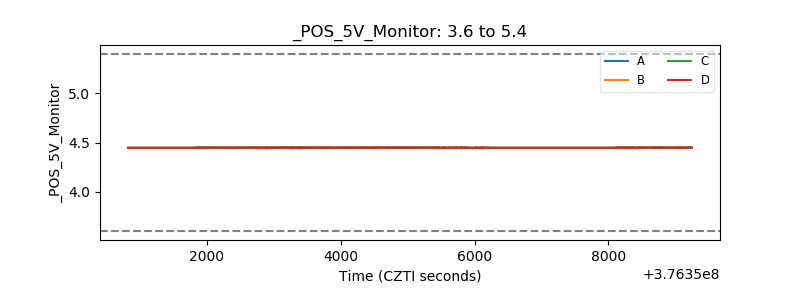 |
| _ROLL_ROT | 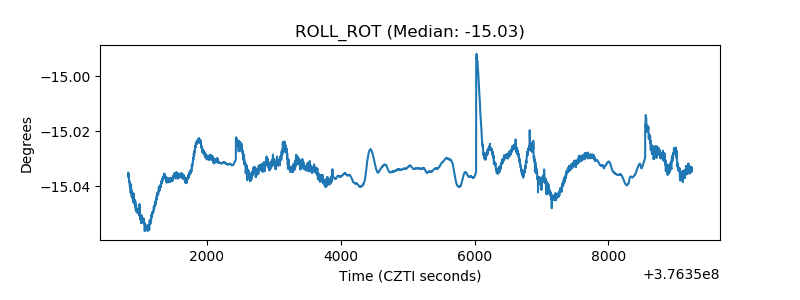 |
| _Roll_DEC | 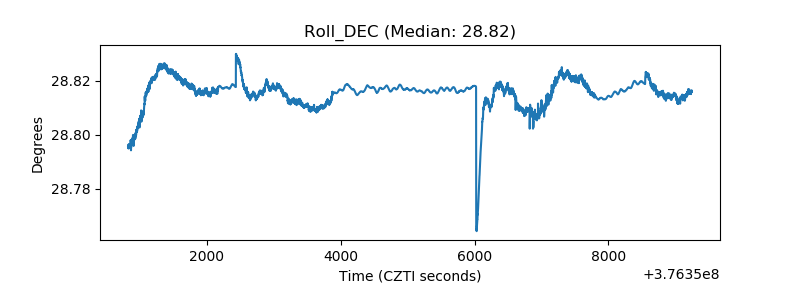 |
| _Roll_RA |  |
| Veto Counter | 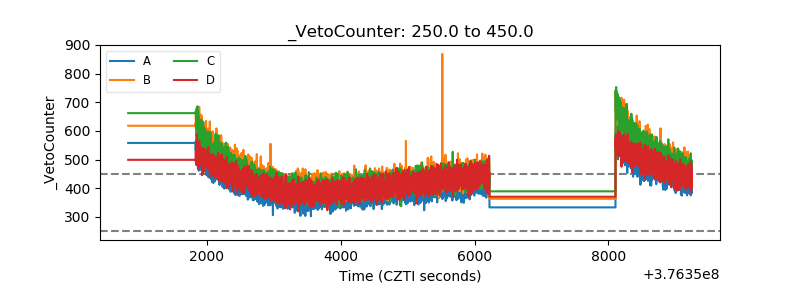 |