| Param | Original file | Final file |
|---|---|---|
| Filename | modeM0/AS1A11_065T07_9000004798_33451cztM0_level2.evt | modeM0/AS1A11_065T07_9000004798_33451cztM0_level2_quad_clean.evt |
| Size (bytes) | 469,062,720 | 86,114,880 |
| Size | 447.3 MB | 82.1 MB |
| Events in quadrant A | 2,564,123 | 572,408 |
| Events in quadrant B | 3,530,375 | 580,879 |
| Events in quadrant C | 3,006,505 | 561,159 |
| Events in quadrant D | 4,741,221 | 518,366 |
| Mode M9 | |||
|---|---|---|---|
| Quadrant | BADHDUFLAG | Total packets | Discarded packets |
| A | 0 | 33 | 0 |
| B | 0 | 33 | 0 |
| C | 0 | 33 | 0 |
| D | 0 | 34 | 0 |
| Mode SS | |||
|---|---|---|---|
| Quadrant | BADHDUFLAG | Total packets | Discarded packets |
| A | 0 | 110 | 0 |
| B | 0 | 110 | 0 |
| C | 0 | 110 | 0 |
| D | 0 | 110 | 0 |
| Mode M0 | |||
|---|---|---|---|
| Quadrant | BADHDUFLAG | Total packets | Discarded packets |
| A | 0 | 10842 | 3 |
| B | 0 | 13890 | 2 |
| C | 0 | 11996 | 2 |
| D | 0 | 17832 | 2 |
| Quadrant | Total seconds | Saturated seconds | Saturation percentage |
|---|---|---|---|
| A | 5355 | 6 | 0.112045% |
| B | 5355 | 221 | 4.126984% |
| C | 5355 | 58 | 1.083100% |
| D | 5355 | 152 | 2.838469% |
Noise dominated data is calculated using 1-second bins in cleaned event files. If a bin has >2000 counts, and if more than 50% of those come from <1% of pixels, then it is considered to be noise-dominated and hence unusable.
| Quadrant | # 1 sec bins | Bins with >0 counts | Bins with >2000 counts | High rate bins dominated by noise | Noise dominated (total time) | Noise dominated (detector-on time) | Marked lightcurve |
|---|---|---|---|---|---|---|---|
| A | 7358 | 5356 | 0 | 0 | 0.00% | 0.00% | 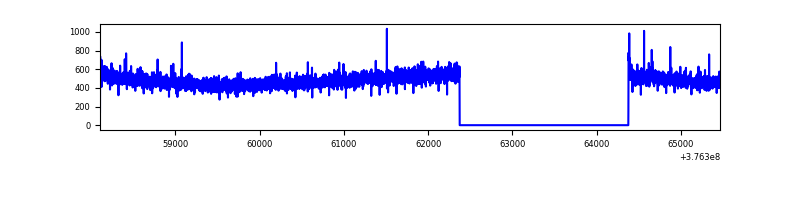 |
| B | 7358 | 5356 | 169 | 169 | 2.30% | 3.16% | 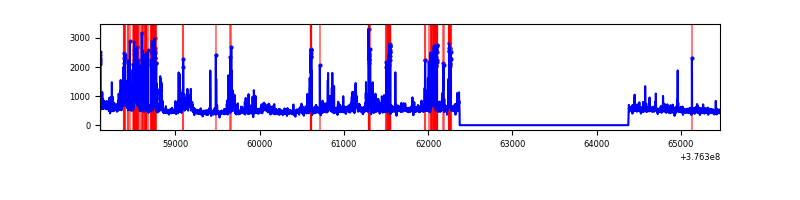 |
| C | 7358 | 5356 | 46 | 46 | 0.63% | 0.86% | 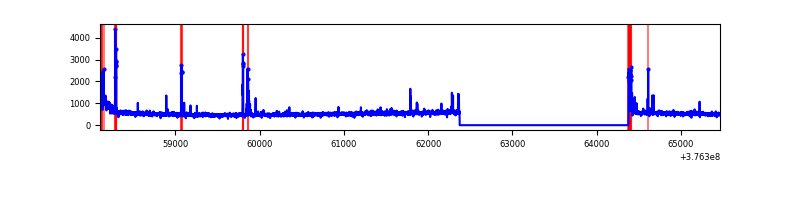 |
| D | 7358 | 5356 | 150 | 150 | 2.04% | 2.80% | 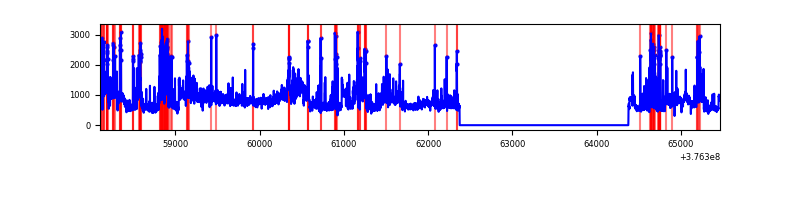 |
Top three noisy pixels from each quadrant. If the there are fewer than three noisy pixels in the level2.evt file, extra rows are filled as -1
| Pixel properties | Quadrant properties | ||||||
|---|---|---|---|---|---|---|---|
| Quadrant | DetID | PixID | Counts | Sigma | Mean | Median | Sigma |
| A | 13 | 6 | 9977 | 71.48 | 658 | 647 | 130.5 |
| A | 13 | 254 | 8307 | 58.68 | 658 | 647 | 130.5 |
| A | 7 | 192 | 7205 | 50.24 | 658 | 647 | 130.5 |
| B | 5 | 172 | 632961 | 5139.01 | 650 | 636 | 123.0 |
| B | 5 | 255 | 151808 | 1228.6 | 650 | 636 | 123.0 |
| B | 0 | 219 | 51712 | 415.1 | 650 | 636 | 123.0 |
| C | 15 | 214 | 233079 | 1598.9 | 633 | 640 | 145.4 |
| C | 0 | 10 | 106414 | 727.6 | 633 | 640 | 145.4 |
| C | 9 | 187 | 94670 | 646.81 | 633 | 640 | 145.4 |
| D | 8 | 195 | 1369558 | 8917.09 | 624 | 608 | 153.5 |
| D | 2 | 250 | 448580 | 2918.01 | 624 | 608 | 153.5 |
| D | 13 | 249 | 172557 | 1120.04 | 624 | 608 | 153.5 |
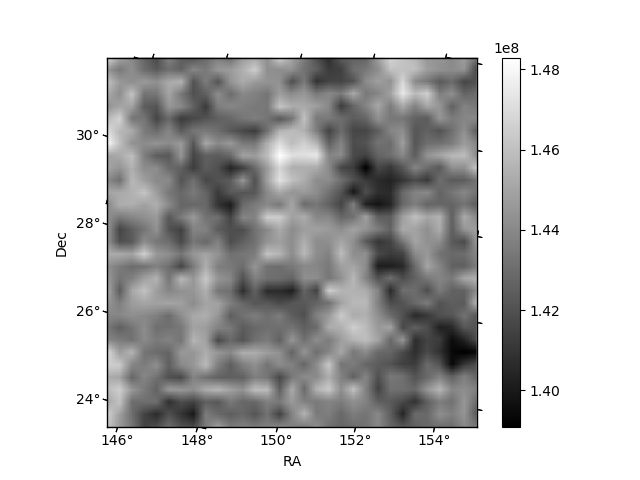
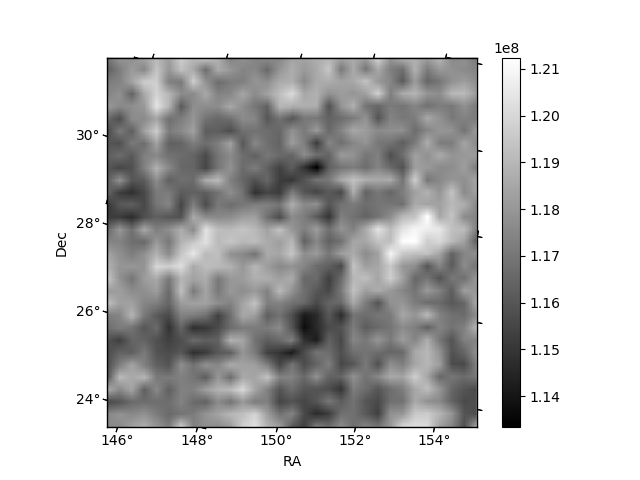
Histogram calculated using DETX and DETY for each event in the final _common_clean file
| Quadrant A |  |
 |
Quadrant B |
|---|---|---|---|
| Quadrant D |  |
 |
Quadrant C |
| Plot type | Count rate plots | Images |
|---|---|---|
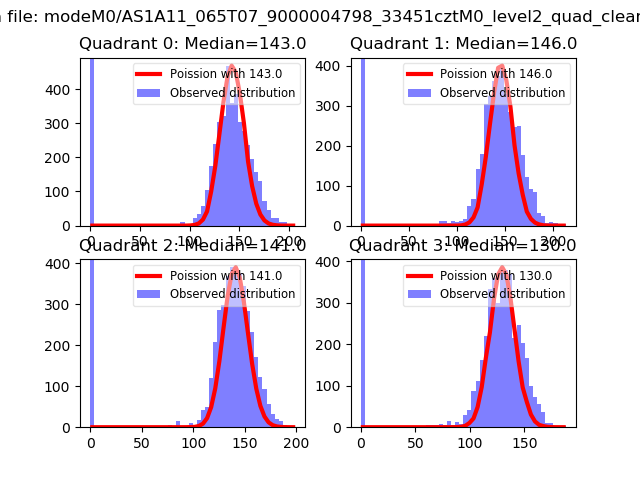
| Comparison with Poisson distribution Blue bars denote a histogram of data divided into 1 sec bins. Red curve is a Poisson curve with rate = median count rate of data. |
 |
 |
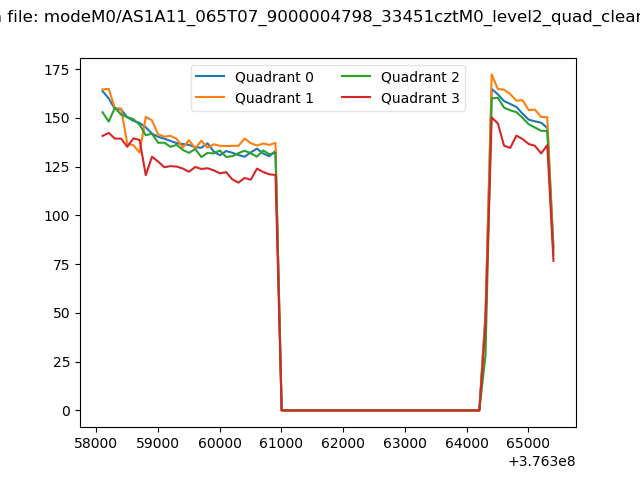
| Quadrant-wise count rates Data is divided into 100 sec bins |
 |
|
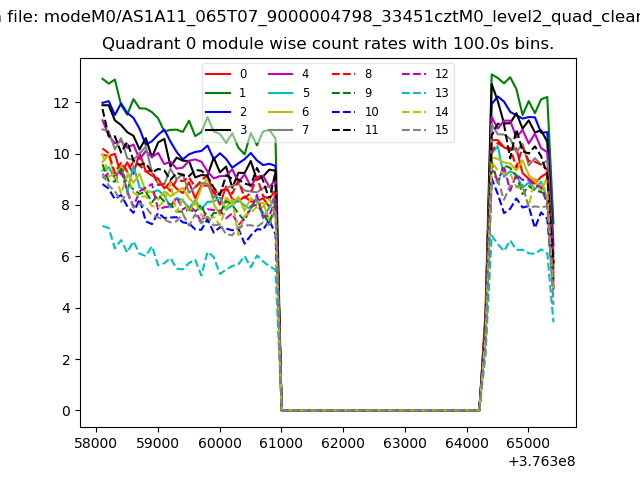
| Module-wise count rates for Quadrant A Data is divided into 100 sec bins |
 |
 |
| Module-wise count rates for Quadrant B Data is divided into 100 sec bins |
 |
 |
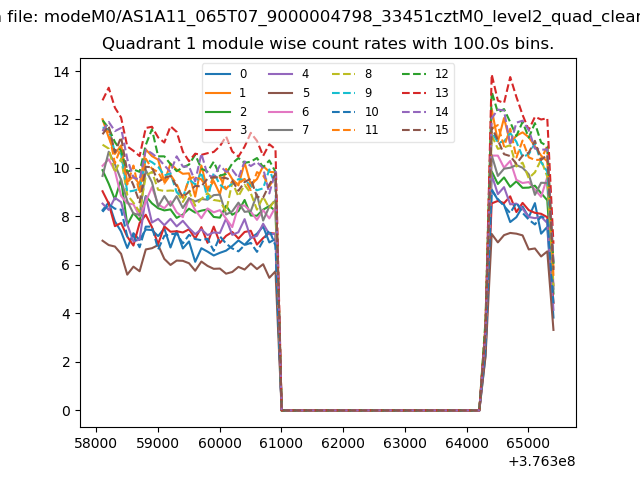
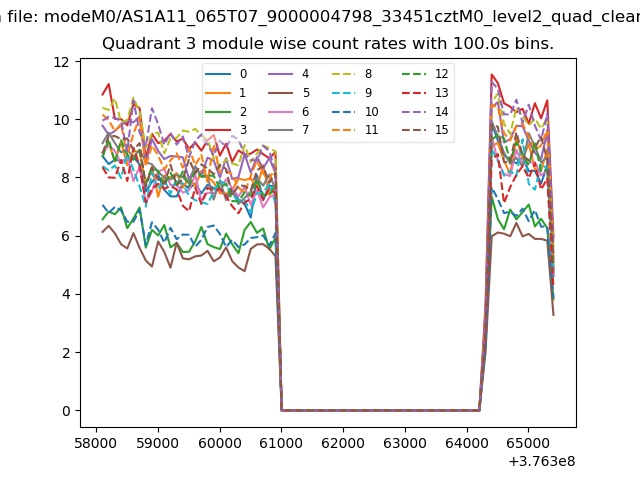
| Module-wise count rates for Quadrant C Data is divided into 100 sec bins |
 |
 |
| Module-wise count rates for Quadrant D Data is divided into 100 sec bins |
 |
 |
| Parameter | Plot |
|---|---|
| CZT HV Monitor | 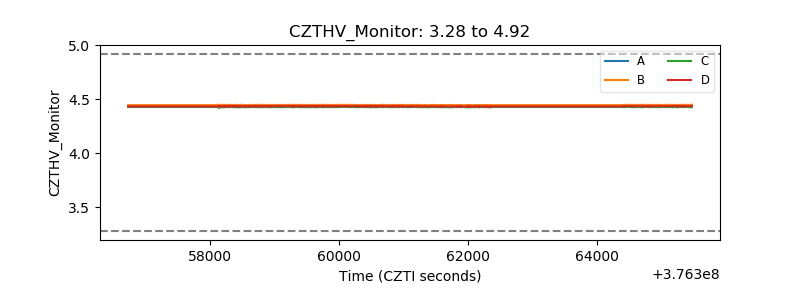 |
| D_VDD | 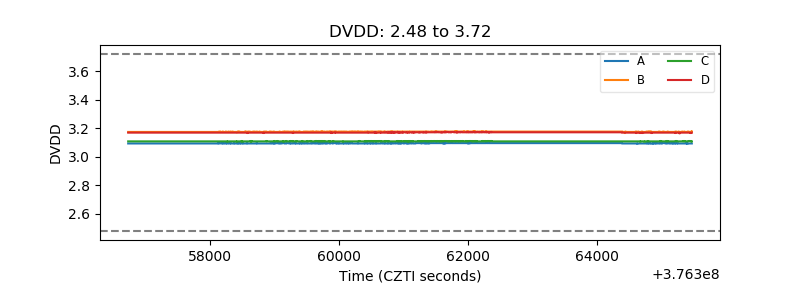 |
| Temperature 1 | 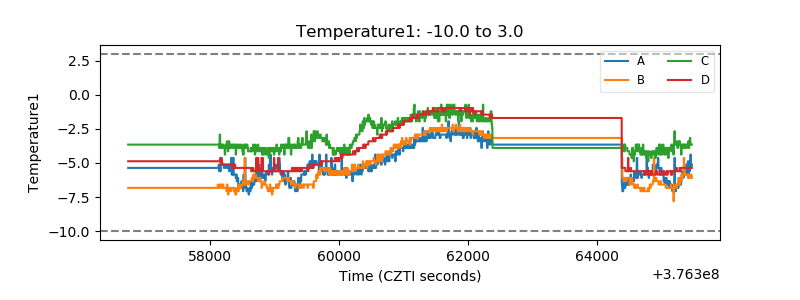 |
| Veto HV Monitor | 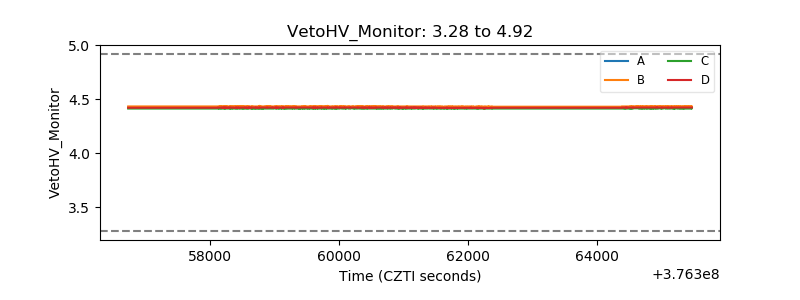 |
| Veto LLD | 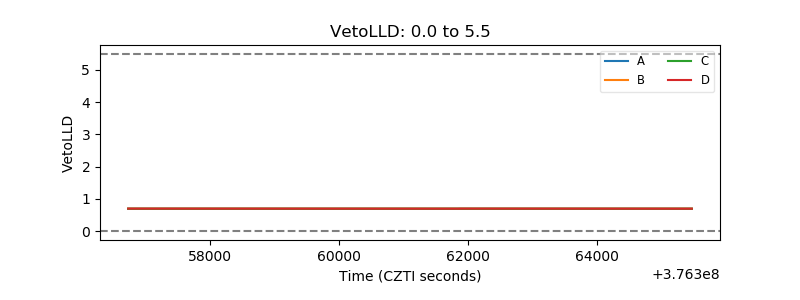 |
| Alpha Counter |  |
| _CPM_Rate |  |
| CZT Counter |  |
| +2.5 Volts monitor |  |
| +5 Volts monitor |  |
| _ROLL_ROT | 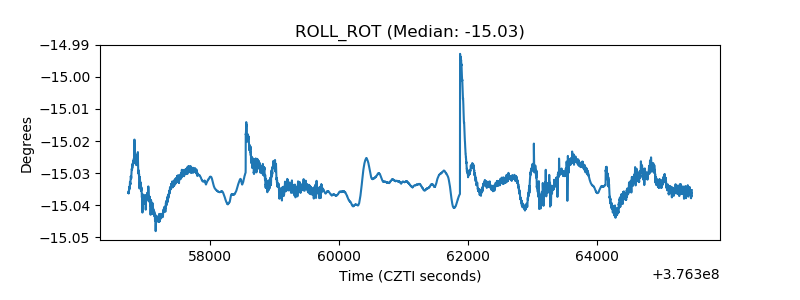 |
| _Roll_DEC | 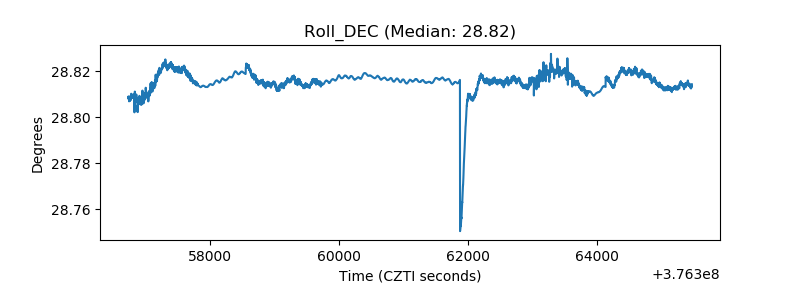 |
| _Roll_RA |  |
| Veto Counter | 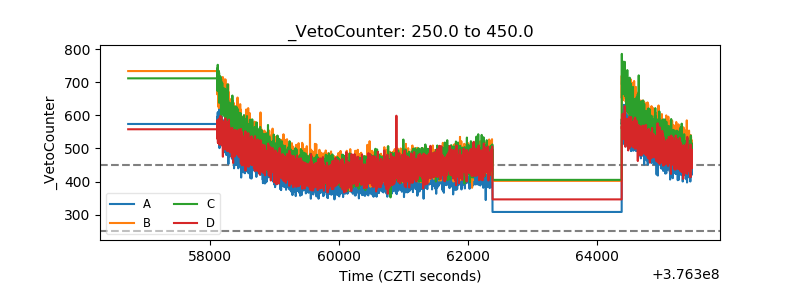 |