| Param | Original file | Final file |
|---|---|---|
| Filename | modeM0/AS1A11_065T07_9000004798_33452cztM0_level2.evt | modeM0/AS1A11_065T07_9000004798_33452cztM0_level2_quad_clean.evt |
| Size (bytes) | 516,769,920 | 78,897,600 |
| Size | 492.8 MB | 75.2 MB |
| Events in quadrant A | 2,549,730 | 518,649 |
| Events in quadrant B | 3,179,884 | 529,972 |
| Events in quadrant C | 5,066,525 | 502,077 |
| Events in quadrant D | 4,498,570 | 470,956 |
| Mode M9 | |||
|---|---|---|---|
| Quadrant | BADHDUFLAG | Total packets | Discarded packets |
| A | 0 | 27 | 0 |
| B | 0 | 27 | 0 |
| C | 0 | 27 | 0 |
| D | 0 | 28 | 0 |
| Mode SS | |||
|---|---|---|---|
| Quadrant | BADHDUFLAG | Total packets | Discarded packets |
| A | 0 | 106 | 0 |
| B | 0 | 106 | 0 |
| C | 0 | 106 | 0 |
| D | 0 | 106 | 0 |
| Mode M0 | |||
|---|---|---|---|
| Quadrant | BADHDUFLAG | Total packets | Discarded packets |
| A | 0 | 10648 | 3 |
| B | 0 | 12630 | 2 |
| C | 0 | 18205 | 2 |
| D | 0 | 17046 | 2 |
| Quadrant | Total seconds | Saturated seconds | Saturation percentage |
|---|---|---|---|
| A | 5252 | 8 | 0.152323% |
| B | 5252 | 147 | 2.798934% |
| C | 5252 | 864 | 16.450876% |
| D | 5252 | 147 | 2.798934% |
Noise dominated data is calculated using 1-second bins in cleaned event files. If a bin has >2000 counts, and if more than 50% of those come from <1% of pixels, then it is considered to be noise-dominated and hence unusable.
| Quadrant | # 1 sec bins | Bins with >0 counts | Bins with >2000 counts | High rate bins dominated by noise | Noise dominated (total time) | Noise dominated (detector-on time) | Marked lightcurve |
|---|---|---|---|---|---|---|---|
| A | 7345 | 5253 | 0 | 0 | 0.00% | 0.00% | 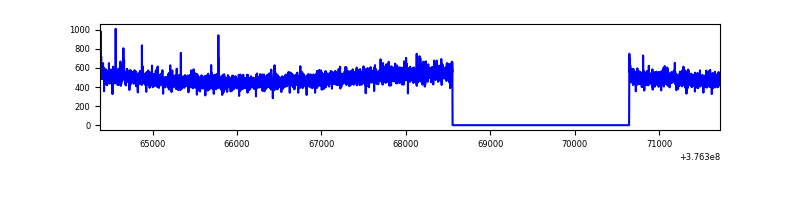 |
| B | 7345 | 5253 | 115 | 115 | 1.57% | 2.19% | 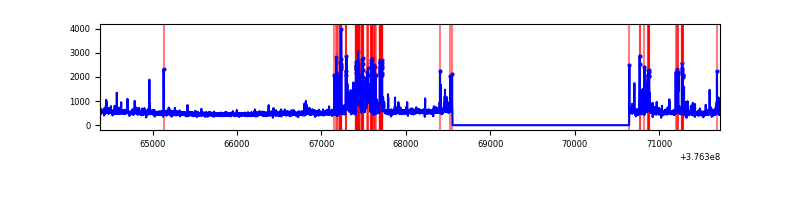 |
| C | 7345 | 5252 | 811 | 811 | 11.04% | 15.44% | 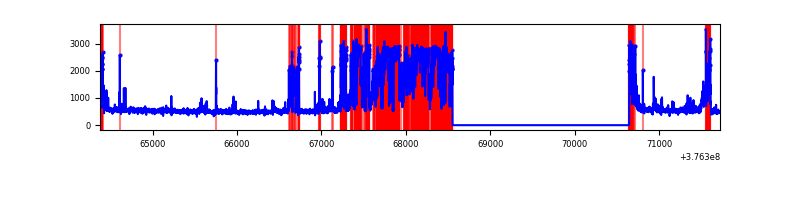 |
| D | 7344 | 5252 | 137 | 137 | 1.87% | 2.61% | 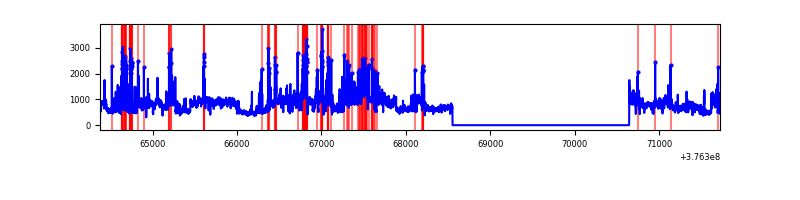 |
Top three noisy pixels from each quadrant. If the there are fewer than three noisy pixels in the level2.evt file, extra rows are filled as -1
| Pixel properties | Quadrant properties | ||||||
|---|---|---|---|---|---|---|---|
| Quadrant | DetID | PixID | Counts | Sigma | Mean | Median | Sigma |
| A | 13 | 254 | 9320 | 66.65 | 654 | 644 | 130.2 |
| A | 13 | 6 | 8939 | 63.73 | 654 | 644 | 130.2 |
| A | 7 | 192 | 6154 | 42.33 | 654 | 644 | 130.2 |
| B | 5 | 172 | 404109 | 3294.31 | 647 | 631 | 122.5 |
| B | 5 | 255 | 129226 | 1049.95 | 647 | 631 | 122.5 |
| B | 4 | 171 | 40645 | 326.71 | 647 | 631 | 122.5 |
| C | 9 | 187 | 2341369 | 17894.15 | 571 | 577 | 130.8 |
| C | 15 | 214 | 212398 | 1619.26 | 571 | 577 | 130.8 |
| C | 0 | 10 | 157481 | 1199.45 | 571 | 577 | 130.8 |
| D | 8 | 195 | 1418107 | 9367.06 | 621 | 604 | 151.3 |
| D | 2 | 250 | 339433 | 2239.03 | 621 | 604 | 151.3 |
| D | 13 | 249 | 160719 | 1058.06 | 621 | 604 | 151.3 |
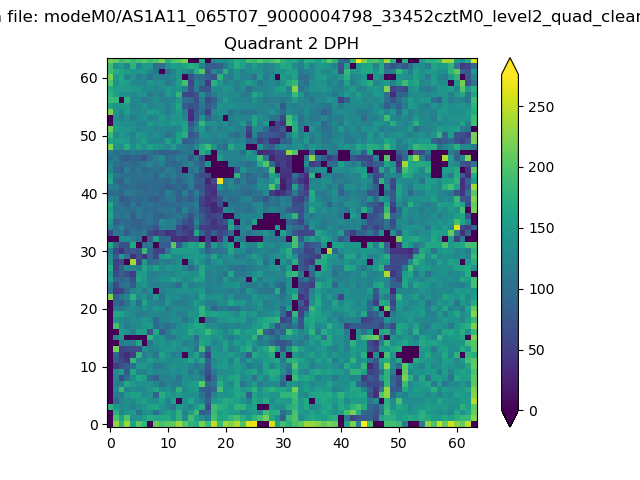
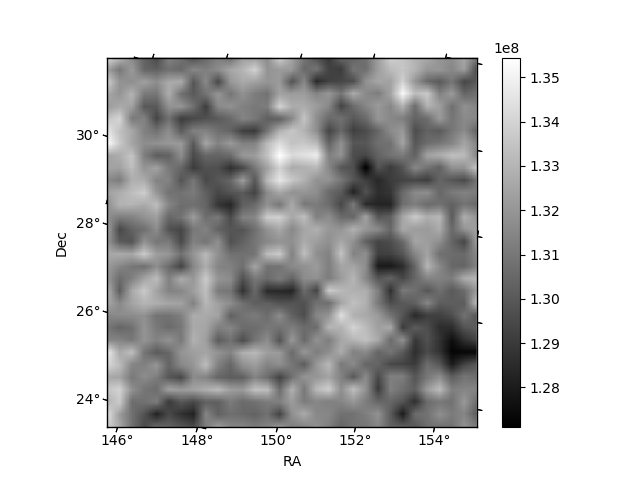
Histogram calculated using DETX and DETY for each event in the final _common_clean file
| Quadrant A | 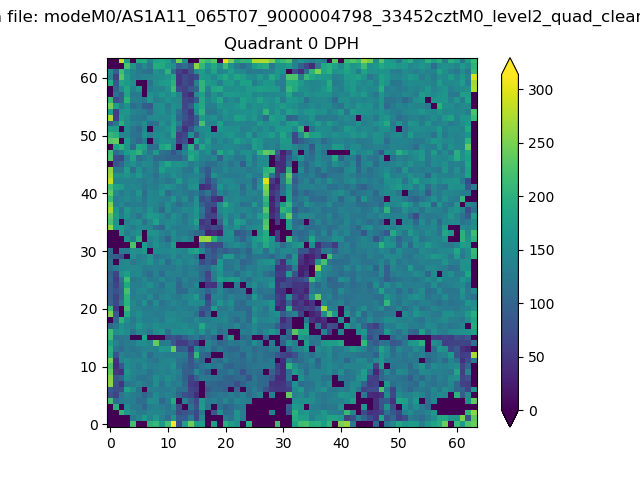 |
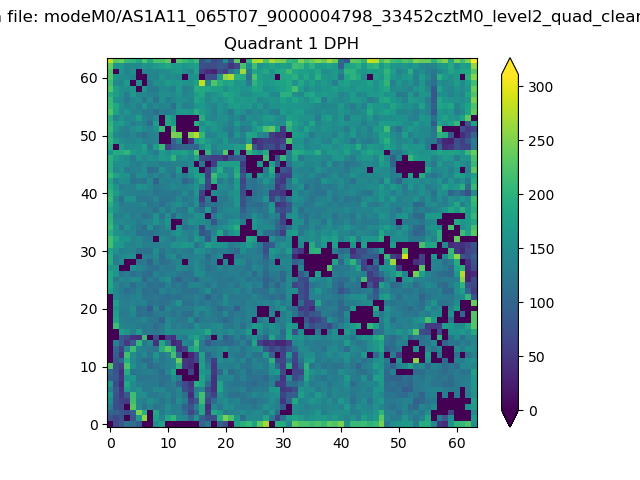 |
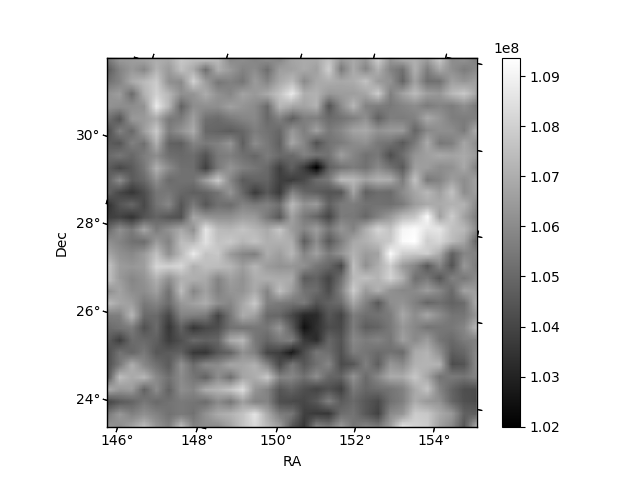
Quadrant B |
|---|---|---|---|
| Quadrant D | 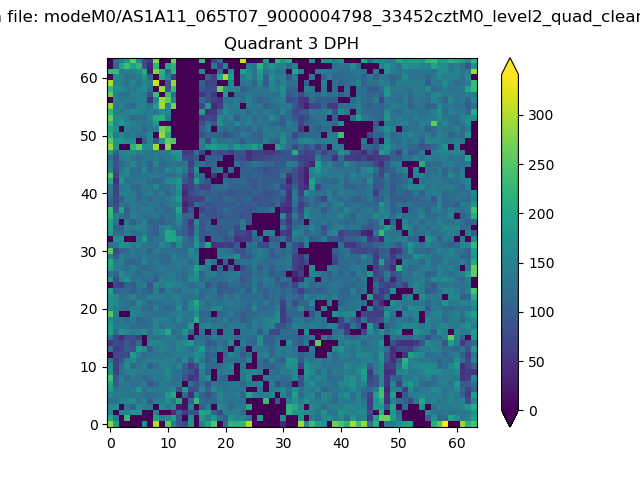 |
 |
Quadrant C |
| Plot type | Count rate plots | Images |
|---|---|---|
| Comparison with Poisson distribution Blue bars denote a histogram of data divided into 1 sec bins. Red curve is a Poisson curve with rate = median count rate of data. |
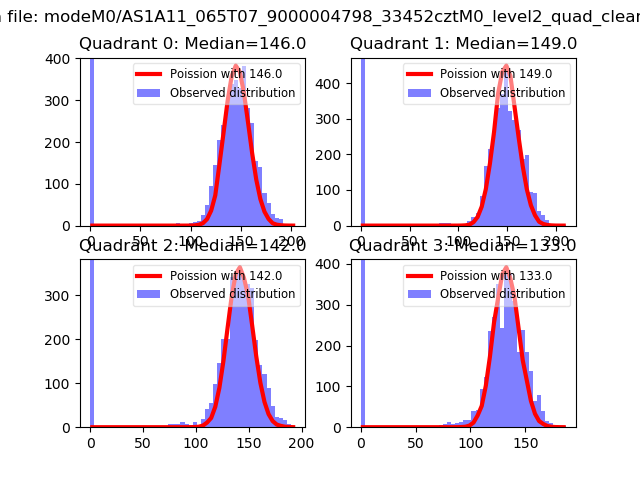 |
 |
| Quadrant-wise count rates Data is divided into 100 sec bins |
 |
|
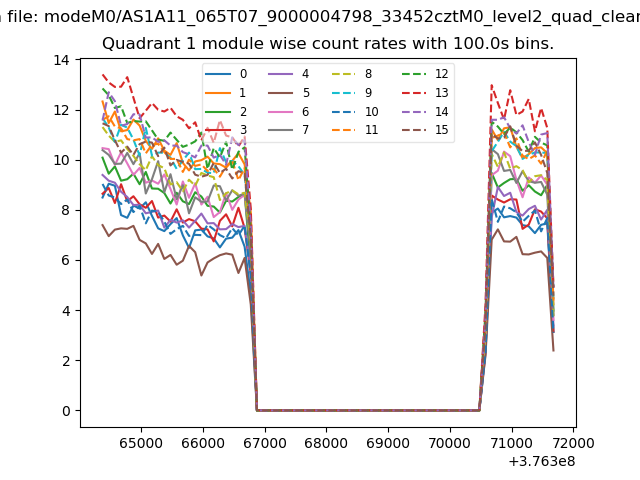
| Module-wise count rates for Quadrant A Data is divided into 100 sec bins |
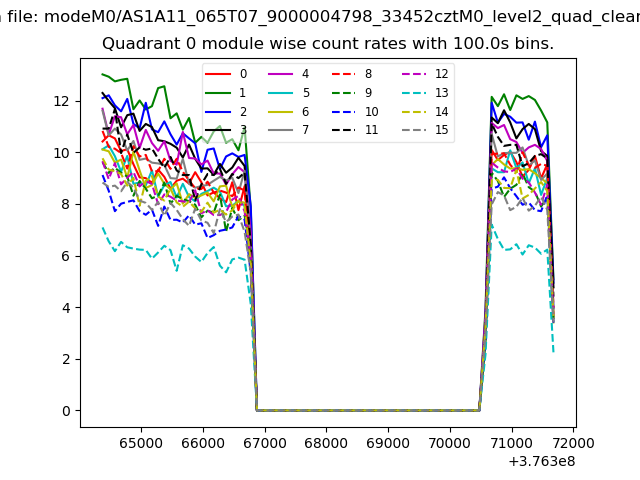 |
 |
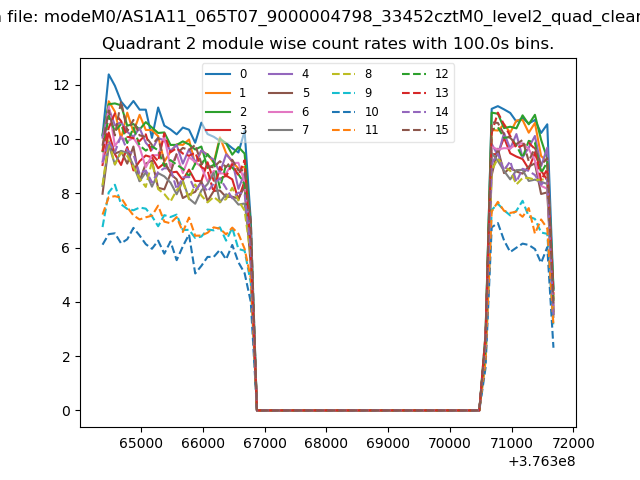
| Module-wise count rates for Quadrant B Data is divided into 100 sec bins |
 |
 |
| Module-wise count rates for Quadrant C Data is divided into 100 sec bins |
 |
 |
| Module-wise count rates for Quadrant D Data is divided into 100 sec bins |
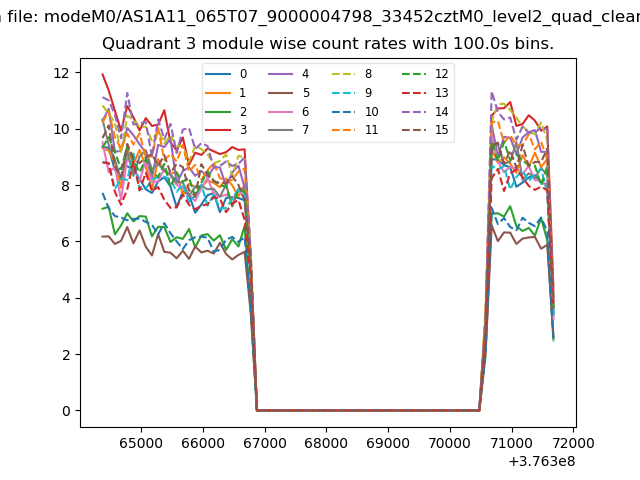 |
 |
| Parameter | Plot |
|---|---|
| CZT HV Monitor | 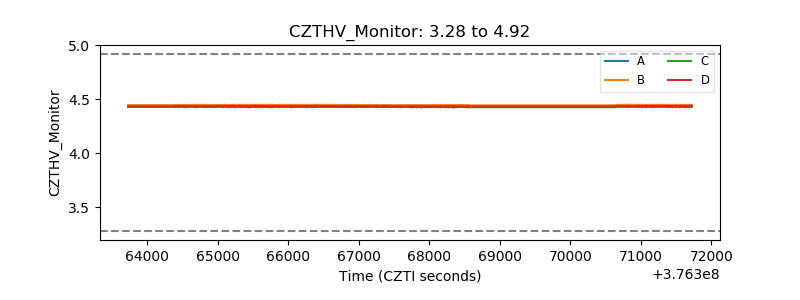 |
| D_VDD | 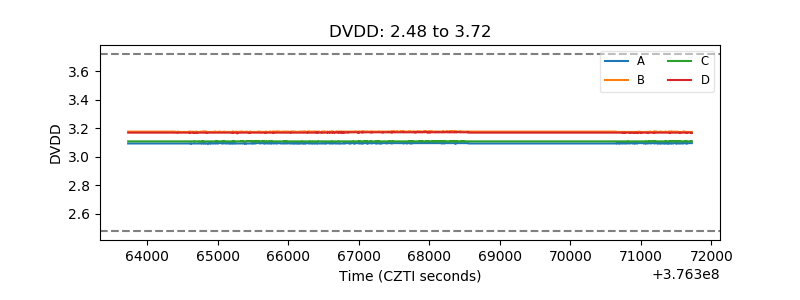 |
| Temperature 1 | 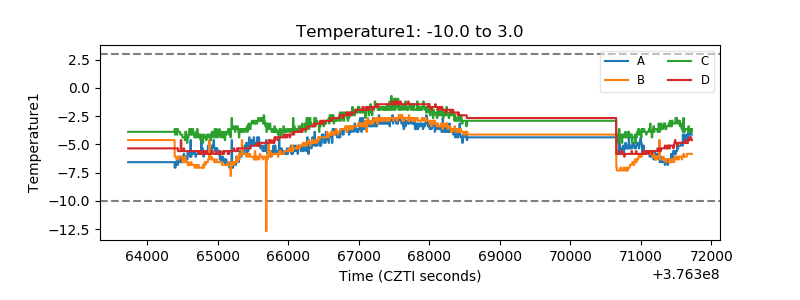 |
| Veto HV Monitor | 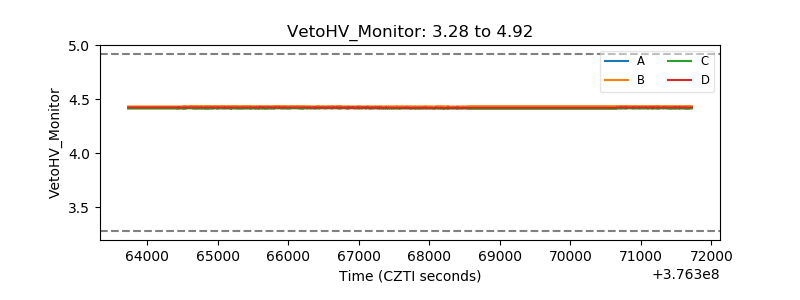 |
| Veto LLD | 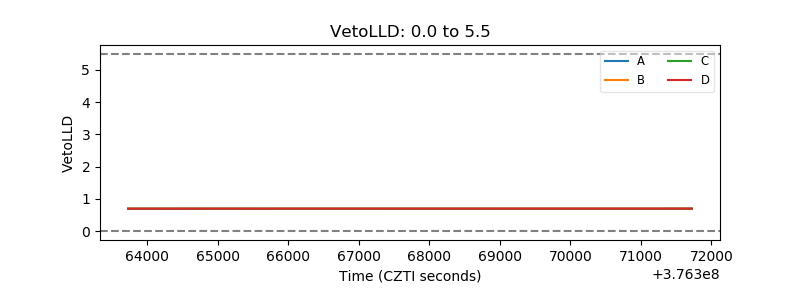 |
| Alpha Counter | 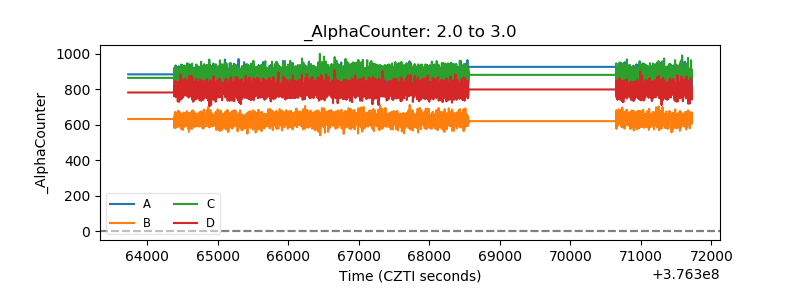 |
| _CPM_Rate | 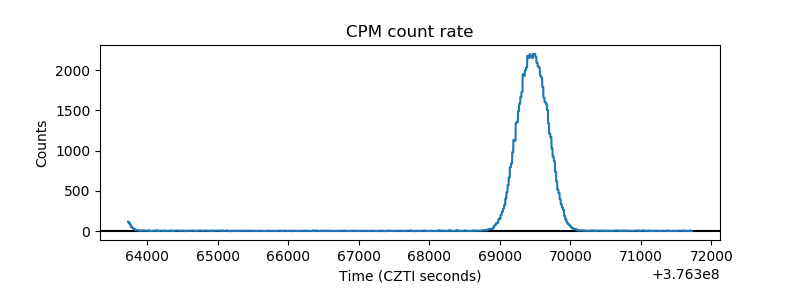 |
| CZT Counter | 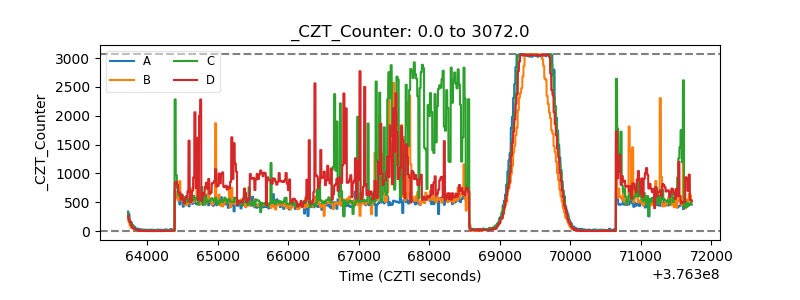 |
| +2.5 Volts monitor | 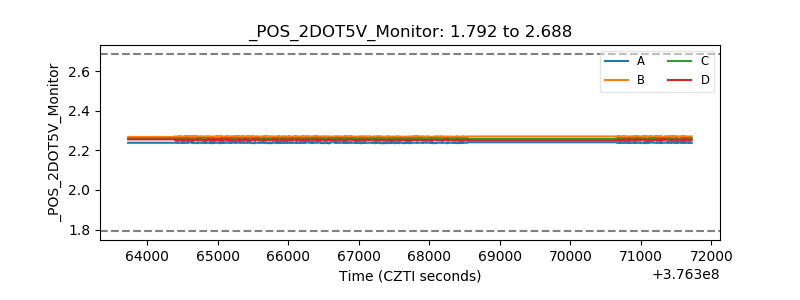 |
| +5 Volts monitor |  |
| _ROLL_ROT | 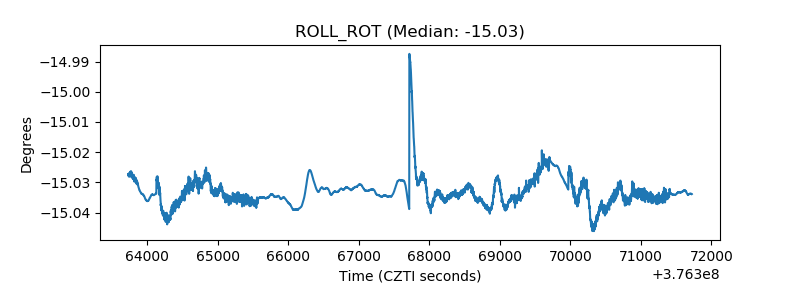 |
| _Roll_DEC | 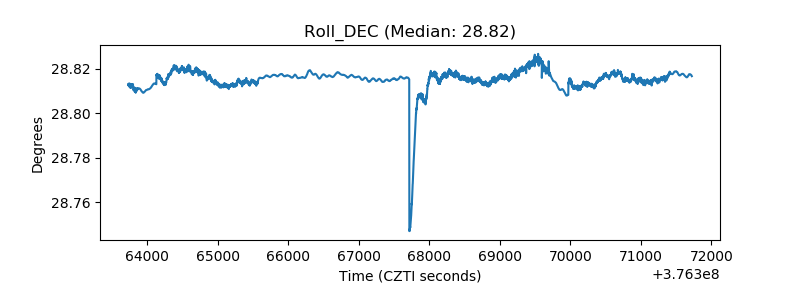 |
| _Roll_RA | 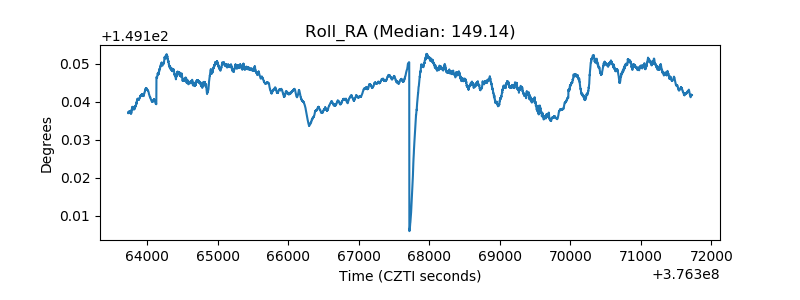 |
| Veto Counter | 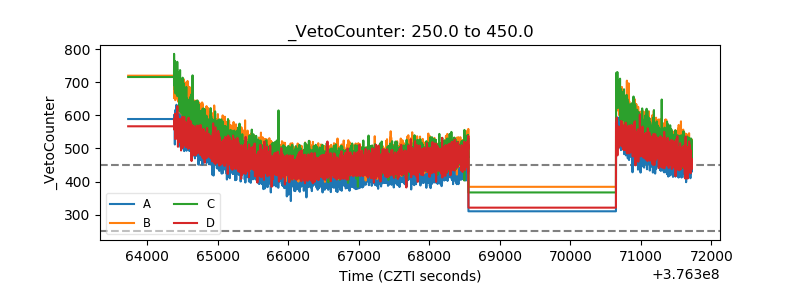 |