| Param | Original file | Final file |
|---|---|---|
| Filename | modeM0/AS1A11_065T07_9000004798_33454cztM0_level2.evt | modeM0/AS1A11_065T07_9000004798_33454cztM0_level2_quad_clean.evt |
| Size (bytes) | 450,809,280 | 59,627,520 |
| Size | 429.9 MB | 56.9 MB |
| Events in quadrant A | 2,364,965 | 376,118 |
| Events in quadrant B | 3,834,265 | 371,920 |
| Events in quadrant C | 2,704,094 | 367,387 |
| Events in quadrant D | 4,413,107 | 342,185 |
| Mode M9 | |||
|---|---|---|---|
| Quadrant | BADHDUFLAG | Total packets | Discarded packets |
| A | 0 | 21 | 0 |
| B | 0 | 21 | 0 |
| C | 0 | 21 | 0 |
| D | 0 | 21 | 0 |
| Mode SS | |||
|---|---|---|---|
| Quadrant | BADHDUFLAG | Total packets | Discarded packets |
| A | 0 | 100 | 0 |
| B | 0 | 100 | 0 |
| C | 0 | 100 | 0 |
| D | 0 | 100 | 0 |
| Mode M0 | |||
|---|---|---|---|
| Quadrant | BADHDUFLAG | Total packets | Discarded packets |
| A | 0 | 9992 | 2 |
| B | 0 | 14600 | 1 |
| C | 0 | 10775 | 1 |
| D | 0 | 16473 | 1 |
| Quadrant | Total seconds | Saturated seconds | Saturation percentage |
|---|---|---|---|
| A | 4962 | 6 | 0.120919% |
| B | 4962 | 415 | 8.363563% |
| C | 4962 | 41 | 0.826280% |
| D | 4962 | 178 | 3.587263% |
Noise dominated data is calculated using 1-second bins in cleaned event files. If a bin has >2000 counts, and if more than 50% of those come from <1% of pixels, then it is considered to be noise-dominated and hence unusable.
| Quadrant | # 1 sec bins | Bins with >0 counts | Bins with >2000 counts | High rate bins dominated by noise | Noise dominated (total time) | Noise dominated (detector-on time) | Marked lightcurve |
|---|---|---|---|---|---|---|---|
| A | 7056 | 4963 | 0 | 0 | 0.00% | 0.00% | 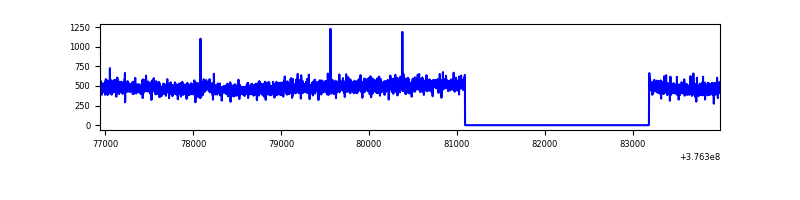 |
| B | 7056 | 4963 | 326 | 326 | 4.62% | 6.57% | 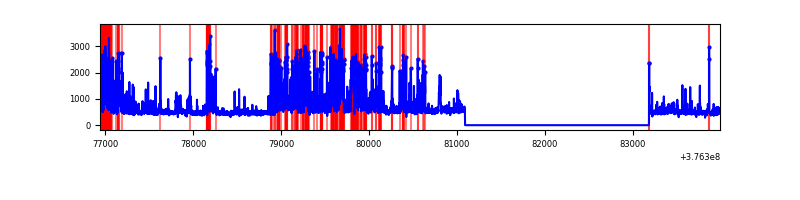 |
| C | 7056 | 4963 | 39 | 39 | 0.55% | 0.79% | 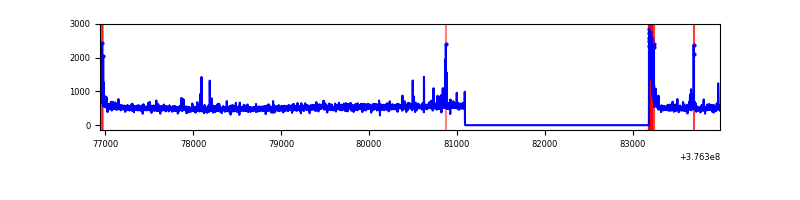 |
| D | 7056 | 4963 | 160 | 160 | 2.27% | 3.22% | 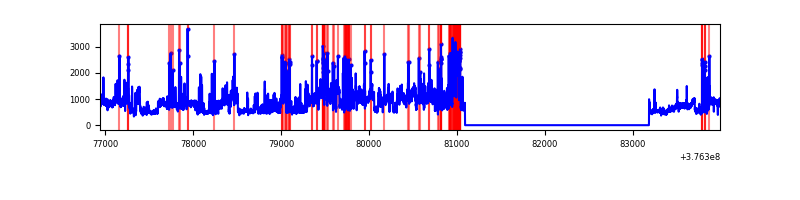 |
Top three noisy pixels from each quadrant. If the there are fewer than three noisy pixels in the level2.evt file, extra rows are filled as -1
| Pixel properties | Quadrant properties | ||||||
|---|---|---|---|---|---|---|---|
| Quadrant | DetID | PixID | Counts | Sigma | Mean | Median | Sigma |
| A | 13 | 6 | 14377 | 113.01 | 608 | 597 | 121.9 |
| A | 13 | 254 | 9158 | 70.21 | 608 | 597 | 121.9 |
| A | 3 | 137 | 5741 | 42.19 | 608 | 597 | 121.9 |
| B | 5 | 172 | 709755 | 6440.67 | 579 | 565 | 110.1 |
| B | 5 | 255 | 471982 | 4281.28 | 579 | 565 | 110.1 |
| B | 4 | 251 | 217697 | 1971.93 | 579 | 565 | 110.1 |
| C | 15 | 214 | 217452 | 1609.74 | 582 | 589 | 134.7 |
| C | 0 | 10 | 133780 | 988.65 | 582 | 589 | 134.7 |
| C | 1 | 23 | 28912 | 210.24 | 582 | 589 | 134.7 |
| D | 8 | 195 | 1388380 | 9711.92 | 576 | 562 | 142.9 |
| D | 2 | 250 | 430153 | 3006.27 | 576 | 562 | 142.9 |
| D | 12 | 233 | 132951 | 926.46 | 576 | 562 | 142.9 |
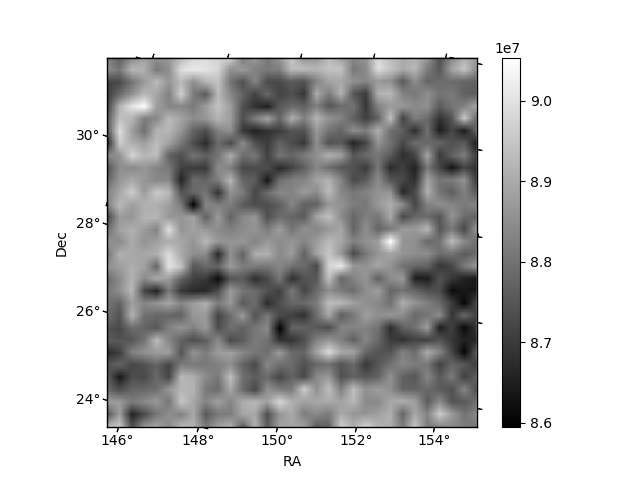
Histogram calculated using DETX and DETY for each event in the final _common_clean file
| Quadrant A | 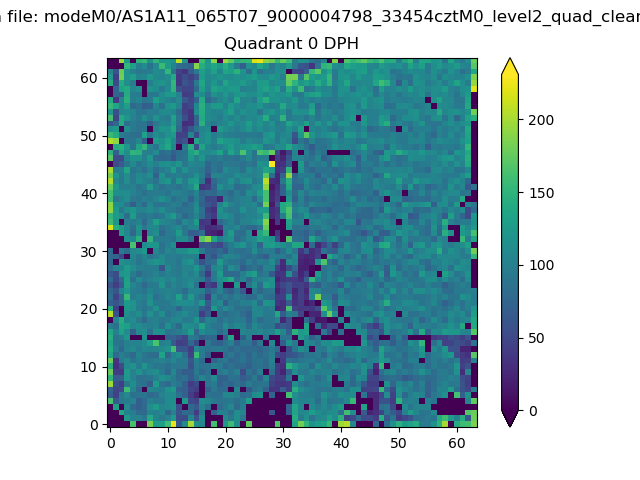 |
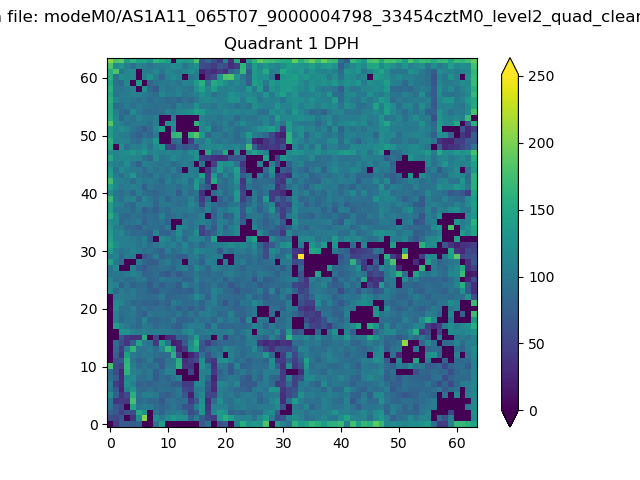 |
Quadrant B |
|---|---|---|---|
| Quadrant D | 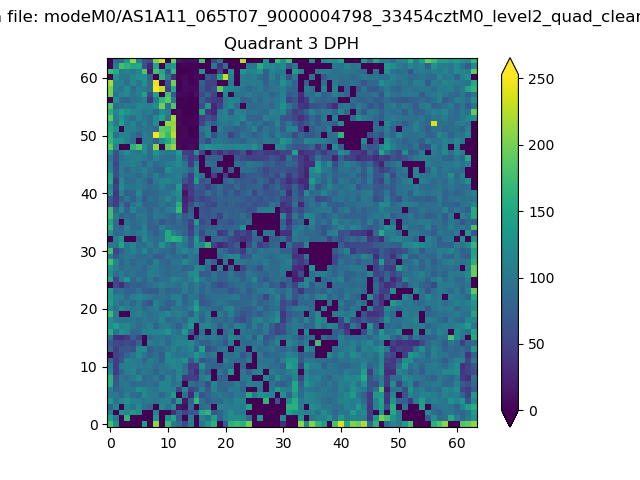 |
 |
Quadrant C |
| Plot type | Count rate plots | Images |
|---|---|---|
| Comparison with Poisson distribution Blue bars denote a histogram of data divided into 1 sec bins. Red curve is a Poisson curve with rate = median count rate of data. |
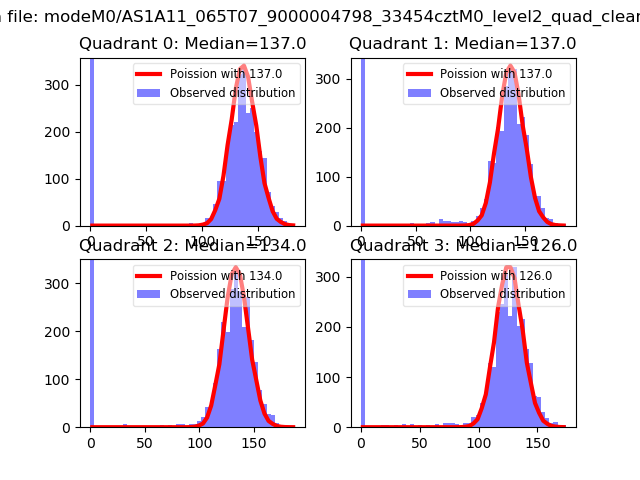 |
 |
| Quadrant-wise count rates Data is divided into 100 sec bins |
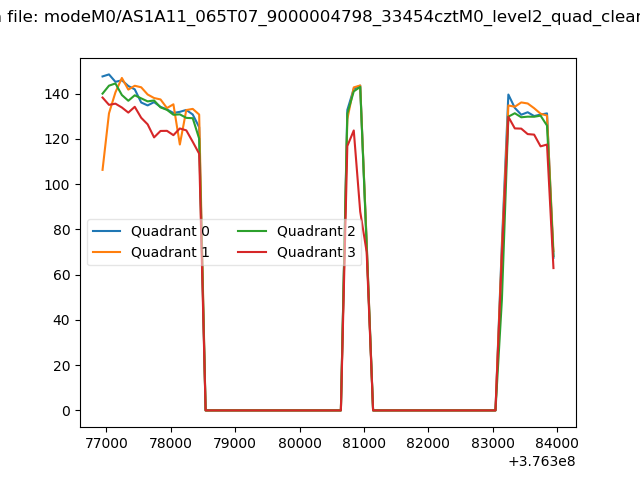 |
|
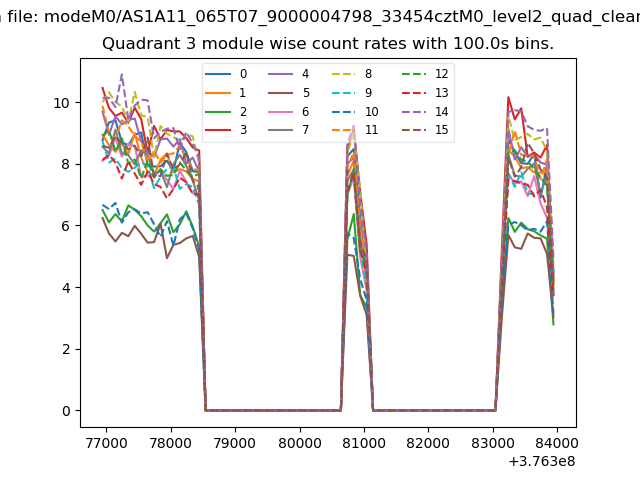
| Module-wise count rates for Quadrant A Data is divided into 100 sec bins |
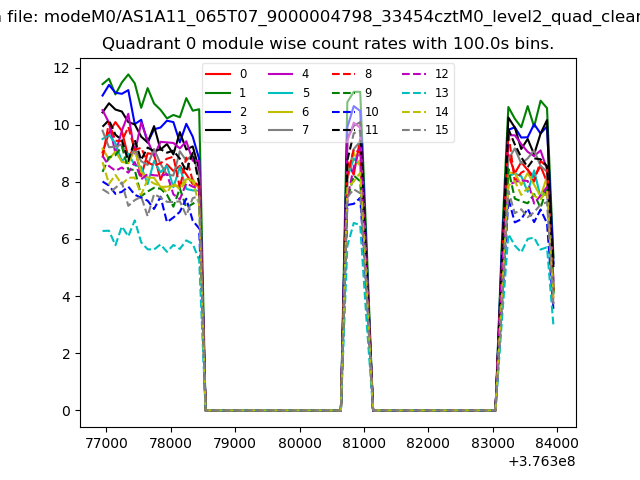 |
 |
| Module-wise count rates for Quadrant B Data is divided into 100 sec bins |
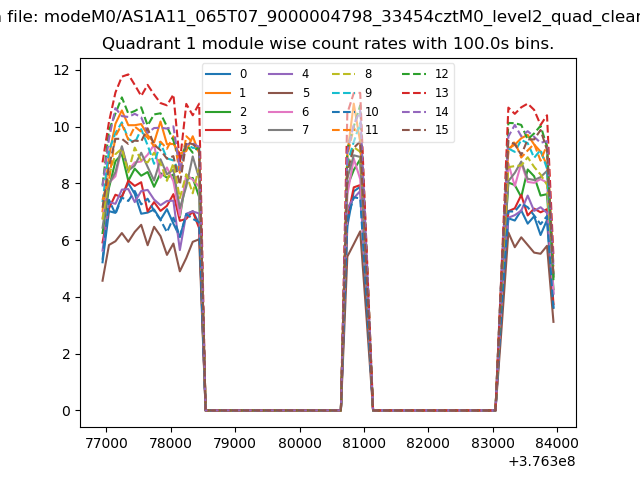 |
 |
| Module-wise count rates for Quadrant C Data is divided into 100 sec bins |
 |
 |
| Module-wise count rates for Quadrant D Data is divided into 100 sec bins |
 |
 |
| Parameter | Plot |
|---|---|
| CZT HV Monitor | 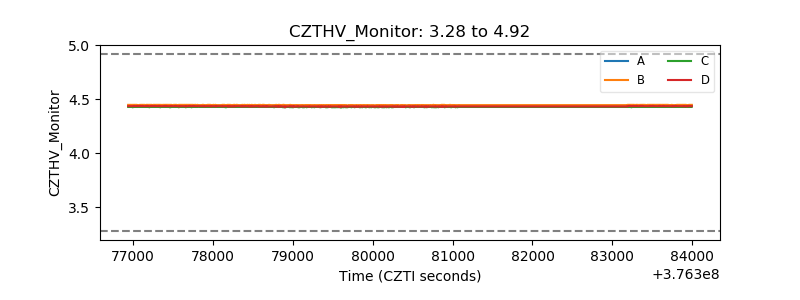 |
| D_VDD | 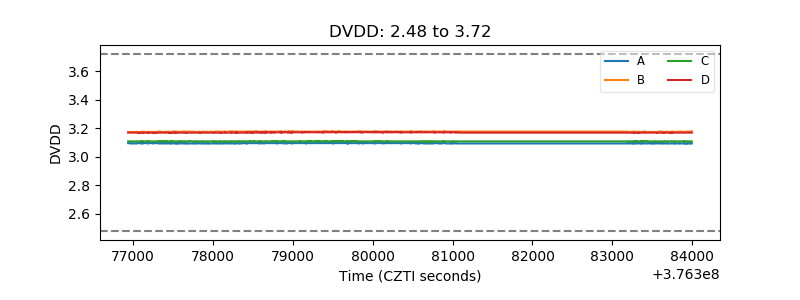 |
| Temperature 1 |  |
| Veto HV Monitor | 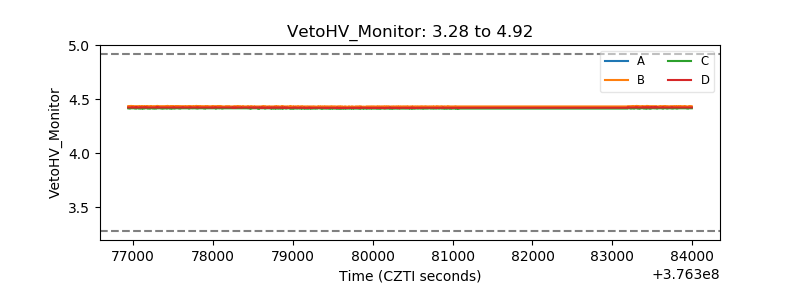 |
| Veto LLD | 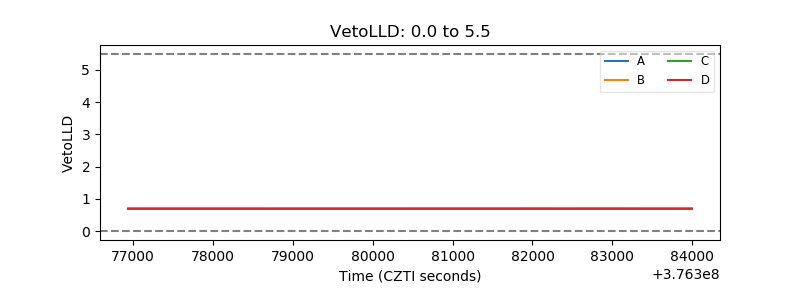 |
| Alpha Counter |  |
| _CPM_Rate | 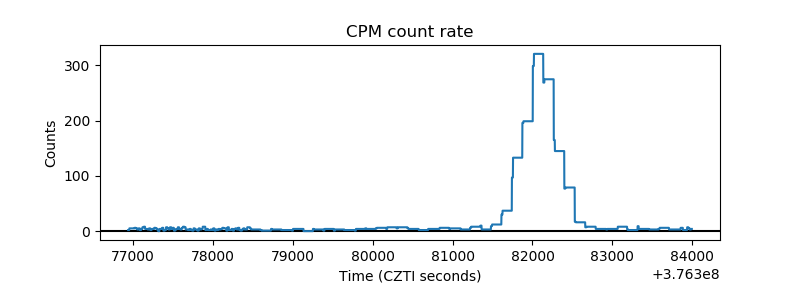 |
| CZT Counter | 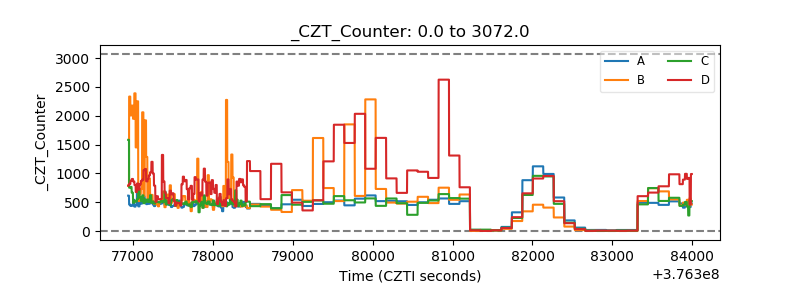 |
| +2.5 Volts monitor |  |
| +5 Volts monitor |  |
| _ROLL_ROT | 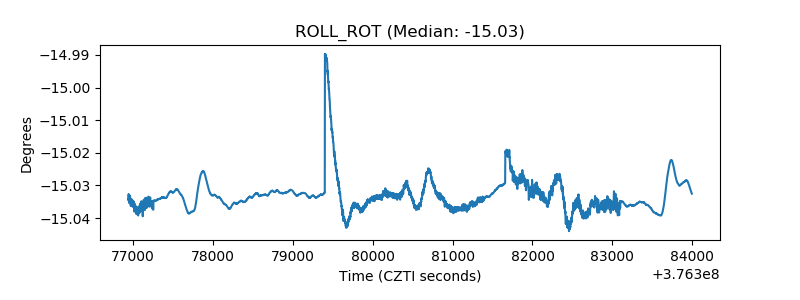 |
| _Roll_DEC | 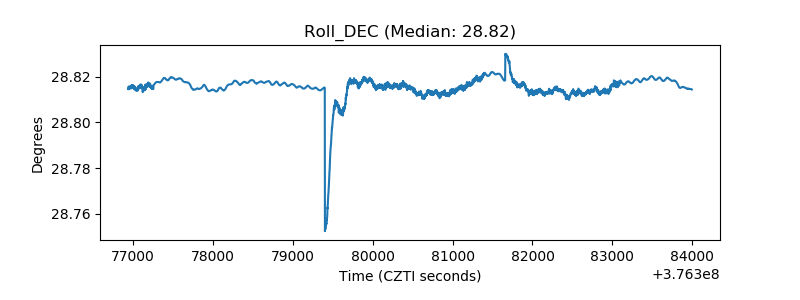 |
| _Roll_RA |  |
| Veto Counter | 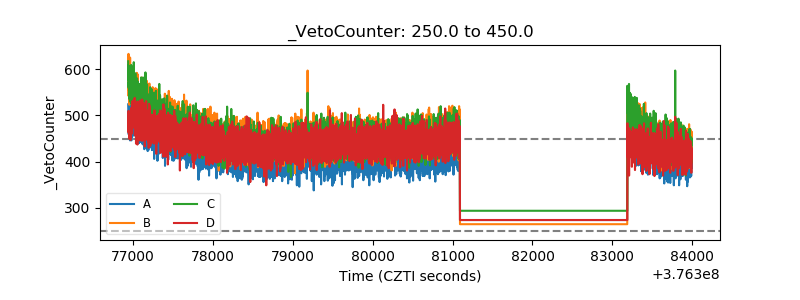 |