| Param | Original file | Final file |
|---|---|---|
| Filename | modeM0/AS1A11_065T07_9000004798_33455cztM0_level2.evt | modeM0/AS1A11_065T07_9000004798_33455cztM0_level2_quad_clean.evt |
| Size (bytes) | 462,481,920 | 61,732,800 |
| Size | 441.1 MB | 58.9 MB |
| Events in quadrant A | 2,439,600 | 385,334 |
| Events in quadrant B | 3,302,604 | 388,698 |
| Events in quadrant C | 3,301,206 | 375,538 |
| Events in quadrant D | 4,608,621 | 353,514 |
| Mode M9 | |||
|---|---|---|---|
| Quadrant | BADHDUFLAG | Total packets | Discarded packets |
| A | 0 | 19 | 0 |
| B | 0 | 19 | 0 |
| C | 0 | 19 | 0 |
| D | 0 | 19 | 0 |
| Mode SS | |||
|---|---|---|---|
| Quadrant | BADHDUFLAG | Total packets | Discarded packets |
| A | 0 | 106 | 0 |
| B | 0 | 106 | 0 |
| C | 0 | 106 | 0 |
| D | 0 | 106 | 0 |
| Mode M0 | |||
|---|---|---|---|
| Quadrant | BADHDUFLAG | Total packets | Discarded packets |
| A | 0 | 10482 | 3 |
| B | 0 | 13059 | 2 |
| C | 0 | 13027 | 2 |
| D | 0 | 17216 | 2 |
| Quadrant | Total seconds | Saturated seconds | Saturation percentage |
|---|---|---|---|
| A | 5225 | 7 | 0.133971% |
| B | 5225 | 158 | 3.023923% |
| C | 5225 | 96 | 1.837321% |
| D | 5226 | 132 | 2.525832% |
Noise dominated data is calculated using 1-second bins in cleaned event files. If a bin has >2000 counts, and if more than 50% of those come from <1% of pixels, then it is considered to be noise-dominated and hence unusable.
| Quadrant | # 1 sec bins | Bins with >0 counts | Bins with >2000 counts | High rate bins dominated by noise | Noise dominated (total time) | Noise dominated (detector-on time) | Marked lightcurve |
|---|---|---|---|---|---|---|---|
| A | 7107 | 5226 | 0 | 0 | 0.00% | 0.00% | 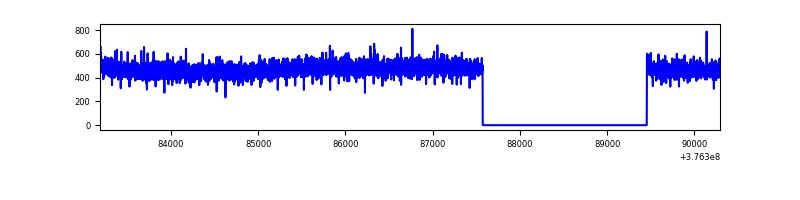 |
| B | 7107 | 5225 | 125 | 125 | 1.76% | 2.39% | 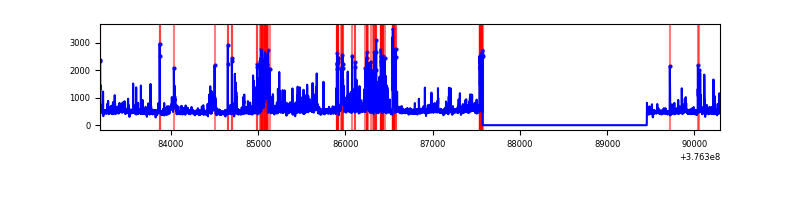 |
| C | 7107 | 5226 | 92 | 92 | 1.29% | 1.76% | 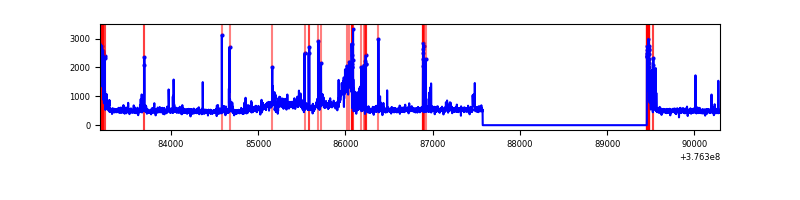 |
| D | 7108 | 5227 | 114 | 114 | 1.60% | 2.18% | 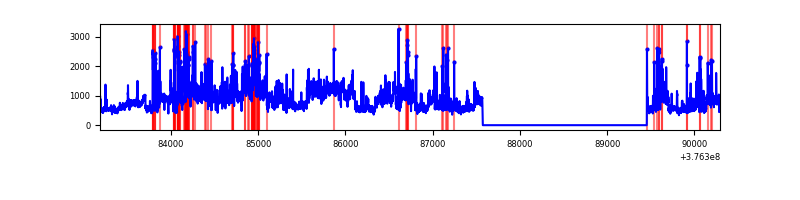 |
Top three noisy pixels from each quadrant. If the there are fewer than three noisy pixels in the level2.evt file, extra rows are filled as -1
| Pixel properties | Quadrant properties | ||||||
|---|---|---|---|---|---|---|---|
| Quadrant | DetID | PixID | Counts | Sigma | Mean | Median | Sigma |
| A | 13 | 6 | 12853 | 97.05 | 627 | 614 | 126.1 |
| A | 13 | 254 | 9387 | 69.56 | 627 | 614 | 126.1 |
| A | 3 | 137 | 6100 | 43.5 | 627 | 614 | 126.1 |
| B | 5 | 172 | 477629 | 4026.75 | 613 | 596 | 118.5 |
| B | 4 | 251 | 152728 | 1284.18 | 613 | 596 | 118.5 |
| B | 5 | 255 | 103590 | 869.4 | 613 | 596 | 118.5 |
| C | 9 | 187 | 479215 | 3449.37 | 598 | 602 | 138.8 |
| C | 15 | 214 | 229464 | 1649.41 | 598 | 602 | 138.8 |
| C | 0 | 10 | 191345 | 1374.69 | 598 | 602 | 138.8 |
| D | 8 | 195 | 1528780 | 10240.02 | 601 | 584 | 149.2 |
| D | 2 | 250 | 396480 | 2652.79 | 601 | 584 | 149.2 |
| D | 12 | 233 | 81804 | 544.23 | 601 | 584 | 149.2 |
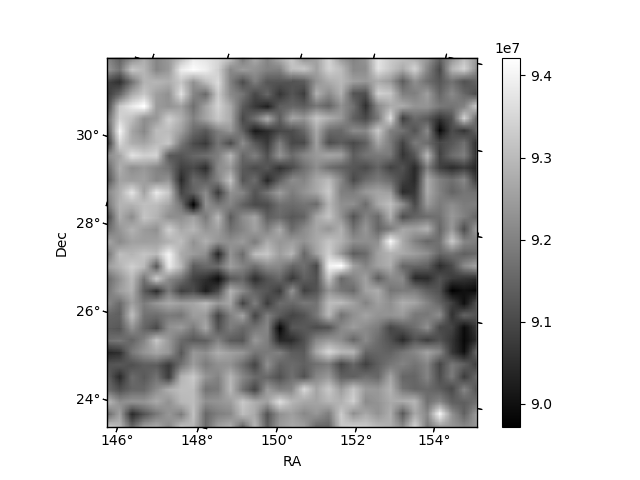
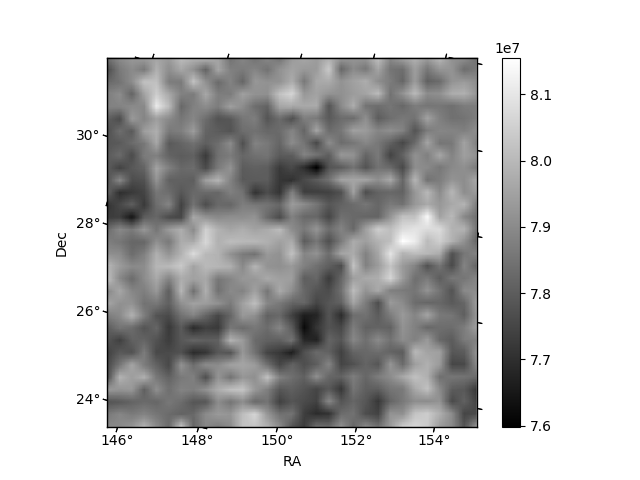
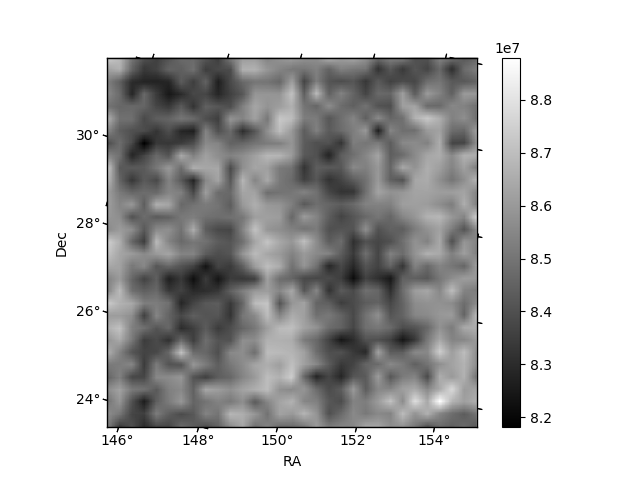
Histogram calculated using DETX and DETY for each event in the final _common_clean file
| Quadrant A | 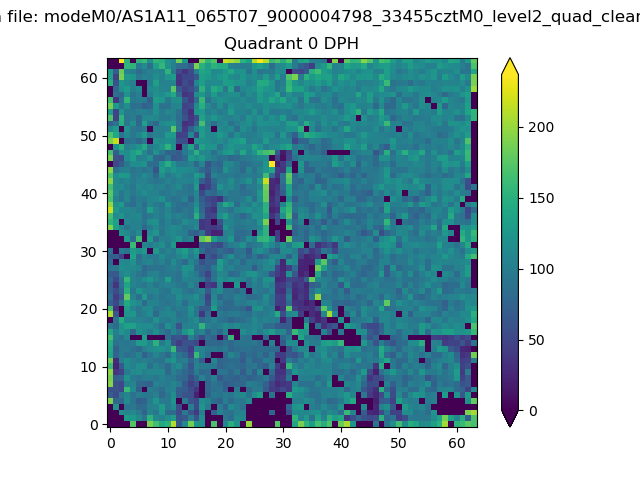 |
 |
Quadrant B |
|---|---|---|---|
| Quadrant D | 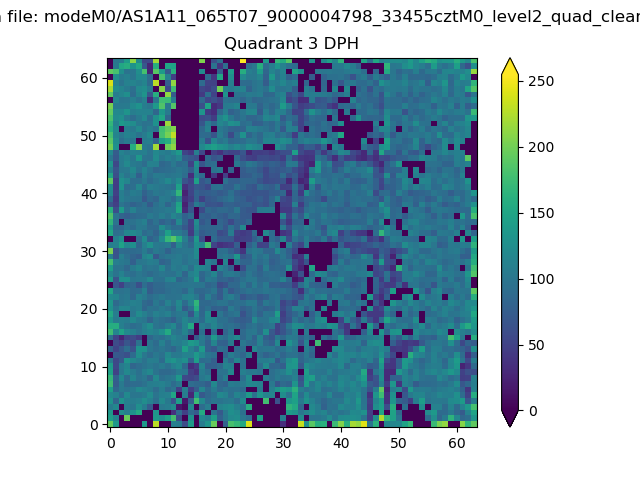 |
 |
Quadrant C |
| Plot type | Count rate plots | Images |
|---|---|---|
| Comparison with Poisson distribution Blue bars denote a histogram of data divided into 1 sec bins. Red curve is a Poisson curve with rate = median count rate of data. |
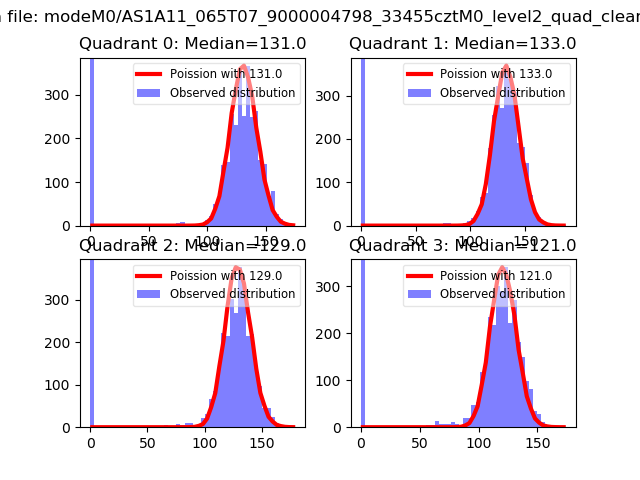 |
 |
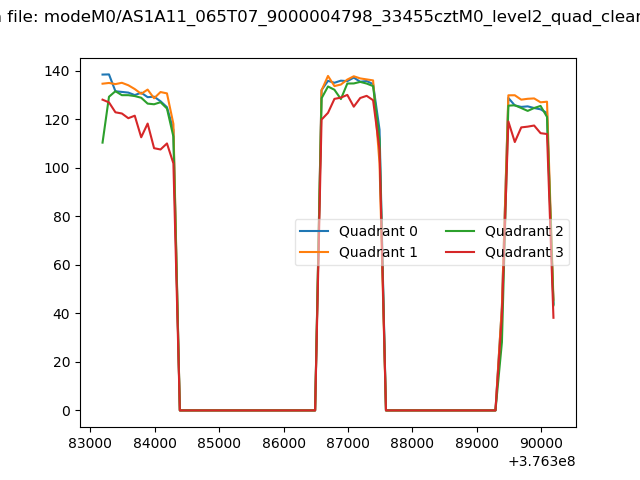
| Quadrant-wise count rates Data is divided into 100 sec bins |
 |
|
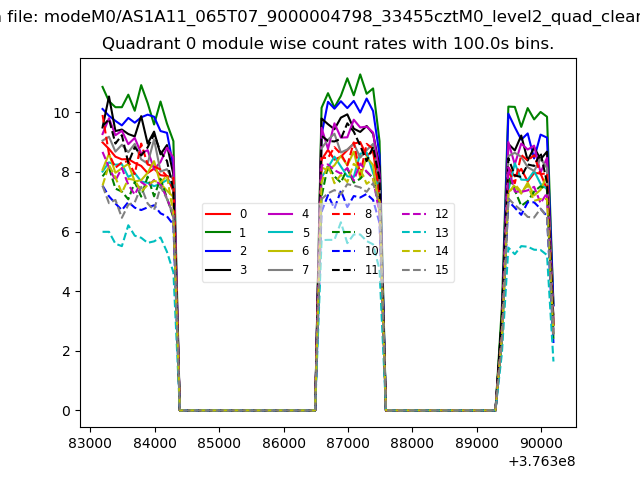
| Module-wise count rates for Quadrant A Data is divided into 100 sec bins |
 |
 |
| Module-wise count rates for Quadrant B Data is divided into 100 sec bins |
 |
 |
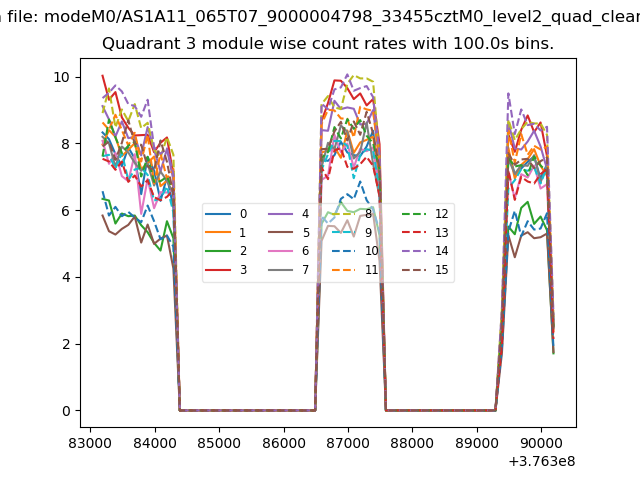
| Module-wise count rates for Quadrant C Data is divided into 100 sec bins |
 |
 |
| Module-wise count rates for Quadrant D Data is divided into 100 sec bins |
 |
 |
| Parameter | Plot |
|---|---|
| CZT HV Monitor | 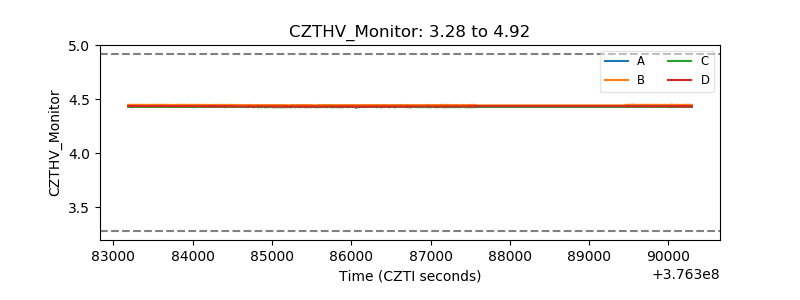 |
| D_VDD | 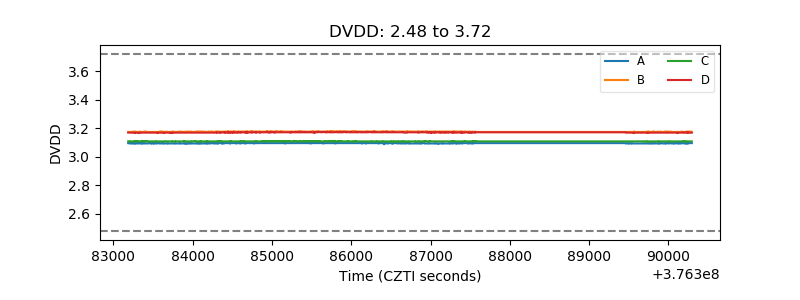 |
| Temperature 1 | 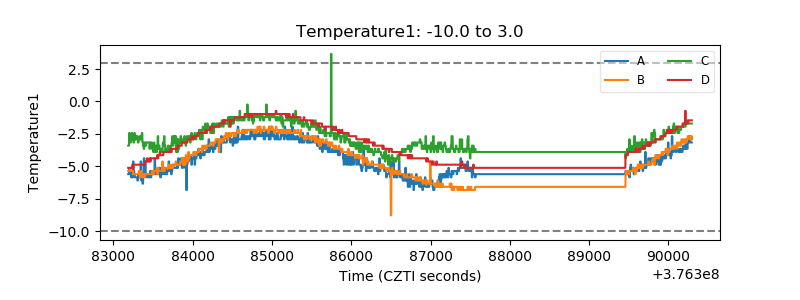 |
| Veto HV Monitor | 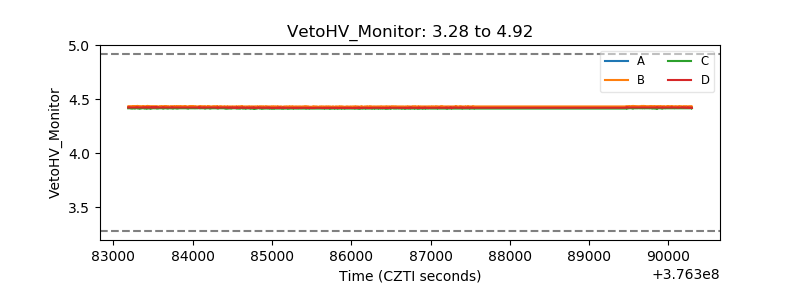 |
| Veto LLD | 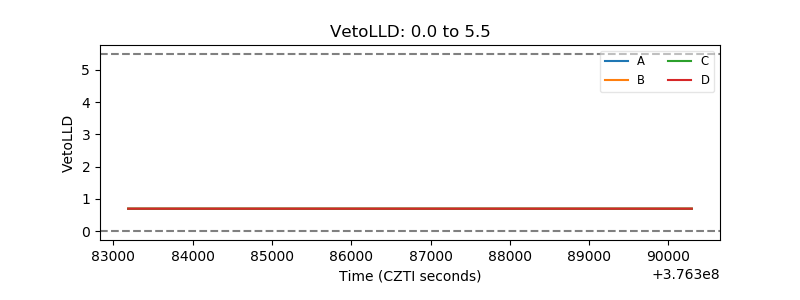 |
| Alpha Counter |  |
| _CPM_Rate | 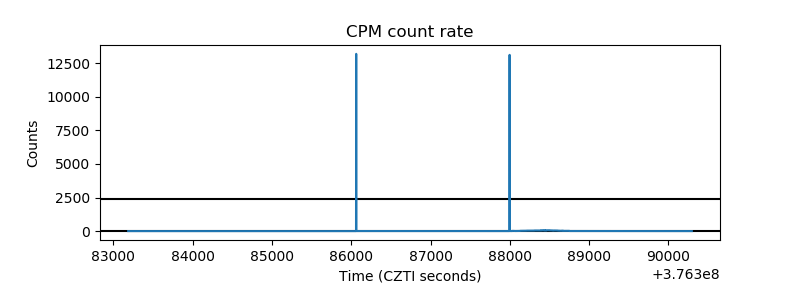 |
| CZT Counter |  |
| +2.5 Volts monitor |  |
| +5 Volts monitor |  |
| _ROLL_ROT | 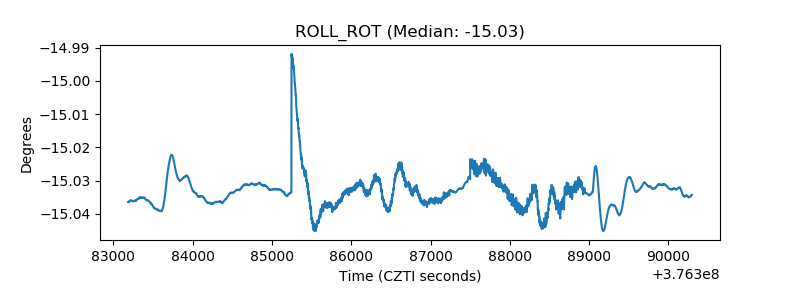 |
| _Roll_DEC | 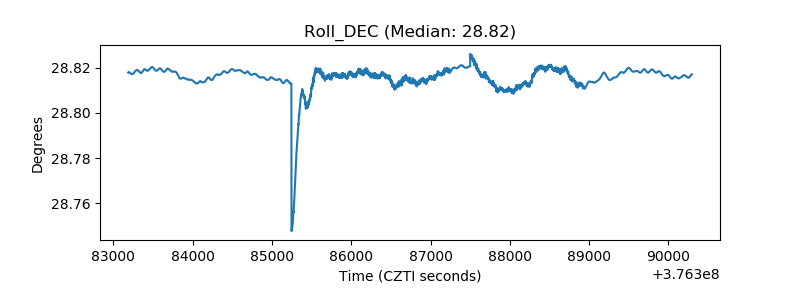 |
| _Roll_RA | 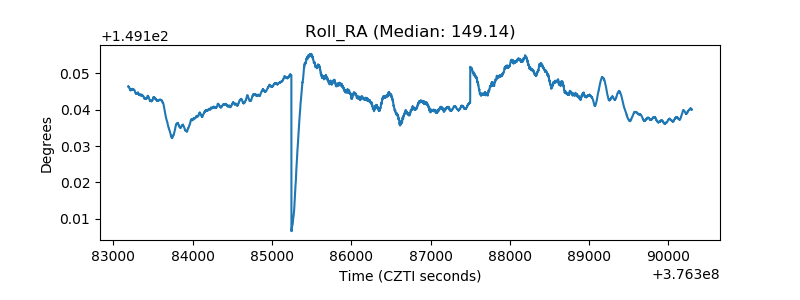 |
| Veto Counter | 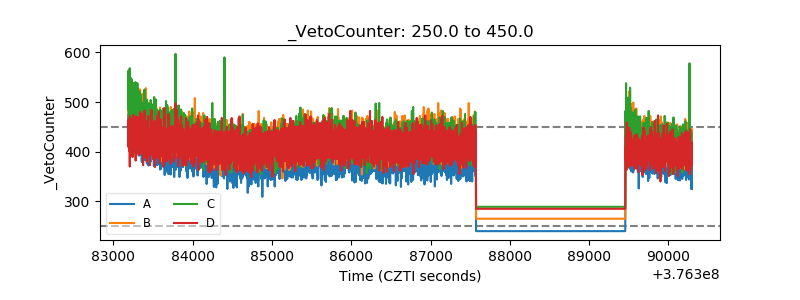 |