| Param | Original file | Final file |
|---|---|---|
| Filename | modeM0/AS1A11_047T10_9000004802_33464cztM0_level2.evt | modeM0/AS1A11_047T10_9000004802_33464cztM0_level2_quad_clean.evt |
| Size (bytes) | 454,268,160 | 86,630,400 |
| Size | 433.2 MB | 82.6 MB |
| Events in quadrant A | 2,475,442 | 578,167 |
| Events in quadrant B | 3,453,144 | 577,121 |
| Events in quadrant C | 2,788,913 | 568,779 |
| Events in quadrant D | 4,683,773 | 531,737 |
| Mode SS | |||
|---|---|---|---|
| Quadrant | BADHDUFLAG | Total packets | Discarded packets |
| A | 0 | 106 | 0 |
| B | 0 | 106 | 0 |
| C | 0 | 106 | 0 |
| D | 0 | 106 | 0 |
| Mode M9 | |||
|---|---|---|---|
| Quadrant | BADHDUFLAG | Total packets | Discarded packets |
| A | 0 | 26 | 0 |
| B | 0 | 26 | 0 |
| C | 0 | 26 | 0 |
| D | 0 | 27 | 0 |
| Mode M0 | |||
|---|---|---|---|
| Quadrant | BADHDUFLAG | Total packets | Discarded packets |
| A | 0 | 10837 | 3 |
| B | 0 | 13725 | 2 |
| C | 0 | 11422 | 2 |
| D | 0 | 17569 | 2 |
| Quadrant | Total seconds | Saturated seconds | Saturation percentage |
|---|---|---|---|
| A | 5255 | 7 | 0.133206% |
| B | 5255 | 264 | 5.023787% |
| C | 5255 | 64 | 1.217888% |
| D | 5255 | 131 | 2.492864% |
Noise dominated data is calculated using 1-second bins in cleaned event files. If a bin has >2000 counts, and if more than 50% of those come from <1% of pixels, then it is considered to be noise-dominated and hence unusable.
| Quadrant | # 1 sec bins | Bins with >0 counts | Bins with >2000 counts | High rate bins dominated by noise | Noise dominated (total time) | Noise dominated (detector-on time) | Marked lightcurve |
|---|---|---|---|---|---|---|---|
| A | 7078 | 5256 | 1 | 1 | 0.01% | 0.02% | 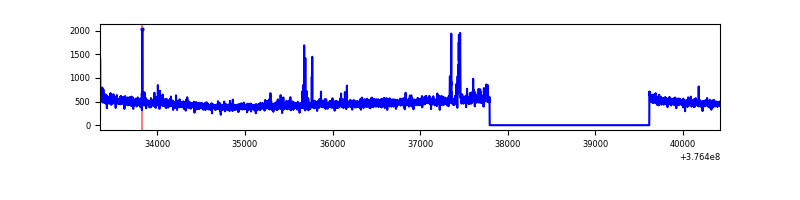 |
| B | 7078 | 5256 | 174 | 174 | 2.46% | 3.31% | 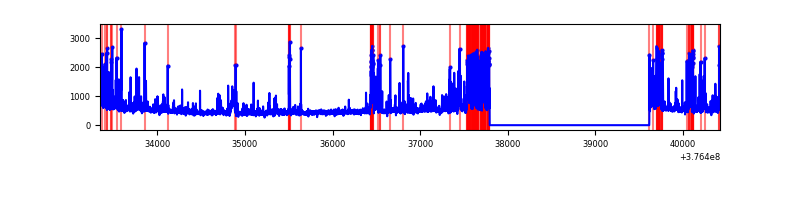 |
| C | 7078 | 5256 | 49 | 49 | 0.69% | 0.93% | 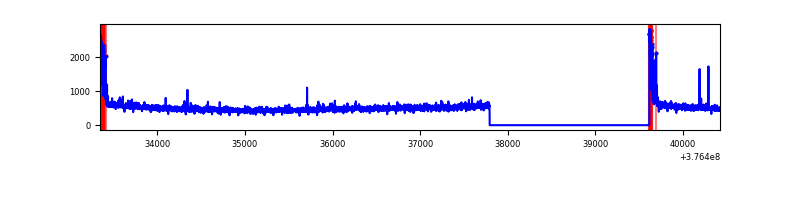 |
| D | 7078 | 5256 | 131 | 131 | 1.85% | 2.49% | 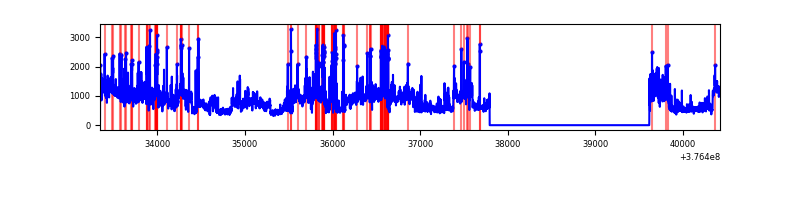 |
Top three noisy pixels from each quadrant. If the there are fewer than three noisy pixels in the level2.evt file, extra rows are filled as -1
| Pixel properties | Quadrant properties | ||||||
|---|---|---|---|---|---|---|---|
| Quadrant | DetID | PixID | Counts | Sigma | Mean | Median | Sigma |
| A | 15 | 169 | 69822 | 562.74 | 615 | 605 | 123.0 |
| A | 7 | 192 | 13394 | 103.98 | 615 | 605 | 123.0 |
| A | 13 | 6 | 12736 | 98.63 | 615 | 605 | 123.0 |
| B | 5 | 172 | 592777 | 5116.75 | 608 | 592 | 115.7 |
| B | 5 | 255 | 196349 | 1691.43 | 608 | 592 | 115.7 |
| B | 0 | 230 | 80816 | 693.17 | 608 | 592 | 115.7 |
| C | 15 | 214 | 227561 | 1649.59 | 597 | 601 | 137.6 |
| C | 0 | 10 | 177627 | 1286.66 | 597 | 601 | 137.6 |
| C | 14 | 67 | 30909 | 220.28 | 597 | 601 | 137.6 |
| D | 8 | 195 | 1727507 | 12081.85 | 588 | 571 | 142.9 |
| D | 2 | 250 | 267245 | 1865.68 | 588 | 571 | 142.9 |
| D | 12 | 6 | 176091 | 1227.96 | 588 | 571 | 142.9 |
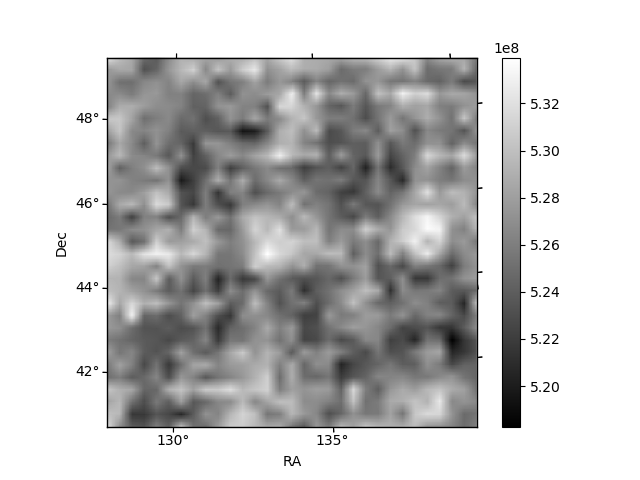
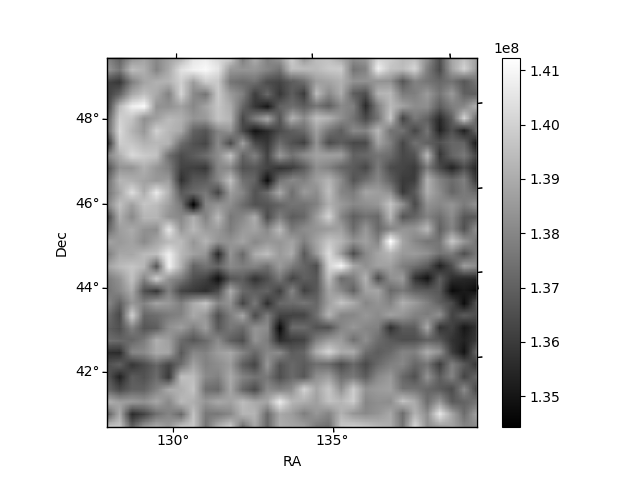
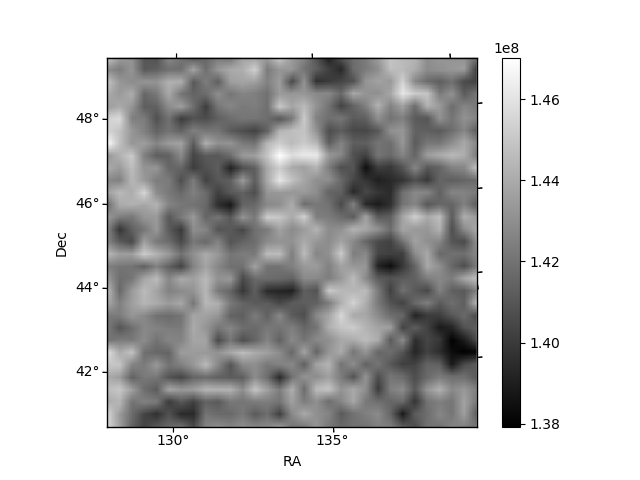
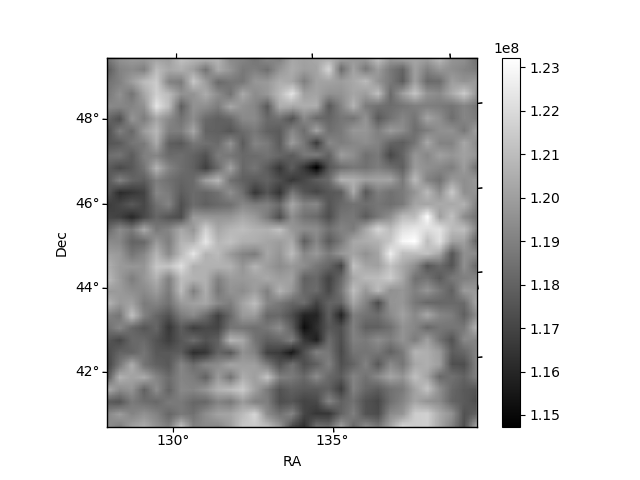
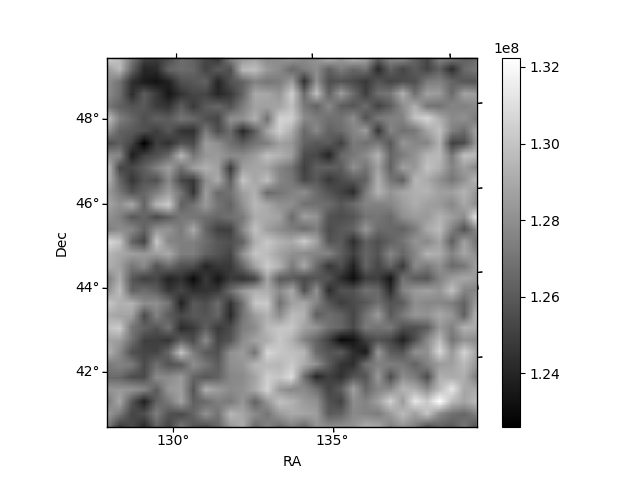
Histogram calculated using DETX and DETY for each event in the final _common_clean file
| Quadrant A | 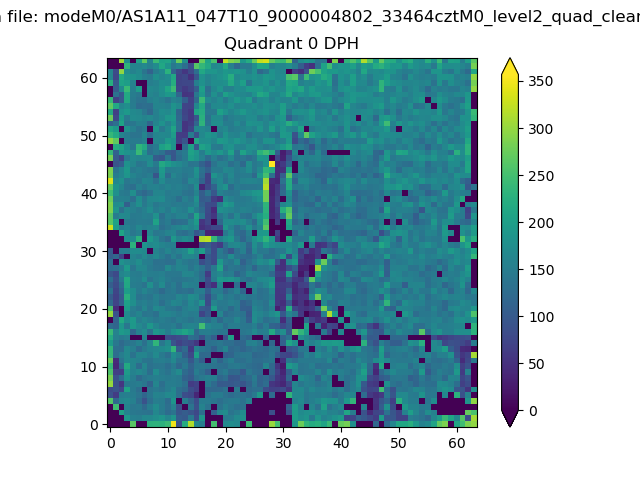 |
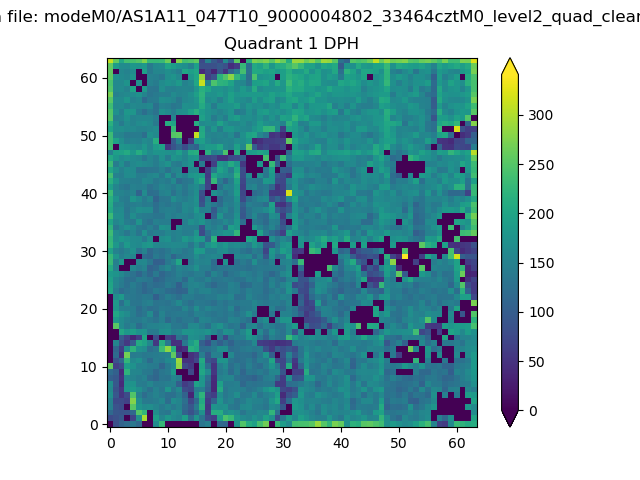 |
Quadrant B |
|---|---|---|---|
| Quadrant D | 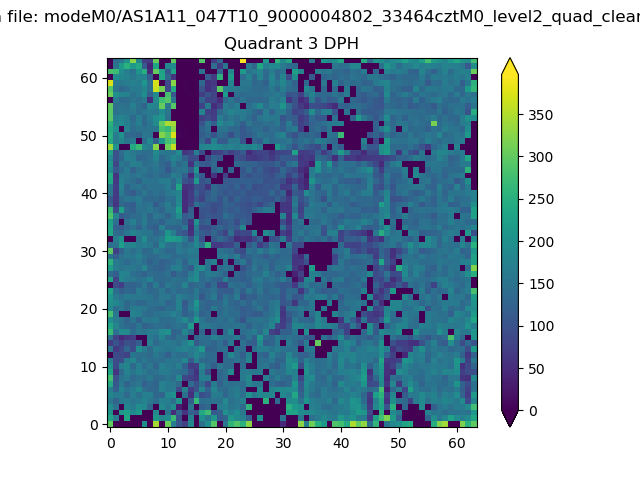 |
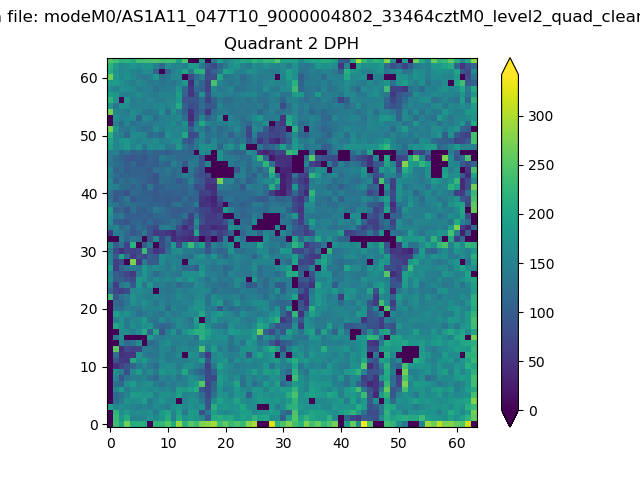 |
Quadrant C |
| Plot type | Count rate plots | Images |
|---|---|---|
| Comparison with Poisson distribution Blue bars denote a histogram of data divided into 1 sec bins. Red curve is a Poisson curve with rate = median count rate of data. |
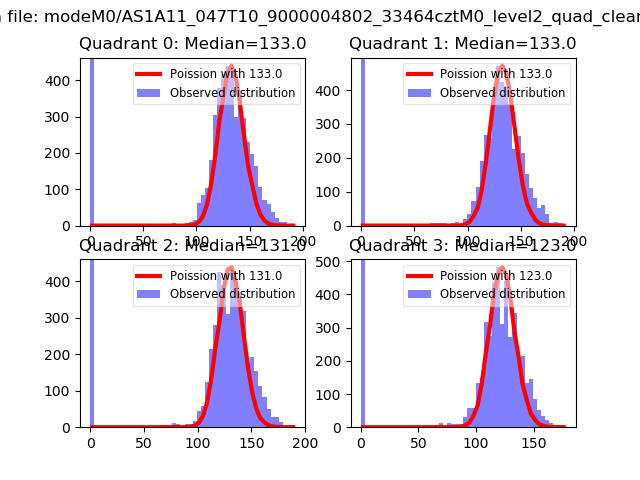 |
 |
| Quadrant-wise count rates Data is divided into 100 sec bins |
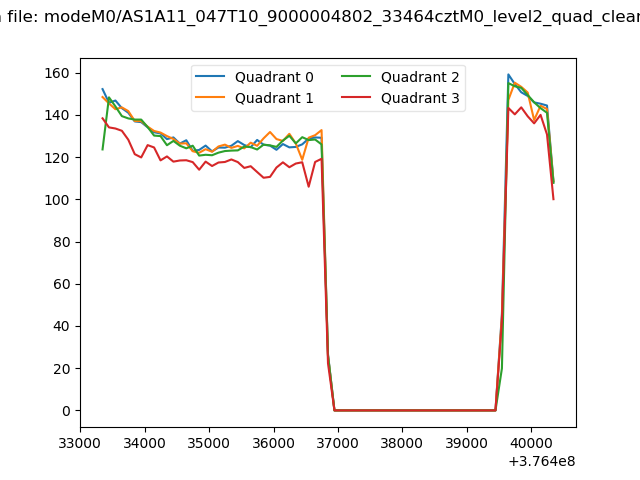 |
|
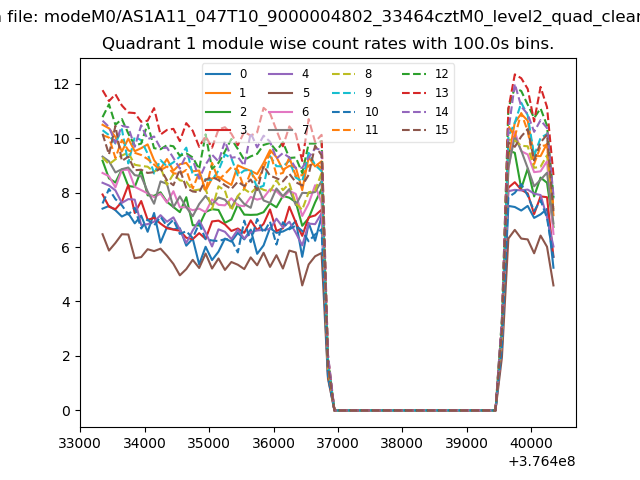
| Module-wise count rates for Quadrant A Data is divided into 100 sec bins |
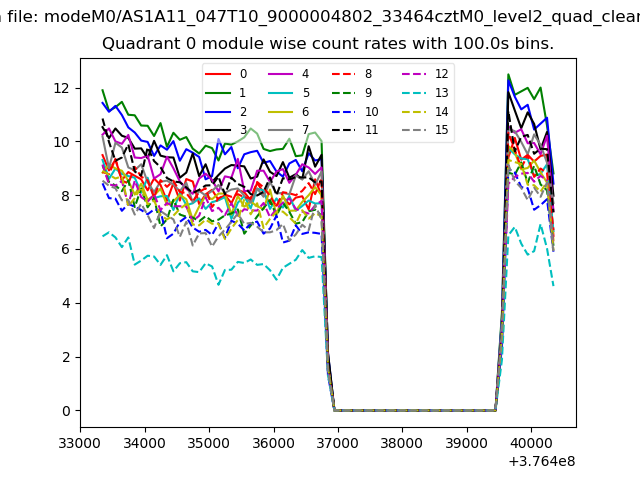 |
 |
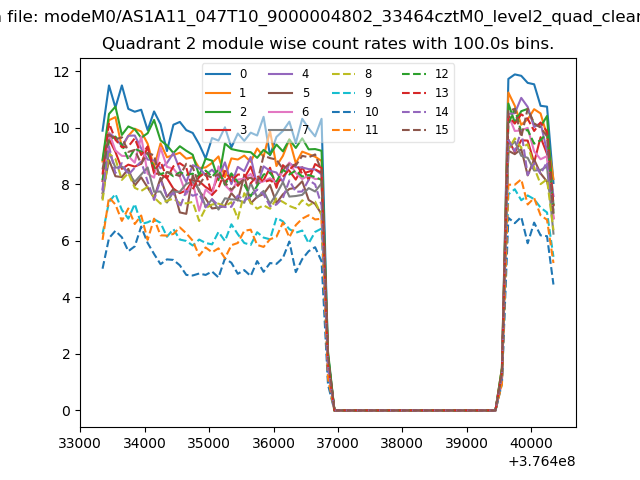
| Module-wise count rates for Quadrant B Data is divided into 100 sec bins |
 |
 |
| Module-wise count rates for Quadrant C Data is divided into 100 sec bins |
 |
 |
| Module-wise count rates for Quadrant D Data is divided into 100 sec bins |
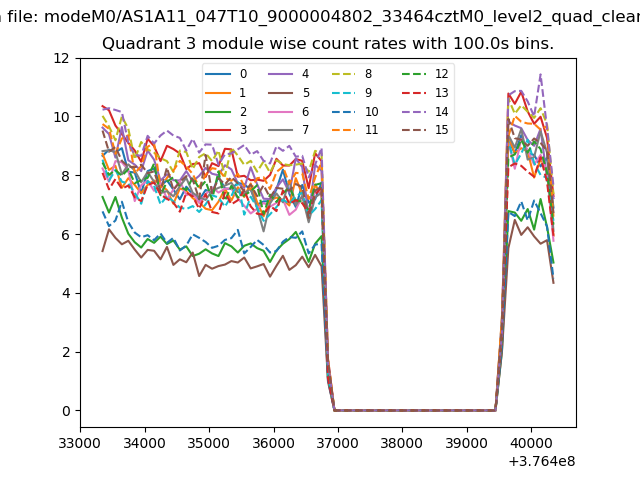 |
 |
| Parameter | Plot |
|---|---|
| CZT HV Monitor | 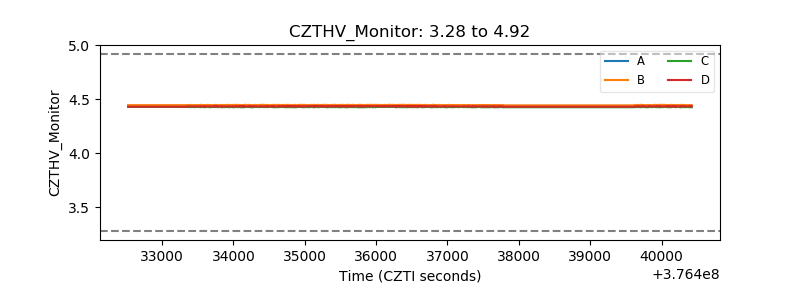 |
| D_VDD |  |
| Temperature 1 | 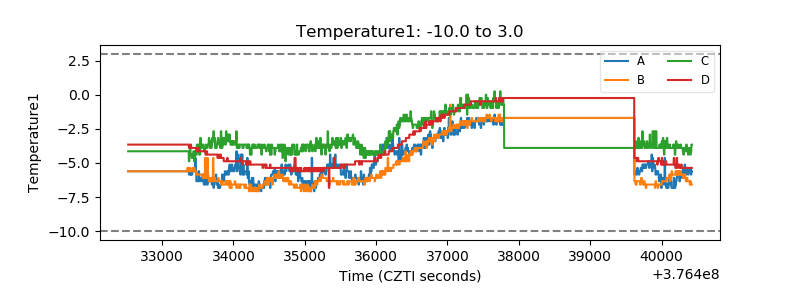 |
| Veto HV Monitor | 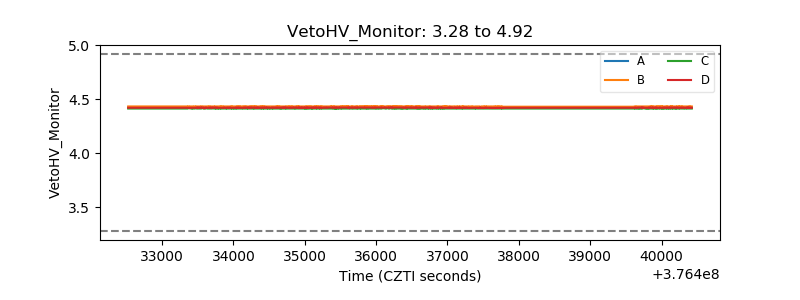 |
| Veto LLD | 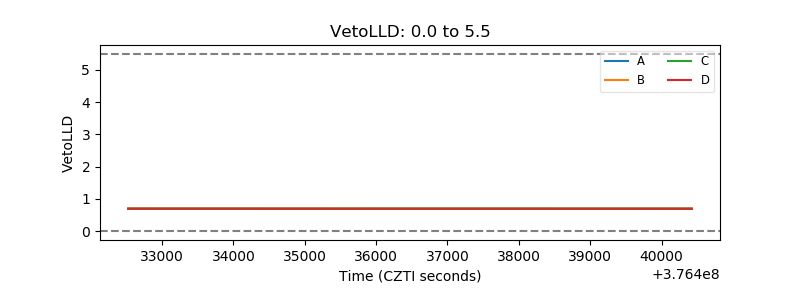 |
| Alpha Counter | 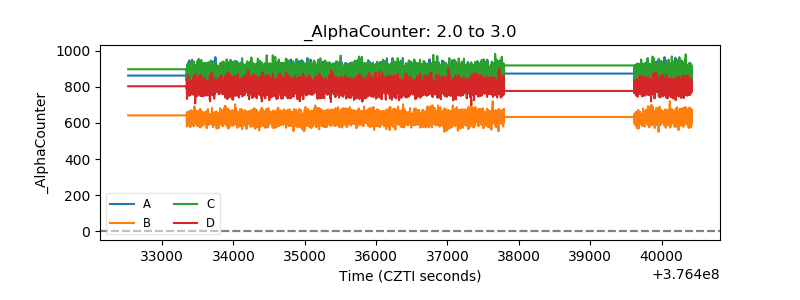 |
| _CPM_Rate | 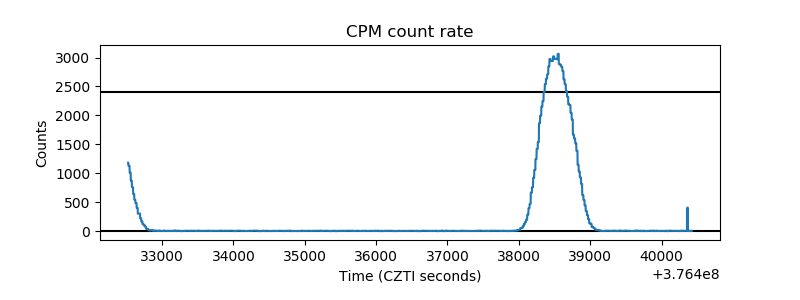 |
| CZT Counter | 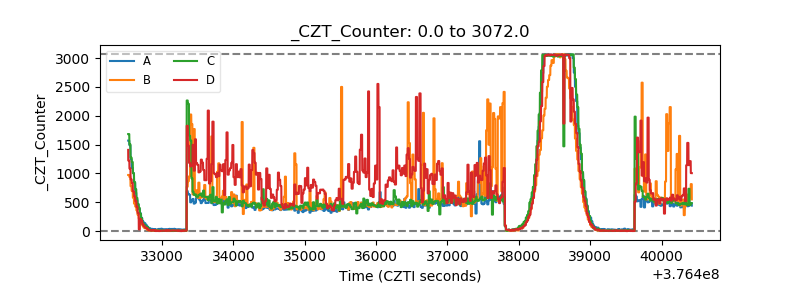 |
| +2.5 Volts monitor |  |
| +5 Volts monitor |  |
| _ROLL_ROT | 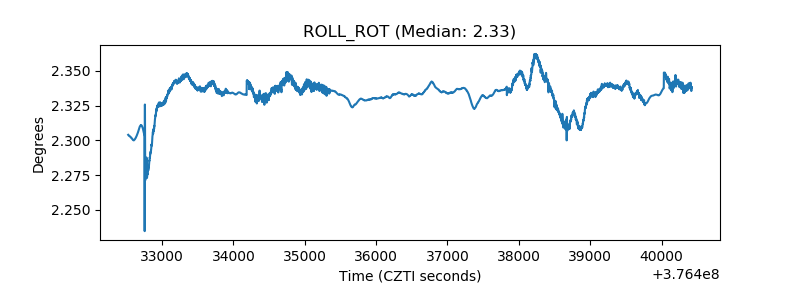 |
| _Roll_DEC | 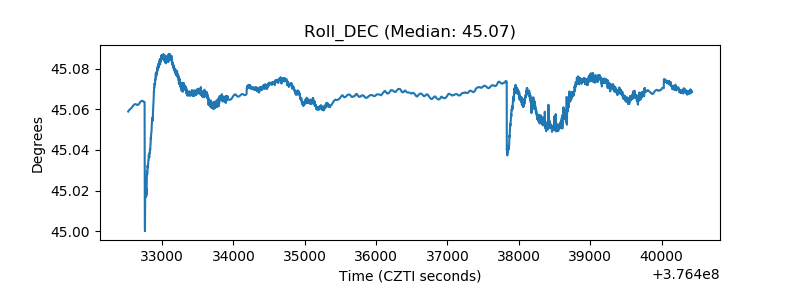 |
| _Roll_RA | 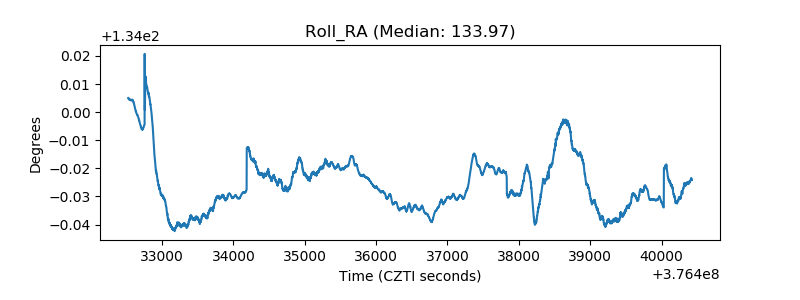 |
| Veto Counter | 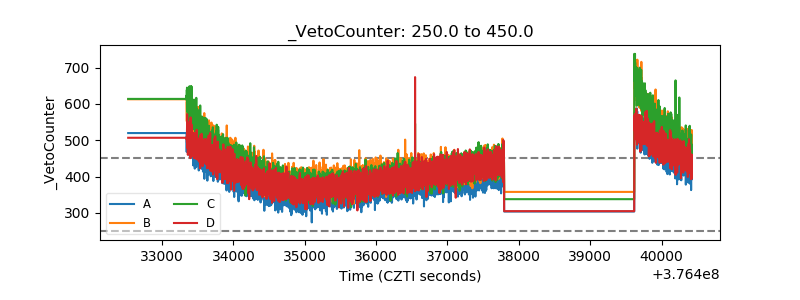 |