| Param | Original file | Final file |
|---|---|---|
| Filename | modeM0/AS1A11_047T10_9000004802_33465cztM0_level2.evt | modeM0/AS1A11_047T10_9000004802_33465cztM0_level2_quad_clean.evt |
| Size (bytes) | 467,190,720 | 81,993,600 |
| Size | 445.5 MB | 78.2 MB |
| Events in quadrant A | 2,418,531 | 545,306 |
| Events in quadrant B | 3,710,745 | 546,037 |
| Events in quadrant C | 3,011,730 | 536,896 |
| Events in quadrant D | 4,659,193 | 494,356 |
| Mode SS | |||
|---|---|---|---|
| Quadrant | BADHDUFLAG | Total packets | Discarded packets |
| A | 0 | 106 | 0 |
| B | 0 | 106 | 0 |
| C | 0 | 106 | 0 |
| D | 0 | 106 | 0 |
| Mode M9 | |||
|---|---|---|---|
| Quadrant | BADHDUFLAG | Total packets | Discarded packets |
| A | 0 | 28 | 0 |
| B | 0 | 28 | 0 |
| C | 0 | 28 | 0 |
| D | 0 | 29 | 0 |
| Mode M0 | |||
|---|---|---|---|
| Quadrant | BADHDUFLAG | Total packets | Discarded packets |
| A | 0 | 10438 | 3 |
| B | 0 | 14342 | 2 |
| C | 0 | 12007 | 2 |
| D | 0 | 17472 | 2 |
| Quadrant | Total seconds | Saturated seconds | Saturation percentage |
|---|---|---|---|
| A | 5138 | 8 | 0.155703% |
| B | 5138 | 301 | 5.858311% |
| C | 5138 | 131 | 2.549630% |
| D | 5138 | 159 | 3.094589% |
Noise dominated data is calculated using 1-second bins in cleaned event files. If a bin has >2000 counts, and if more than 50% of those come from <1% of pixels, then it is considered to be noise-dominated and hence unusable.
| Quadrant | # 1 sec bins | Bins with >0 counts | Bins with >2000 counts | High rate bins dominated by noise | Noise dominated (total time) | Noise dominated (detector-on time) | Marked lightcurve |
|---|---|---|---|---|---|---|---|
| A | 7081 | 5139 | 2 | 2 | 0.03% | 0.04% | 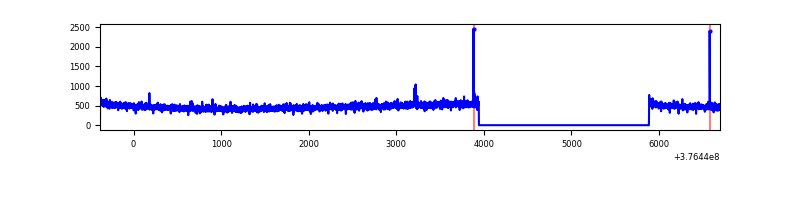 |
| B | 7081 | 5139 | 238 | 238 | 3.36% | 4.63% | 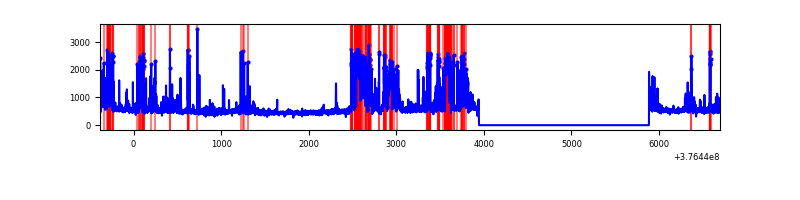 |
| C | 7081 | 5139 | 106 | 106 | 1.50% | 2.06% | 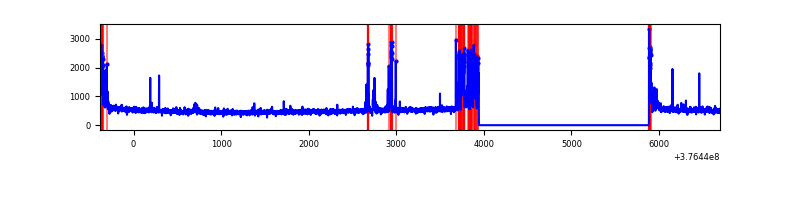 |
| D | 7081 | 5139 | 144 | 144 | 2.03% | 2.80% | 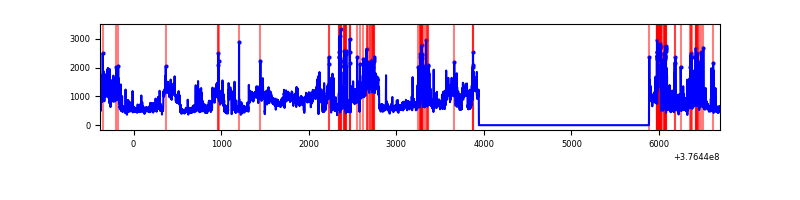 |
Top three noisy pixels from each quadrant. If the there are fewer than three noisy pixels in the level2.evt file, extra rows are filled as -1
| Pixel properties | Quadrant properties | ||||||
|---|---|---|---|---|---|---|---|
| Quadrant | DetID | PixID | Counts | Sigma | Mean | Median | Sigma |
| A | 15 | 169 | 16137 | 126.5 | 616 | 605 | 122.8 |
| A | 7 | 192 | 14071 | 109.67 | 616 | 605 | 122.8 |
| A | 13 | 254 | 10406 | 79.82 | 616 | 605 | 122.8 |
| B | 5 | 172 | 679342 | 5916.66 | 606 | 592 | 114.7 |
| B | 5 | 255 | 264933 | 2304.26 | 606 | 592 | 114.7 |
| B | 4 | 170 | 202678 | 1761.58 | 606 | 592 | 114.7 |
| C | 14 | 254 | 268350 | 1989.73 | 590 | 594 | 134.6 |
| C | 15 | 214 | 223004 | 1652.76 | 590 | 594 | 134.6 |
| C | 0 | 10 | 146071 | 1081.06 | 590 | 594 | 134.6 |
| D | 8 | 195 | 1641384 | 11528.76 | 583 | 567 | 142.3 |
| D | 2 | 250 | 489000 | 3431.84 | 583 | 567 | 142.3 |
| D | 12 | 6 | 83135 | 580.14 | 583 | 567 | 142.3 |
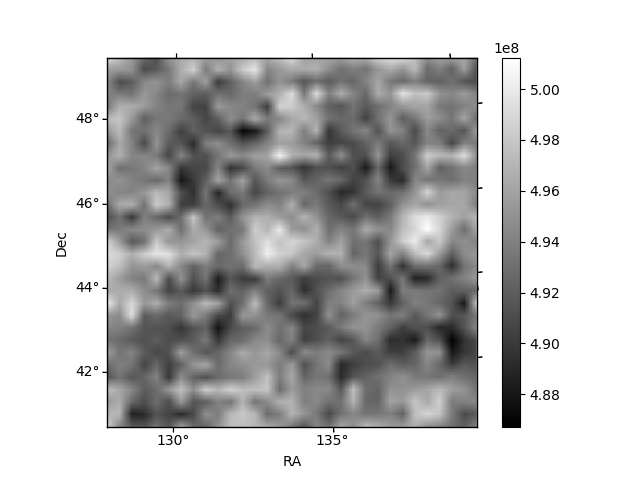
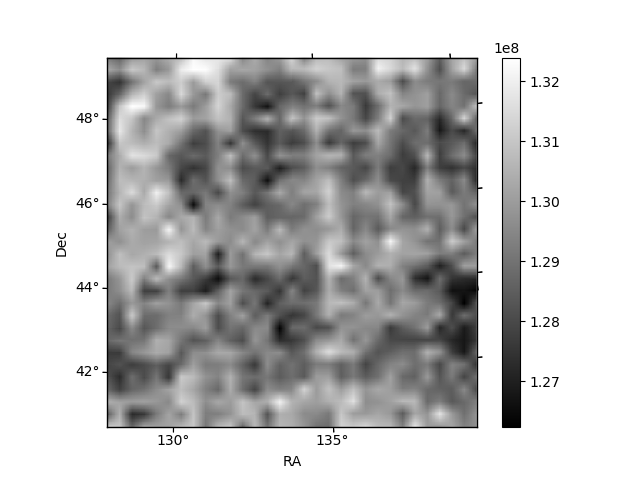
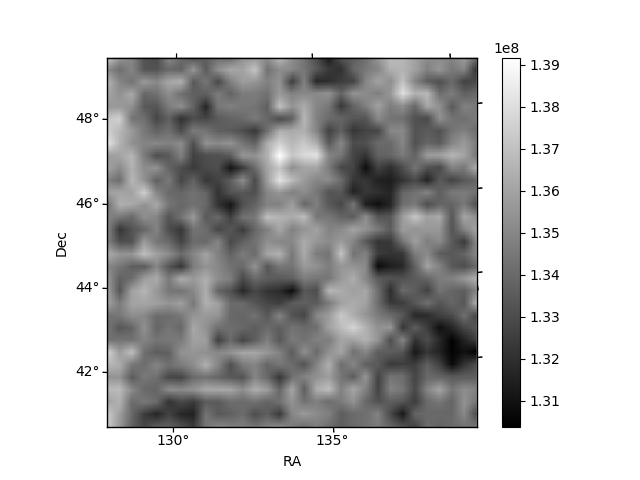
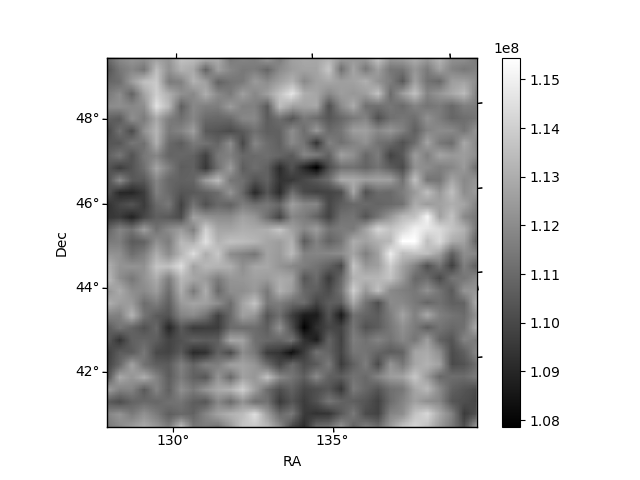
Histogram calculated using DETX and DETY for each event in the final _common_clean file
| Quadrant A | 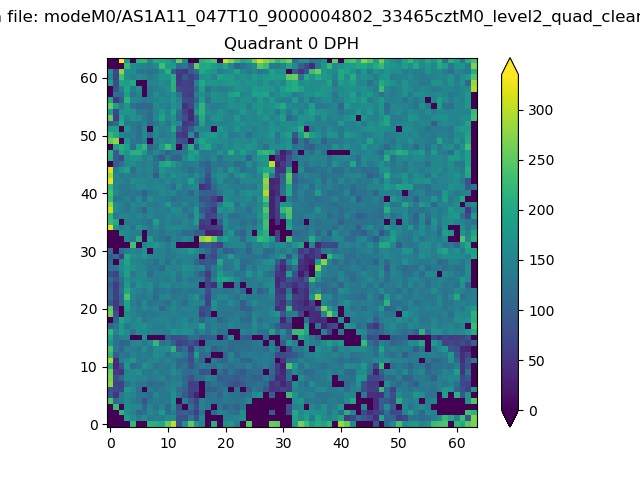 |
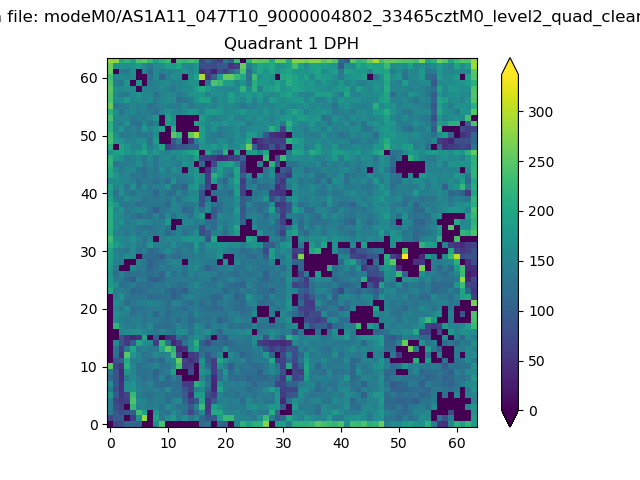 |
Quadrant B |
|---|---|---|---|
| Quadrant D | 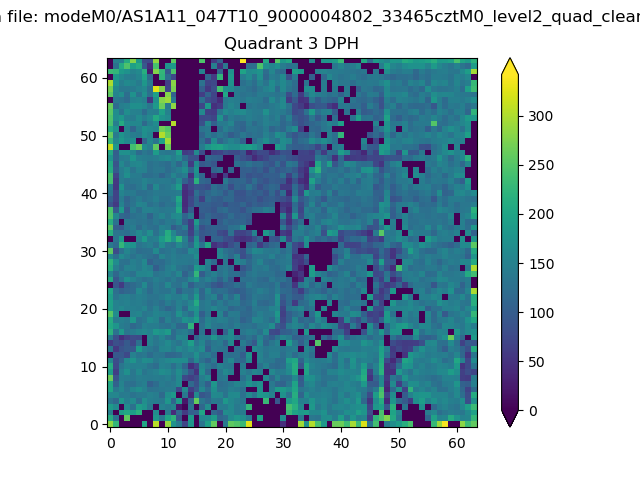 |
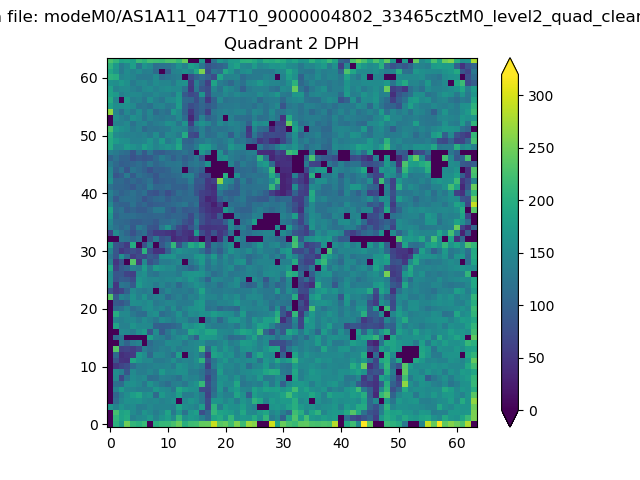 |
Quadrant C |
| Plot type | Count rate plots | Images |
|---|---|---|
| Comparison with Poisson distribution Blue bars denote a histogram of data divided into 1 sec bins. Red curve is a Poisson curve with rate = median count rate of data. |
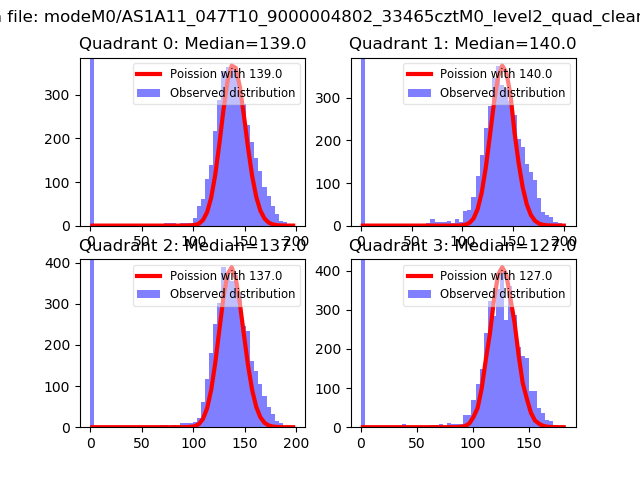 |
 |
| Quadrant-wise count rates Data is divided into 100 sec bins |
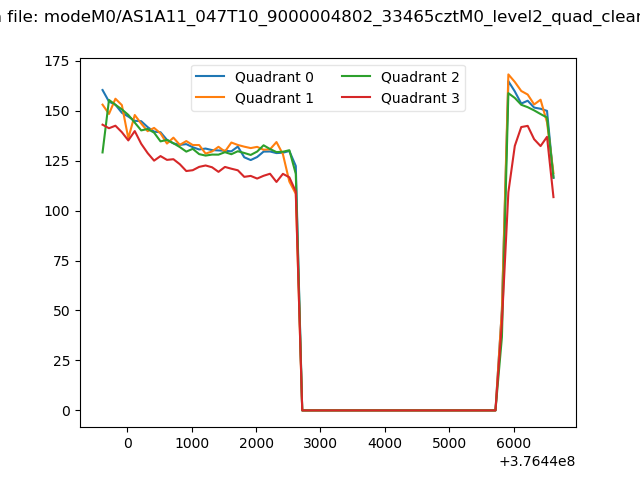 |
|
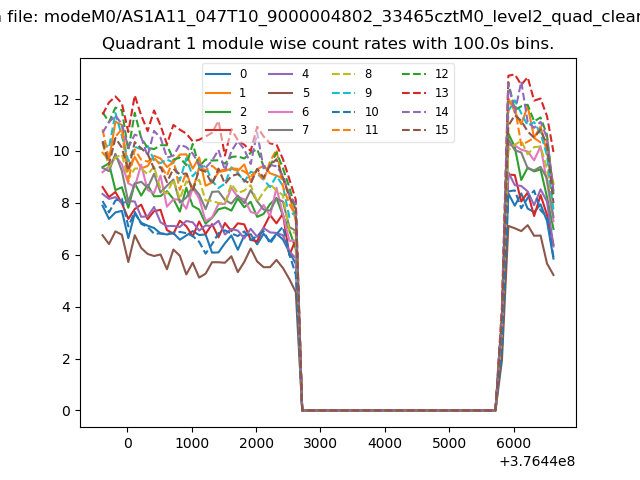
| Module-wise count rates for Quadrant A Data is divided into 100 sec bins |
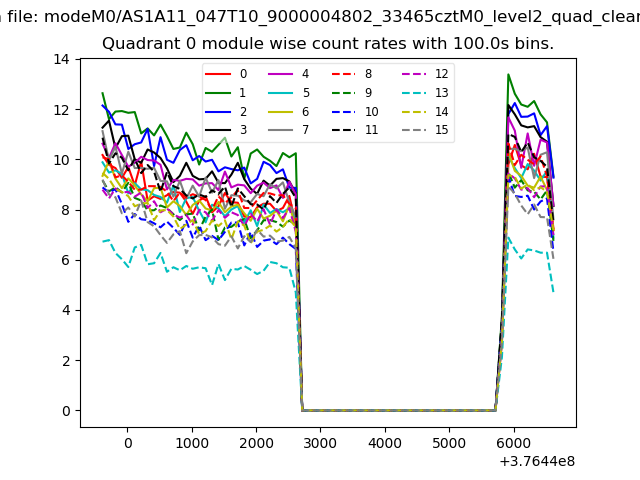 |
 |
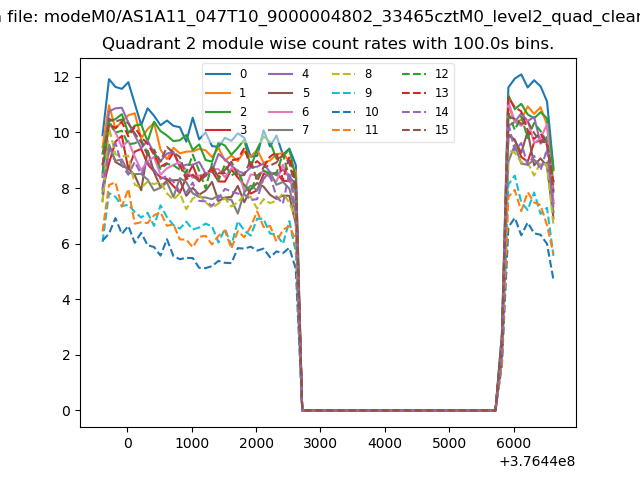
| Module-wise count rates for Quadrant B Data is divided into 100 sec bins |
 |
 |
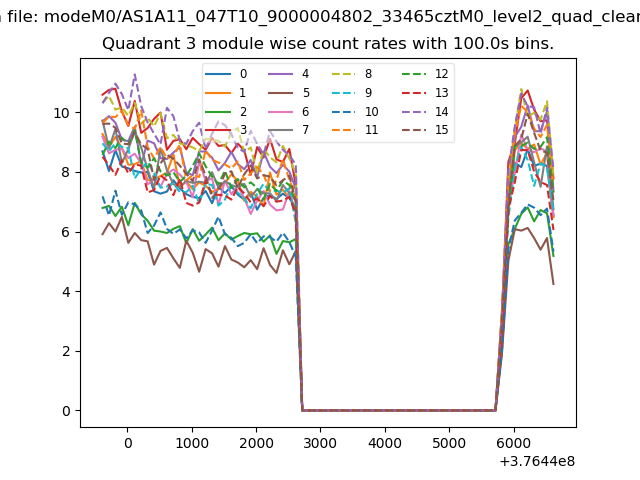
| Module-wise count rates for Quadrant C Data is divided into 100 sec bins |
 |
 |
| Module-wise count rates for Quadrant D Data is divided into 100 sec bins |
 |
 |
| Parameter | Plot |
|---|---|
| CZT HV Monitor |  |
| D_VDD |  |
| Temperature 1 | 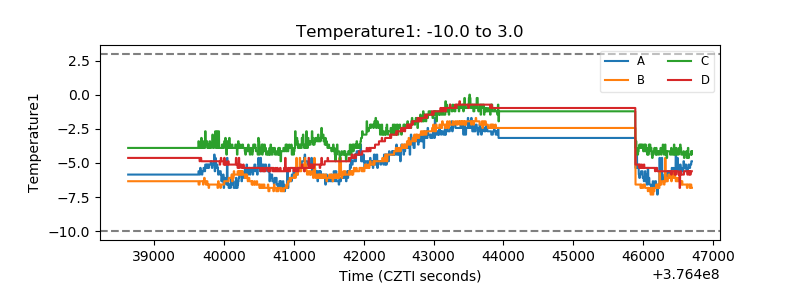 |
| Veto HV Monitor |  |
| Veto LLD | 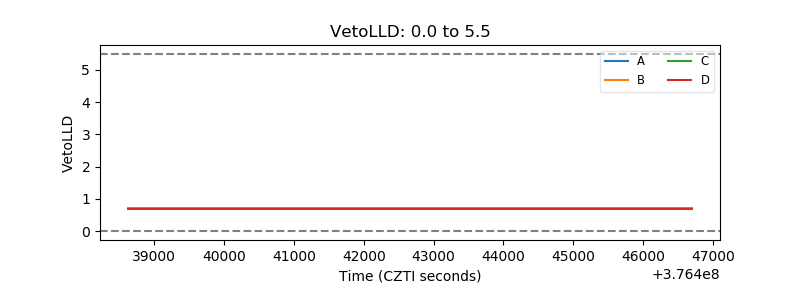 |
| Alpha Counter | 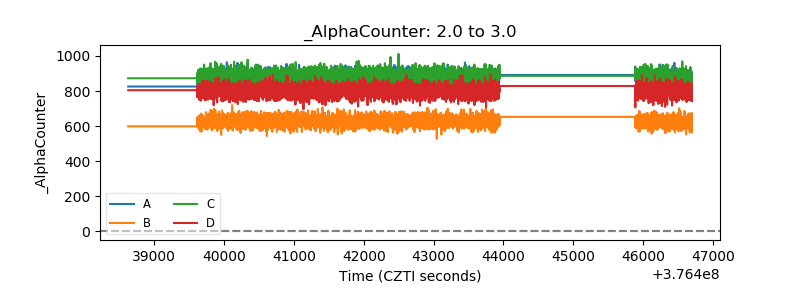 |
| _CPM_Rate | 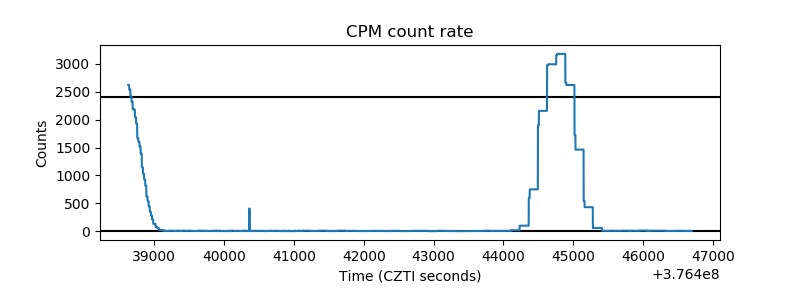 |
| CZT Counter | 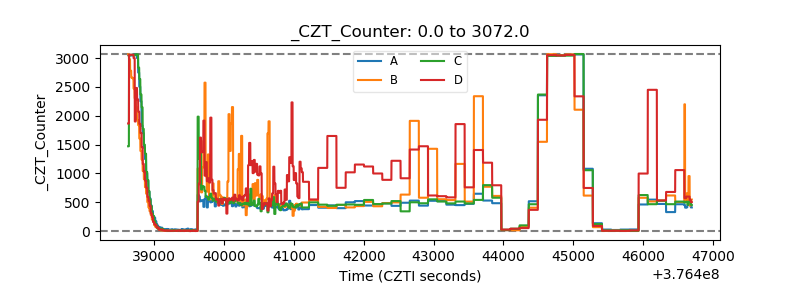 |
| +2.5 Volts monitor |  |
| +5 Volts monitor |  |
| _ROLL_ROT | 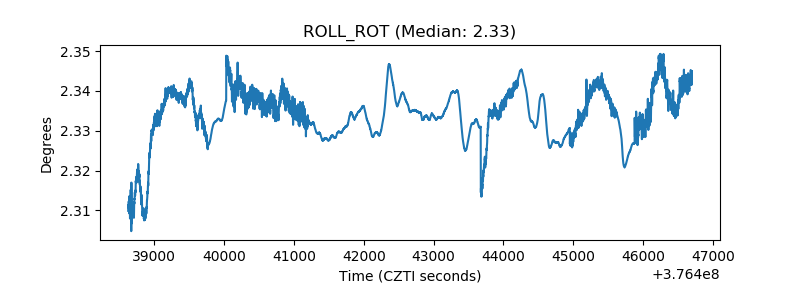 |
| _Roll_DEC | 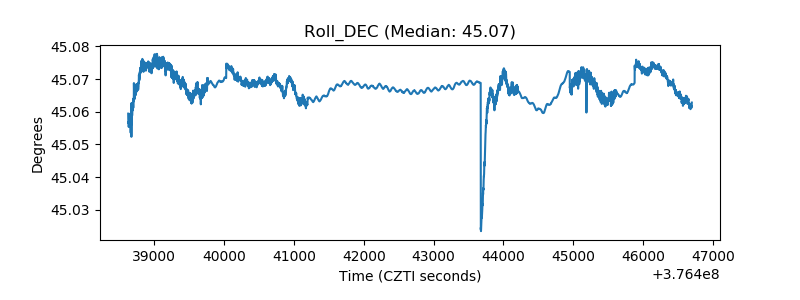 |
| _Roll_RA | 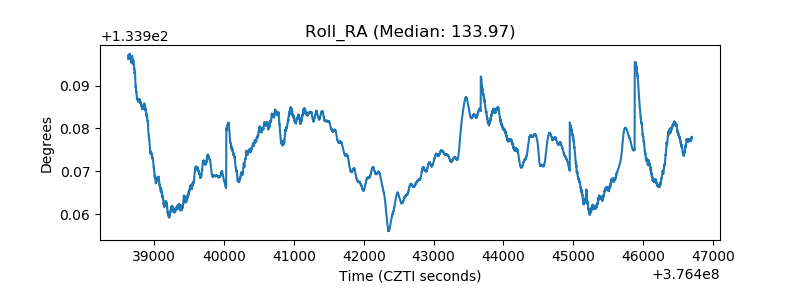 |
| Veto Counter | 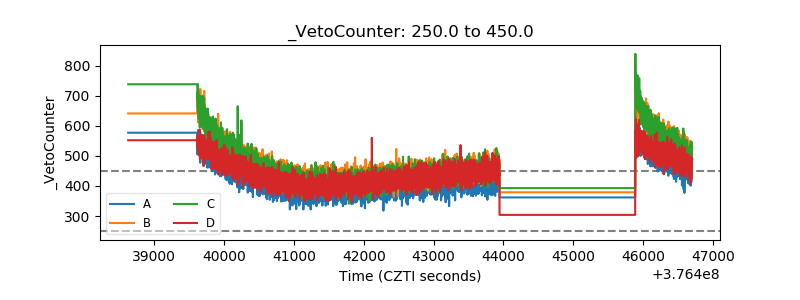 |