| Param | Original file | Final file |
|---|---|---|
| Filename | modeM0/AS1A11_047T10_9000004802_33466cztM0_level2.evt | modeM0/AS1A11_047T10_9000004802_33466cztM0_level2_quad_clean.evt |
| Size (bytes) | 455,736,960 | 81,342,720 |
| Size | 434.6 MB | 77.6 MB |
| Events in quadrant A | 2,588,532 | 537,492 |
| Events in quadrant B | 3,638,821 | 545,808 |
| Events in quadrant C | 3,034,807 | 524,381 |
| Events in quadrant D | 4,182,539 | 486,525 |
| Mode SS | |||
|---|---|---|---|
| Quadrant | BADHDUFLAG | Total packets | Discarded packets |
| A | 0 | 106 | 0 |
| B | 0 | 106 | 0 |
| C | 0 | 106 | 0 |
| D | 0 | 106 | 0 |
| Mode M9 | |||
|---|---|---|---|
| Quadrant | BADHDUFLAG | Total packets | Discarded packets |
| A | 0 | 34 | 0 |
| B | 0 | 34 | 0 |
| C | 0 | 34 | 0 |
| D | 0 | 35 | 0 |
| Mode M0 | |||
|---|---|---|---|
| Quadrant | BADHDUFLAG | Total packets | Discarded packets |
| A | 0 | 10816 | 3 |
| B | 0 | 14196 | 2 |
| C | 0 | 12025 | 2 |
| D | 0 | 16124 | 2 |
| Quadrant | Total seconds | Saturated seconds | Saturation percentage |
|---|---|---|---|
| A | 5274 | 9 | 0.170648% |
| B | 5274 | 184 | 3.488813% |
| C | 5274 | 95 | 1.801289% |
| D | 5274 | 158 | 2.995829% |
Noise dominated data is calculated using 1-second bins in cleaned event files. If a bin has >2000 counts, and if more than 50% of those come from <1% of pixels, then it is considered to be noise-dominated and hence unusable.
| Quadrant | # 1 sec bins | Bins with >0 counts | Bins with >2000 counts | High rate bins dominated by noise | Noise dominated (total time) | Noise dominated (detector-on time) | Marked lightcurve |
|---|---|---|---|---|---|---|---|
| A | 7337 | 5275 | 1 | 1 | 0.01% | 0.02% | 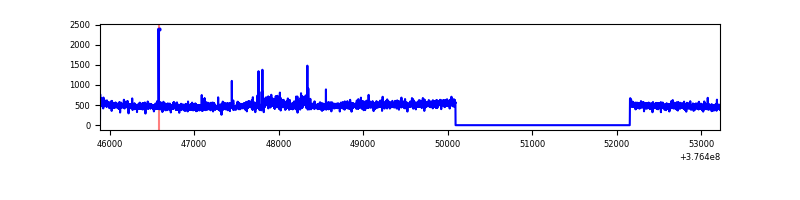 |
| B | 7337 | 5275 | 104 | 104 | 1.42% | 1.97% | 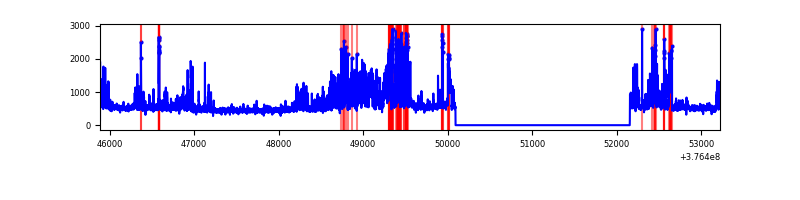 |
| C | 7337 | 5275 | 94 | 94 | 1.28% | 1.78% | 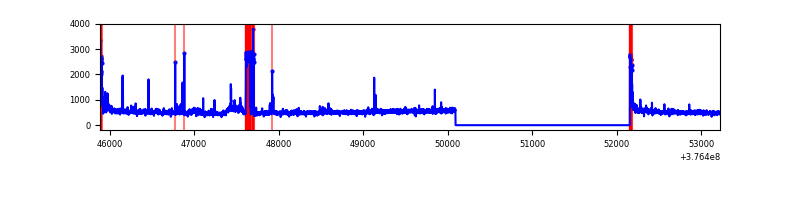 |
| D | 7337 | 5275 | 173 | 173 | 2.36% | 3.28% | 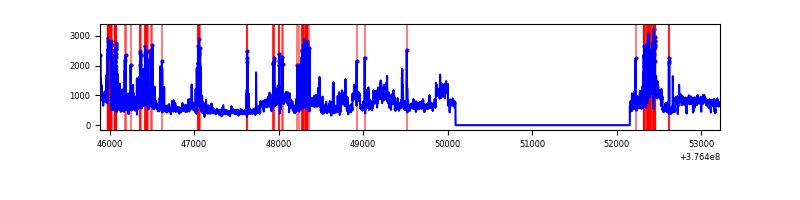 |
Top three noisy pixels from each quadrant. If the there are fewer than three noisy pixels in the level2.evt file, extra rows are filled as -1
| Pixel properties | Quadrant properties | ||||||
|---|---|---|---|---|---|---|---|
| Quadrant | DetID | PixID | Counts | Sigma | Mean | Median | Sigma |
| A | 15 | 169 | 83997 | 655.99 | 643 | 633 | 127.1 |
| A | 7 | 192 | 9420 | 69.14 | 643 | 633 | 127.1 |
| A | 13 | 6 | 9318 | 68.34 | 643 | 633 | 127.1 |
| B | 0 | 213 | 427288 | 3564.92 | 637 | 622 | 119.7 |
| B | 5 | 172 | 329844 | 2750.75 | 637 | 622 | 119.7 |
| B | 5 | 255 | 141518 | 1177.23 | 637 | 622 | 119.7 |
| C | 15 | 214 | 227128 | 1614.52 | 615 | 621 | 140.3 |
| C | 9 | 187 | 212181 | 1507.98 | 615 | 621 | 140.3 |
| C | 0 | 10 | 109296 | 774.62 | 615 | 621 | 140.3 |
| D | 8 | 195 | 1087484 | 6956.62 | 604 | 593 | 156.2 |
| D | 2 | 250 | 464591 | 2969.81 | 604 | 593 | 156.2 |
| D | 13 | 249 | 84425 | 536.56 | 604 | 593 | 156.2 |
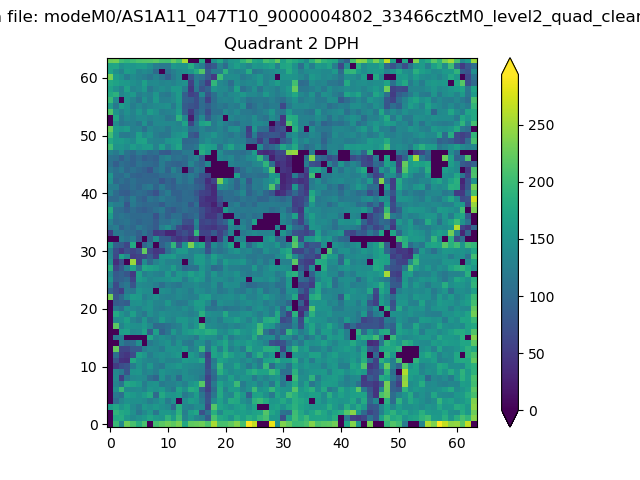
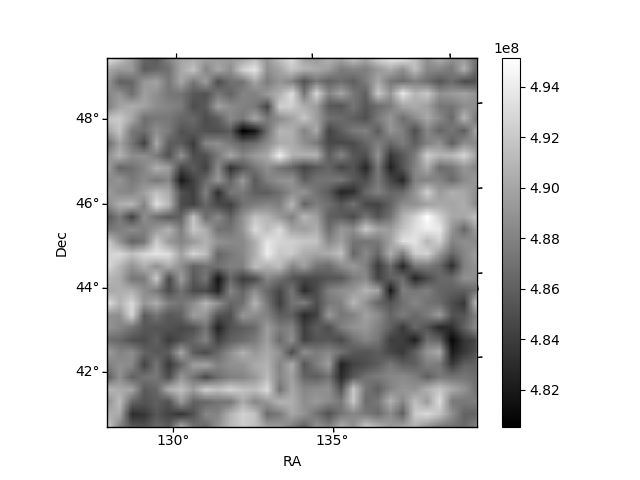
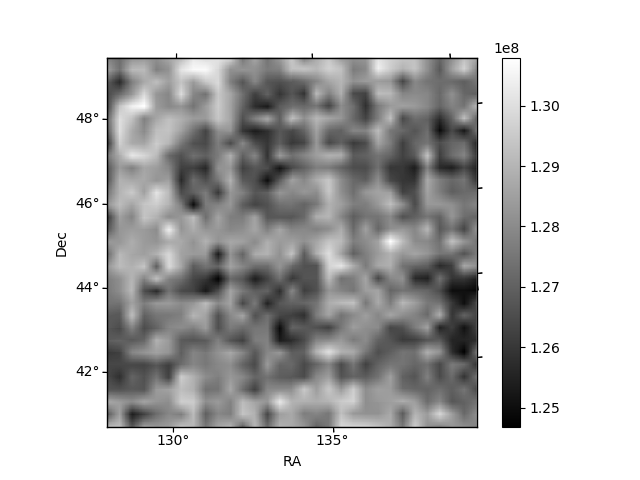
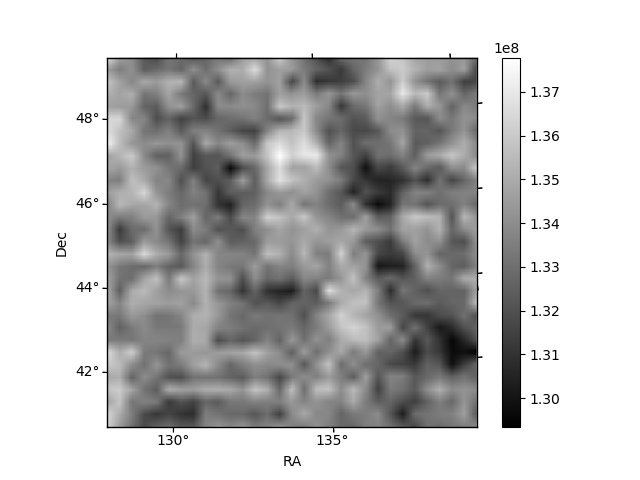
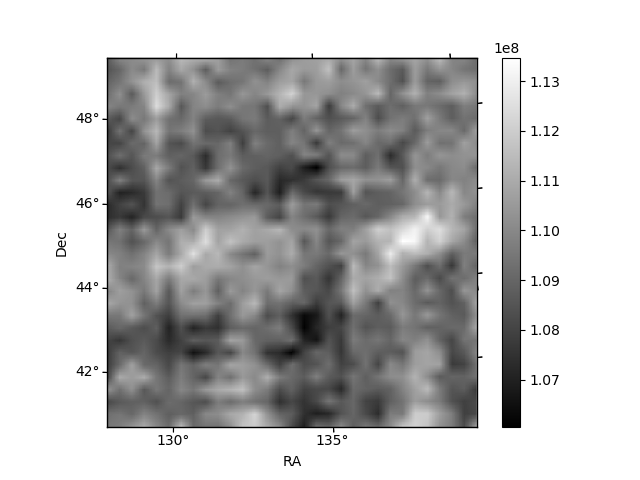
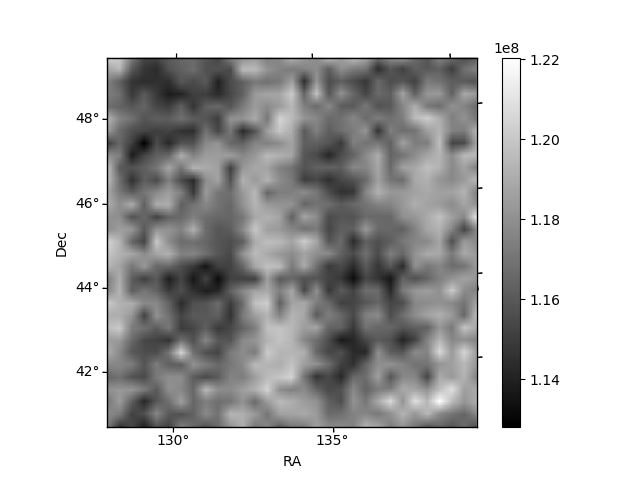
Histogram calculated using DETX and DETY for each event in the final _common_clean file
| Quadrant A | 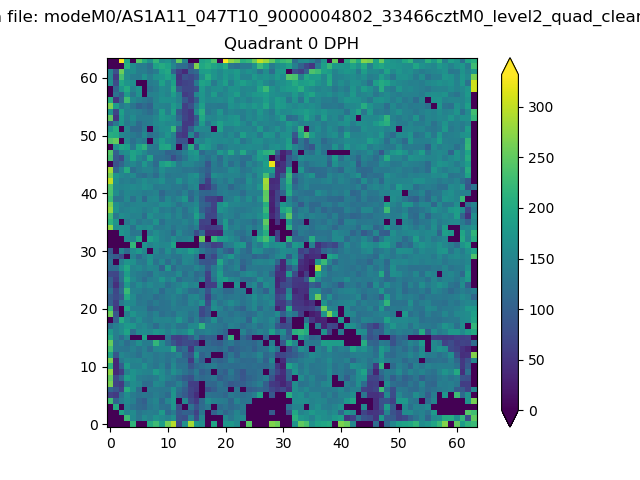 |
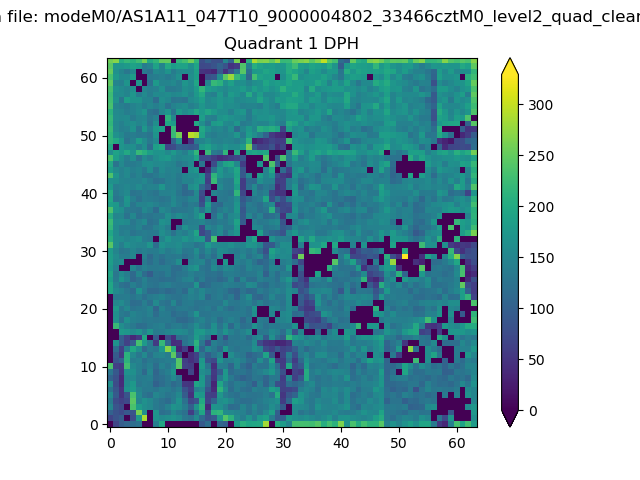 |
Quadrant B |
|---|---|---|---|
| Quadrant D | 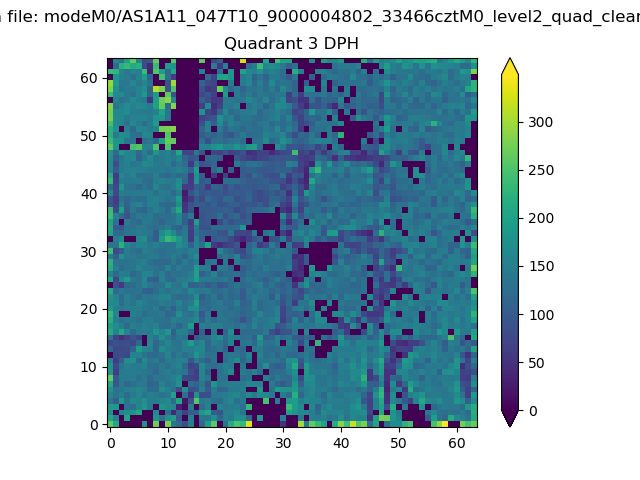 |
 |
Quadrant C |
| Plot type | Count rate plots | Images |
|---|---|---|
| Comparison with Poisson distribution Blue bars denote a histogram of data divided into 1 sec bins. Red curve is a Poisson curve with rate = median count rate of data. |
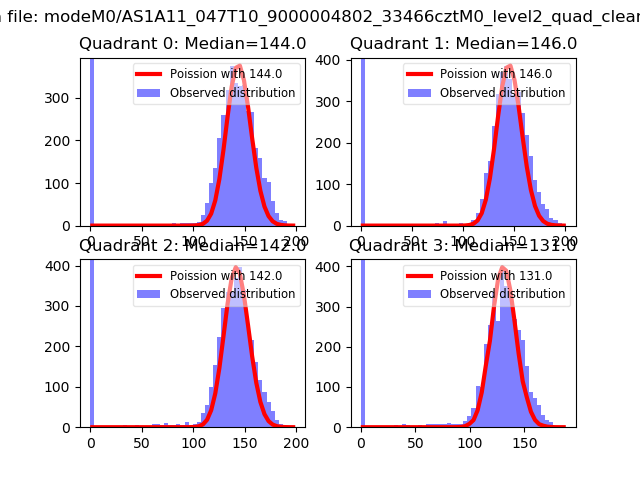 |
 |
| Quadrant-wise count rates Data is divided into 100 sec bins |
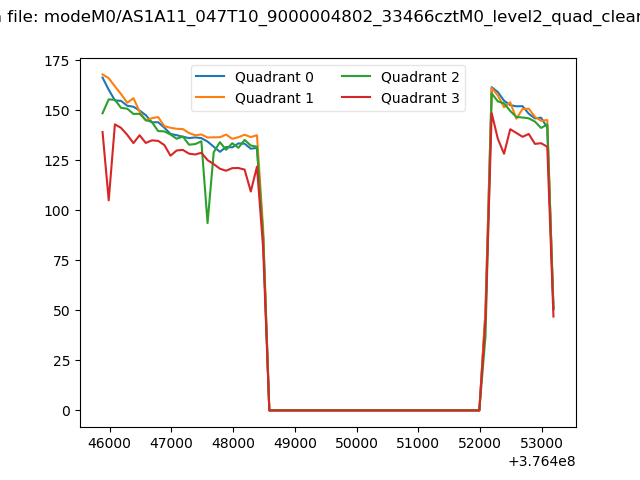 |
|
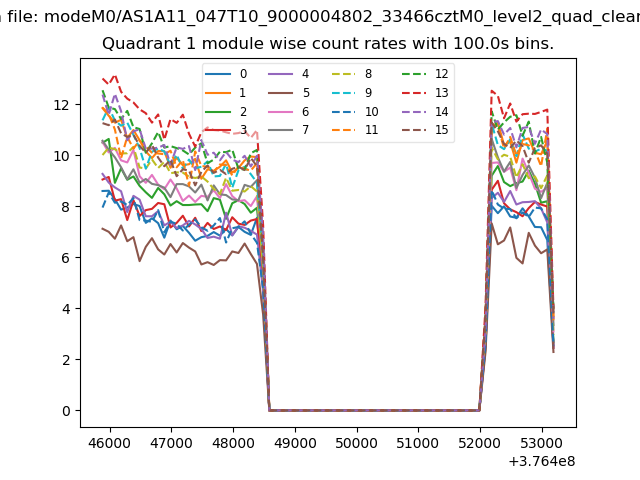
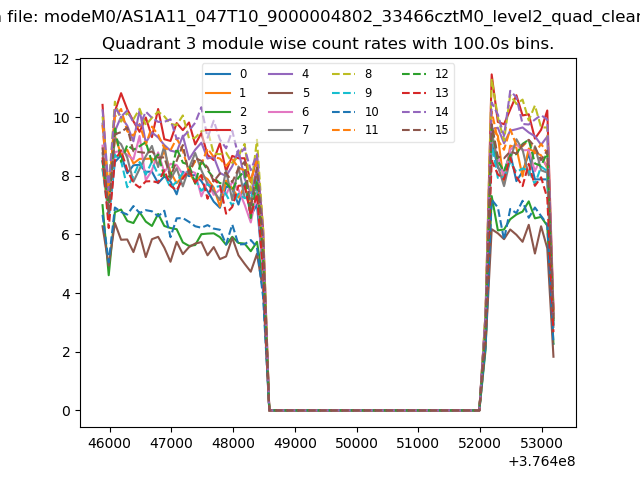
| Module-wise count rates for Quadrant A Data is divided into 100 sec bins |
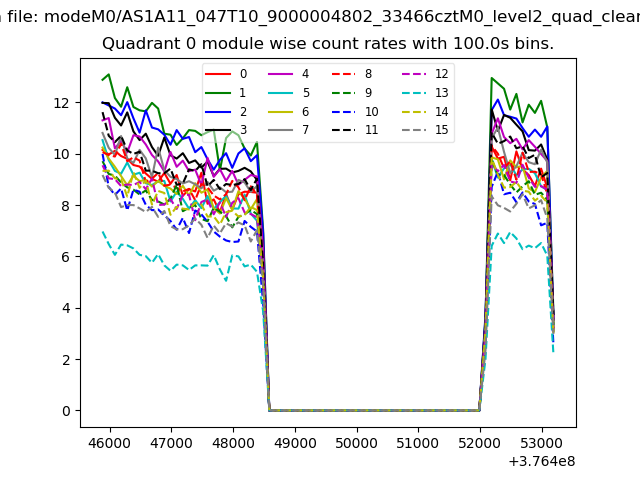 |
 |
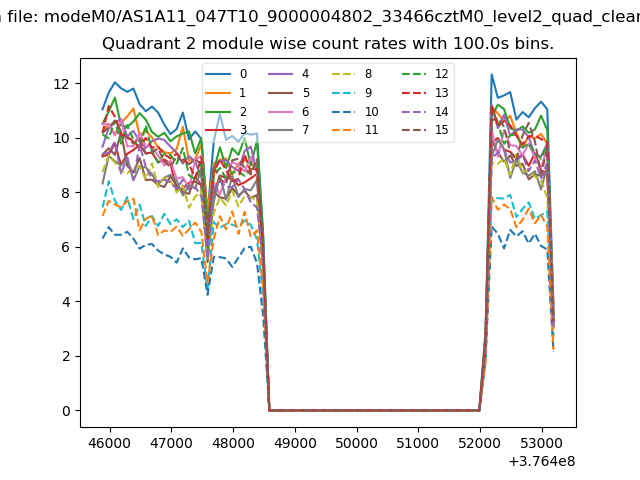
| Module-wise count rates for Quadrant B Data is divided into 100 sec bins |
 |
 |
| Module-wise count rates for Quadrant C Data is divided into 100 sec bins |
 |
 |
| Module-wise count rates for Quadrant D Data is divided into 100 sec bins |
 |
 |
| Parameter | Plot |
|---|---|
| CZT HV Monitor | 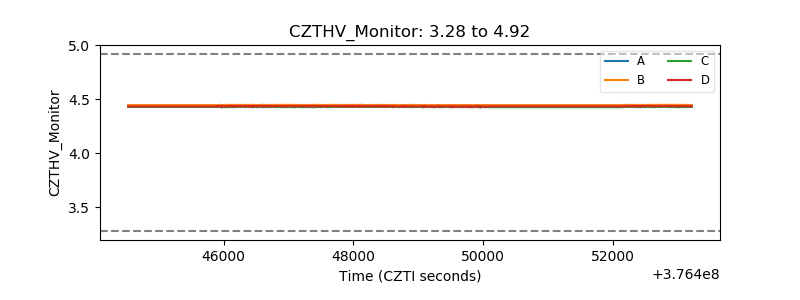 |
| D_VDD | 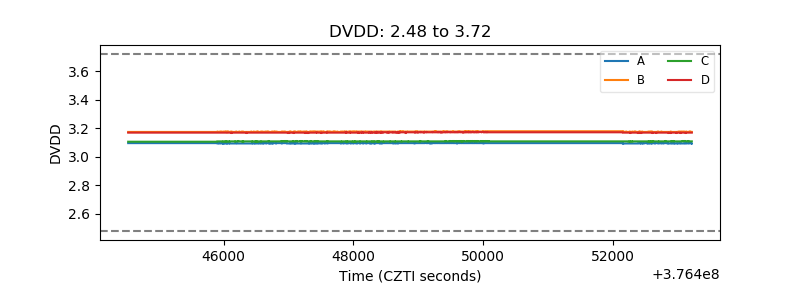 |
| Temperature 1 | 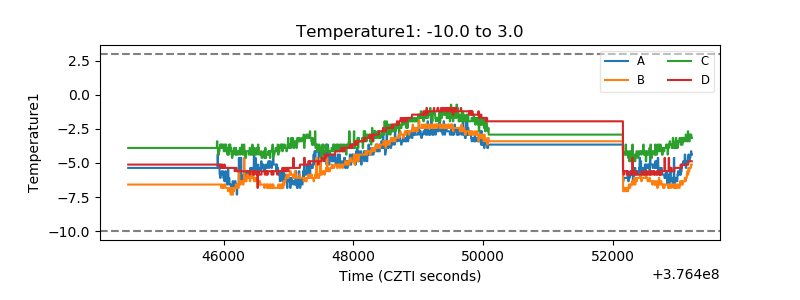 |
| Veto HV Monitor | 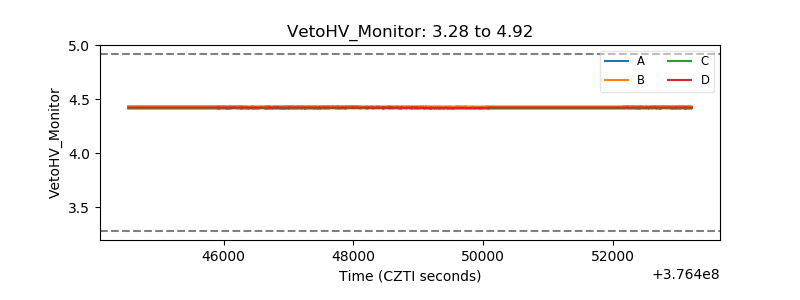 |
| Veto LLD | 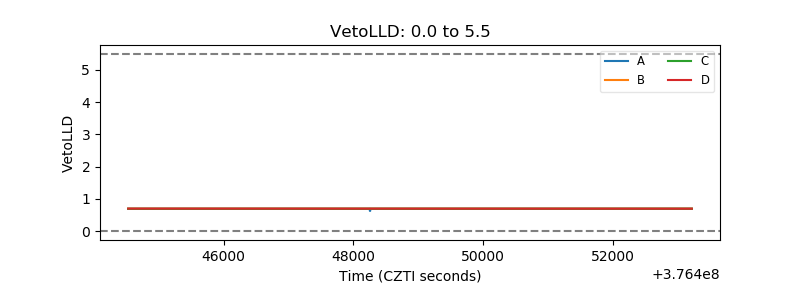 |
| Alpha Counter | 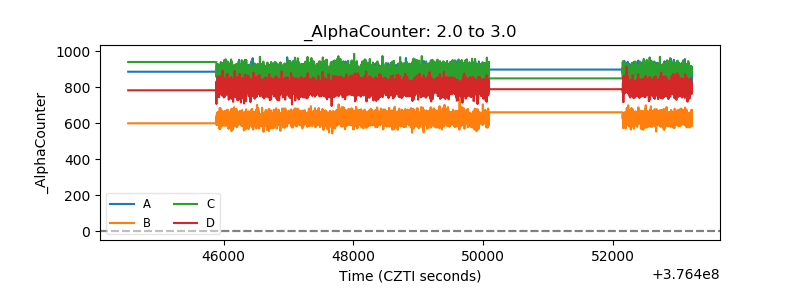 |
| _CPM_Rate | 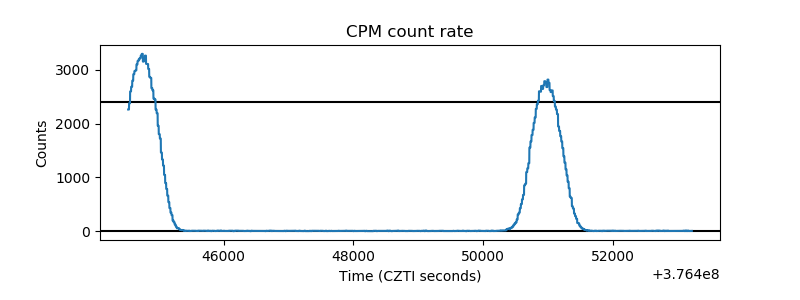 |
| CZT Counter | 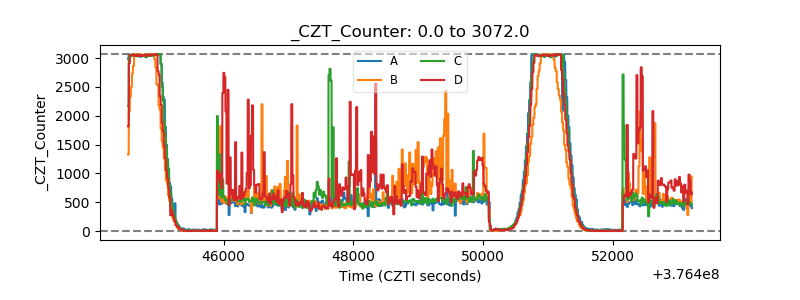 |
| +2.5 Volts monitor | 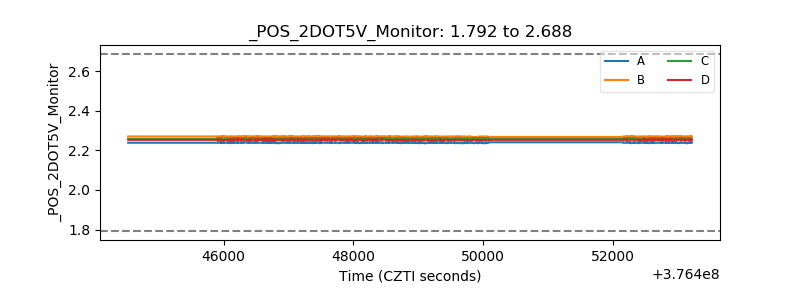 |
| +5 Volts monitor | 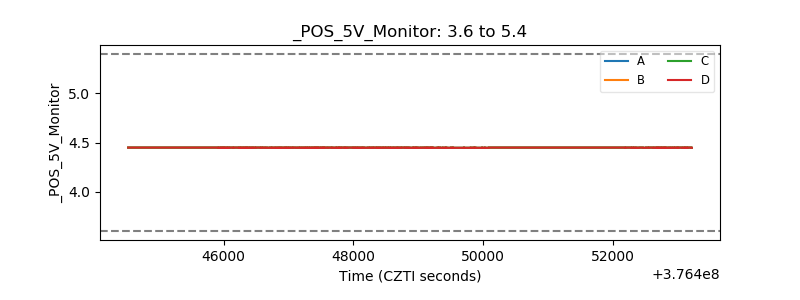 |
| _ROLL_ROT | 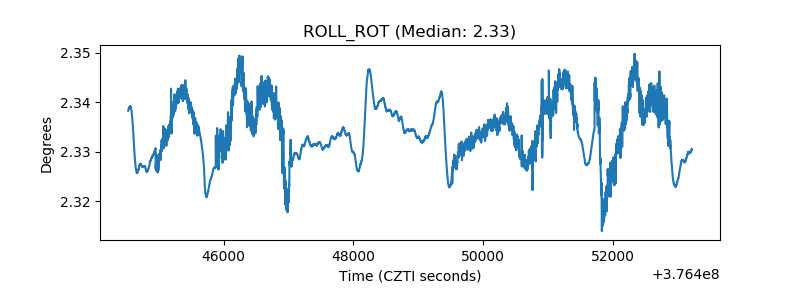 |
| _Roll_DEC | 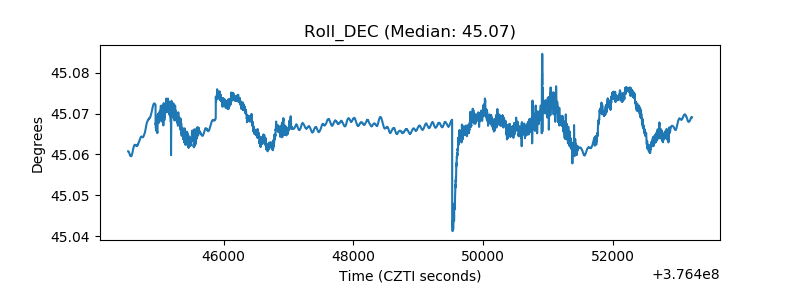 |
| _Roll_RA | 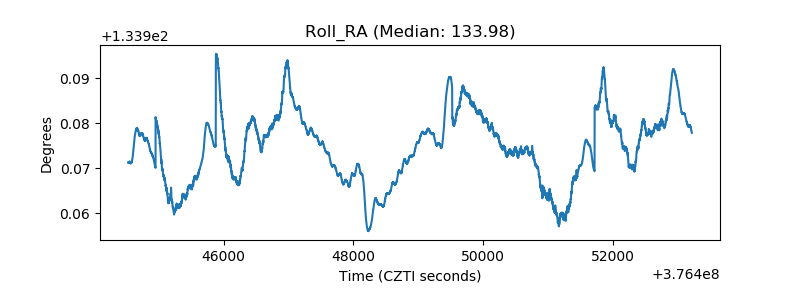 |
| Veto Counter | 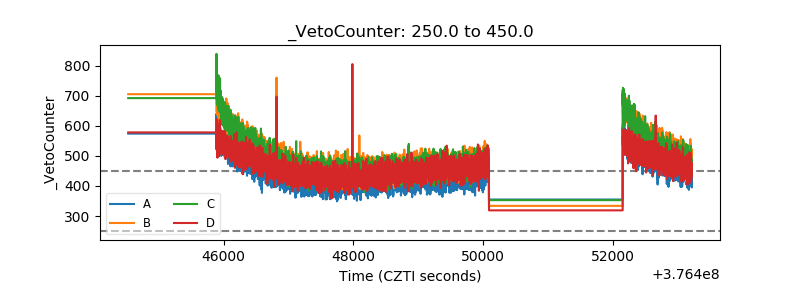 |