| Param | Original file | Final file |
|---|---|---|
| Filename | modeM0/AS1A11_047T10_9000004802_33468cztM0_level2.evt | modeM0/AS1A11_047T10_9000004802_33468cztM0_level2_quad_clean.evt |
| Size (bytes) | 441,383,040 | 65,646,720 |
| Size | 420.9 MB | 62.6 MB |
| Events in quadrant A | 2,406,068 | 420,684 |
| Events in quadrant B | 3,868,050 | 413,412 |
| Events in quadrant C | 2,698,928 | 409,489 |
| Events in quadrant D | 4,050,736 | 388,957 |
| Mode SS | |||
|---|---|---|---|
| Quadrant | BADHDUFLAG | Total packets | Discarded packets |
| A | 0 | 102 | 0 |
| B | 0 | 102 | 0 |
| C | 0 | 102 | 0 |
| D | 0 | 102 | 0 |
| Mode M9 | |||
|---|---|---|---|
| Quadrant | BADHDUFLAG | Total packets | Discarded packets |
| A | 0 | 30 | 0 |
| B | 0 | 30 | 0 |
| C | 0 | 30 | 0 |
| D | 0 | 31 | 0 |
| Mode M0 | |||
|---|---|---|---|
| Quadrant | BADHDUFLAG | Total packets | Discarded packets |
| A | 0 | 10204 | 2 |
| B | 0 | 14793 | 1 |
| C | 0 | 10915 | 1 |
| D | 0 | 15490 | 1 |
| Quadrant | Total seconds | Saturated seconds | Saturation percentage |
|---|---|---|---|
| A | 5068 | 4 | 0.078927% |
| B | 5068 | 255 | 5.031571% |
| C | 5068 | 35 | 0.690608% |
| D | 5068 | 59 | 1.164167% |
Noise dominated data is calculated using 1-second bins in cleaned event files. If a bin has >2000 counts, and if more than 50% of those come from <1% of pixels, then it is considered to be noise-dominated and hence unusable.
| Quadrant | # 1 sec bins | Bins with >0 counts | Bins with >2000 counts | High rate bins dominated by noise | Noise dominated (total time) | Noise dominated (detector-on time) | Marked lightcurve |
|---|---|---|---|---|---|---|---|
| A | 7191 | 5069 | 0 | 0 | 0.00% | 0.00% | 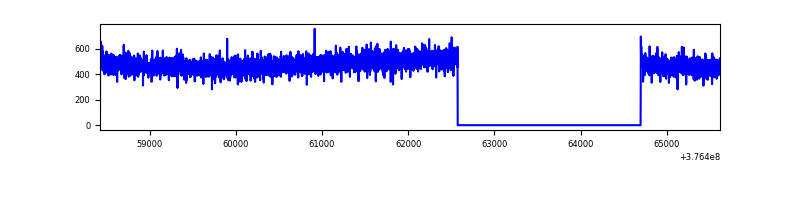 |
| B | 7191 | 5069 | 188 | 188 | 2.61% | 3.71% | 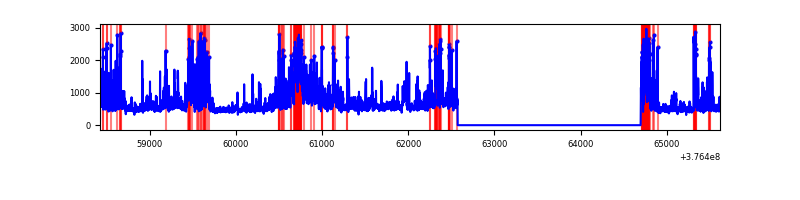 |
| C | 7191 | 5069 | 30 | 30 | 0.42% | 0.59% |  |
| D | 7191 | 5069 | 52 | 52 | 0.72% | 1.03% | 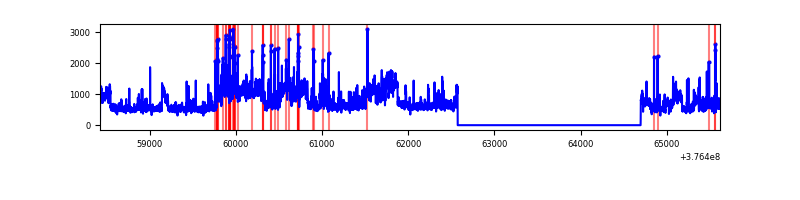 |
Top three noisy pixels from each quadrant. If the there are fewer than three noisy pixels in the level2.evt file, extra rows are filled as -1
| Pixel properties | Quadrant properties | ||||||
|---|---|---|---|---|---|---|---|
| Quadrant | DetID | PixID | Counts | Sigma | Mean | Median | Sigma |
| A | 13 | 254 | 9732 | 74.7 | 618 | 607 | 122.2 |
| A | 7 | 192 | 8374 | 63.58 | 618 | 607 | 122.2 |
| A | 13 | 6 | 7317 | 54.93 | 618 | 607 | 122.2 |
| B | 5 | 172 | 439161 | 3828.14 | 601 | 586 | 114.6 |
| B | 5 | 255 | 394922 | 3441.99 | 601 | 586 | 114.6 |
| B | 4 | 170 | 352169 | 3068.82 | 601 | 586 | 114.6 |
| C | 15 | 214 | 222926 | 1657.18 | 586 | 589 | 134.2 |
| C | 0 | 10 | 97513 | 722.42 | 586 | 589 | 134.2 |
| C | 3 | 233 | 29547 | 215.84 | 586 | 589 | 134.2 |
| D | 8 | 195 | 1287125 | 8996.45 | 588 | 570 | 143.0 |
| D | 2 | 152 | 138133 | 961.93 | 588 | 570 | 143.0 |
| D | 2 | 250 | 108193 | 752.57 | 588 | 570 | 143.0 |
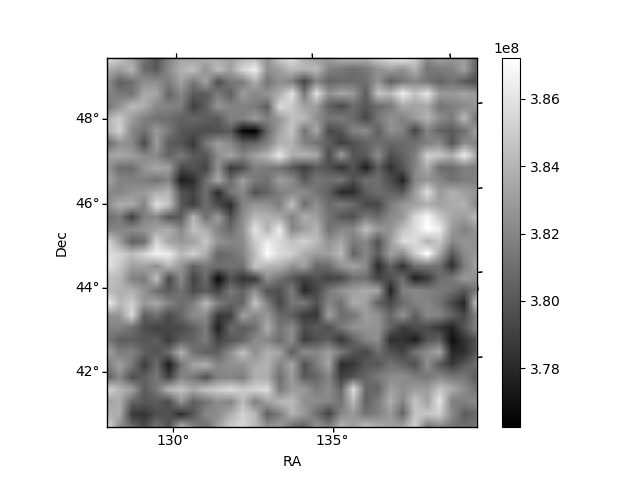
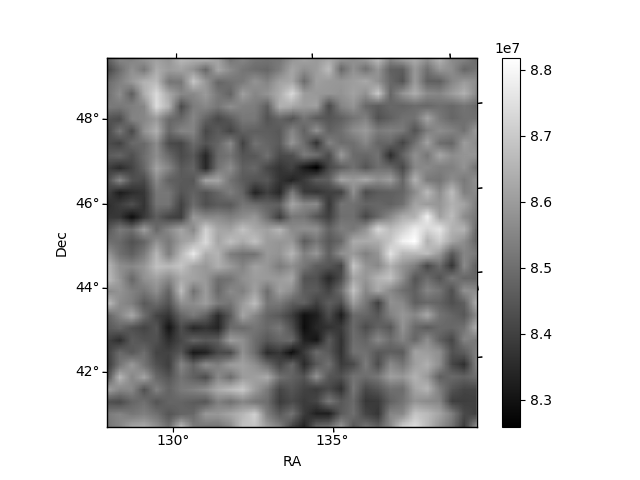
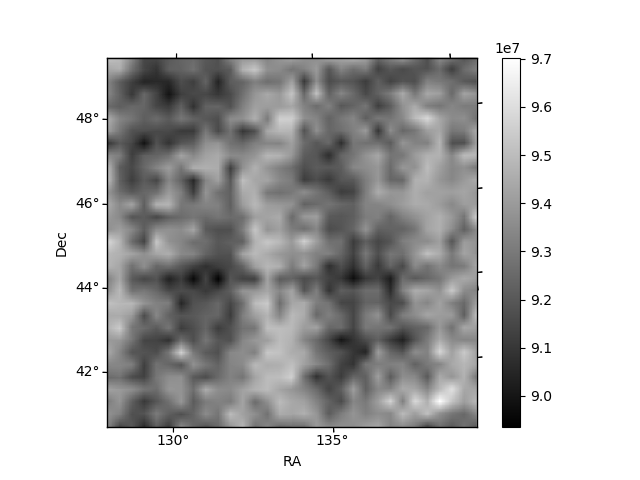
Histogram calculated using DETX and DETY for each event in the final _common_clean file
| Quadrant A |  |
 |
Quadrant B |
|---|---|---|---|
| Quadrant D |  |
 |
Quadrant C |
| Plot type | Count rate plots | Images |
|---|---|---|
| Comparison with Poisson distribution Blue bars denote a histogram of data divided into 1 sec bins. Red curve is a Poisson curve with rate = median count rate of data. |
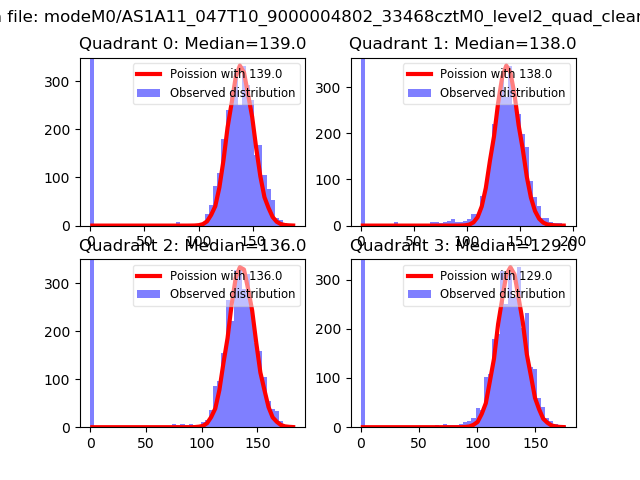 |
 |
| Quadrant-wise count rates Data is divided into 100 sec bins |
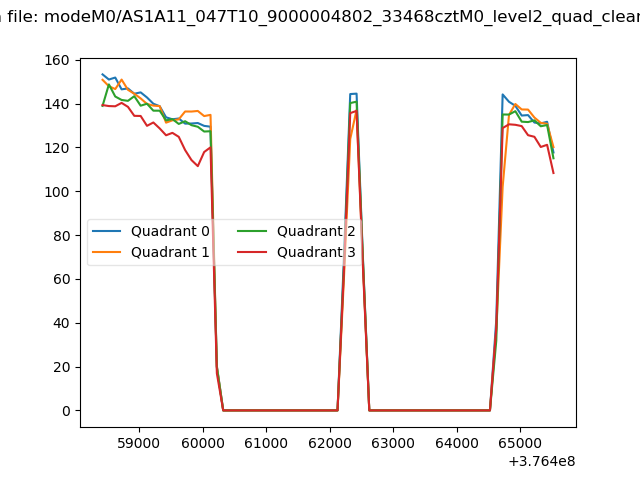 |
|
| Module-wise count rates for Quadrant A Data is divided into 100 sec bins |
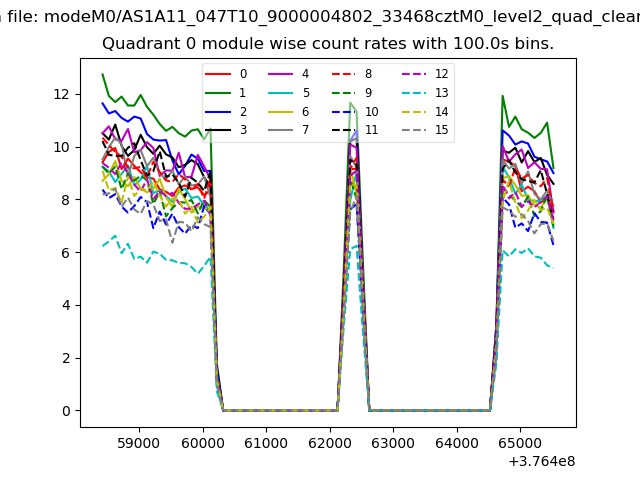 |
 |
| Module-wise count rates for Quadrant B Data is divided into 100 sec bins |
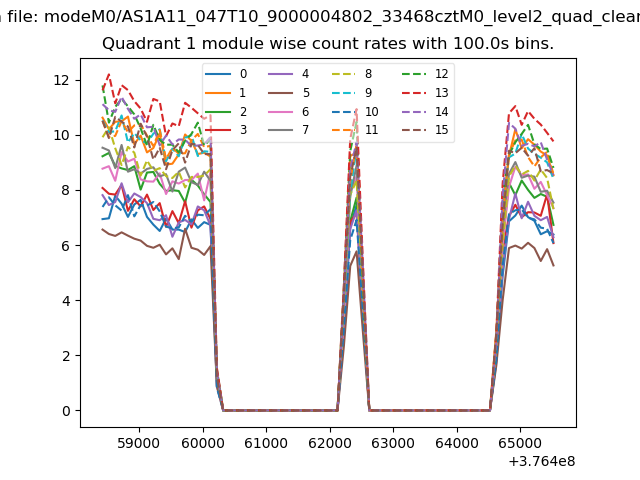 |
 |
| Module-wise count rates for Quadrant C Data is divided into 100 sec bins |
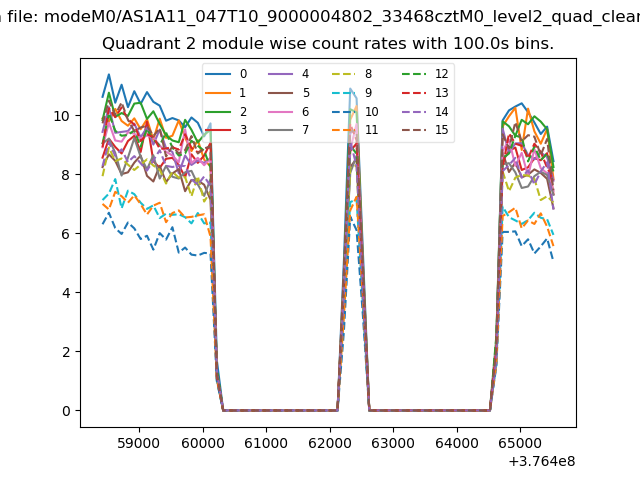 |
 |
| Module-wise count rates for Quadrant D Data is divided into 100 sec bins |
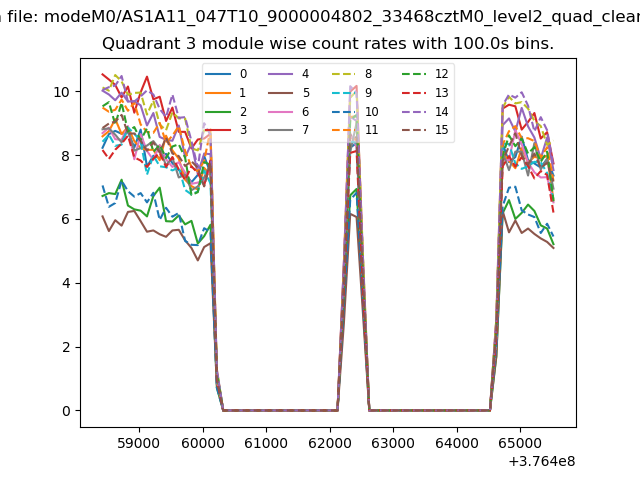 |
 |
| Parameter | Plot |
|---|---|
| CZT HV Monitor | 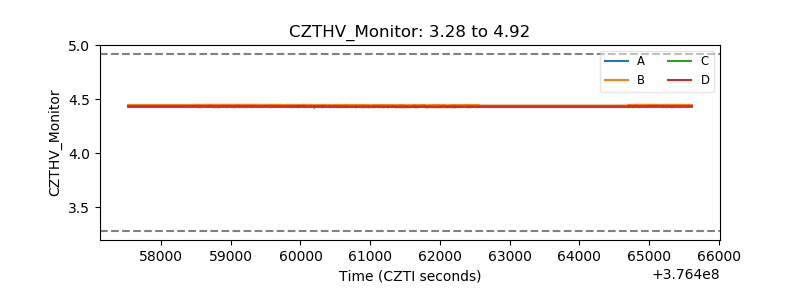 |
| D_VDD |  |
| Temperature 1 | 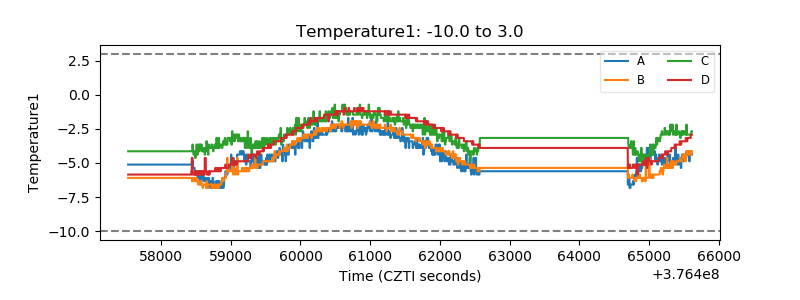 |
| Veto HV Monitor | 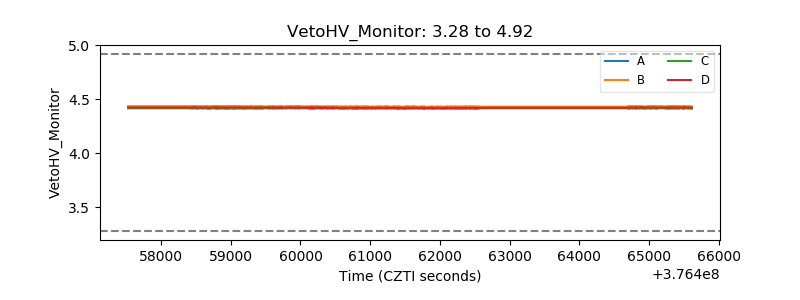 |
| Veto LLD | 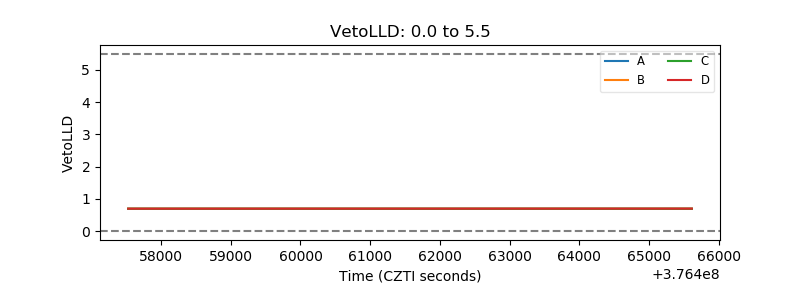 |
| Alpha Counter | 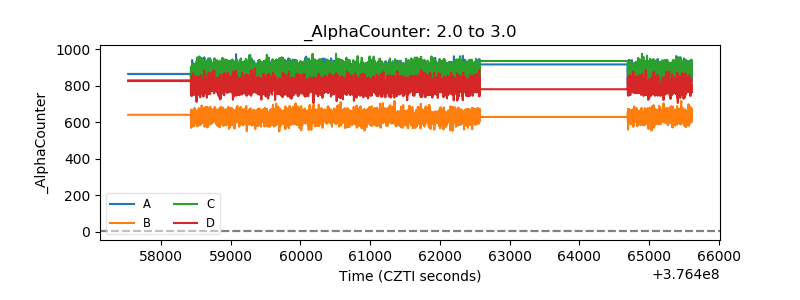 |
| _CPM_Rate | 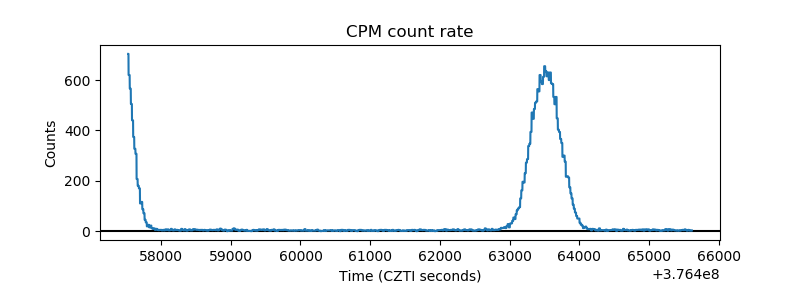 |
| CZT Counter |  |
| +2.5 Volts monitor |  |
| +5 Volts monitor |  |
| _ROLL_ROT | 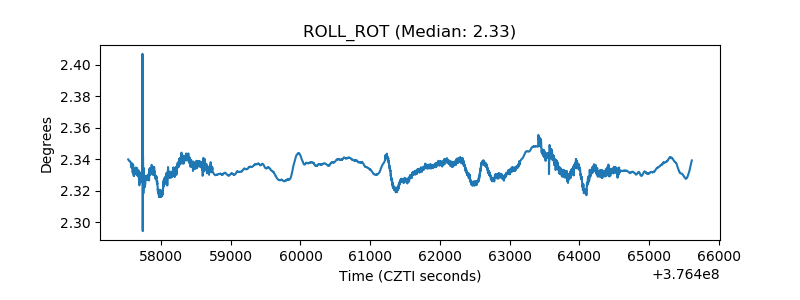 |
| _Roll_DEC | 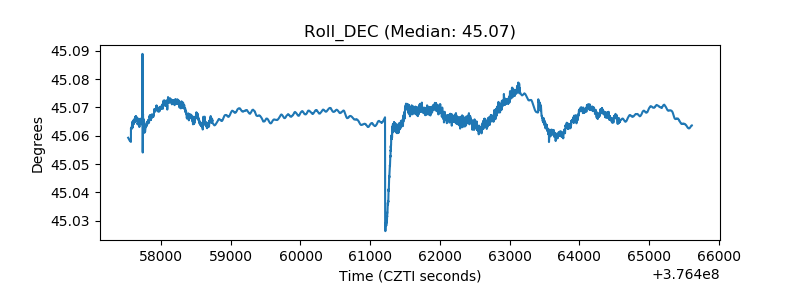 |
| _Roll_RA | 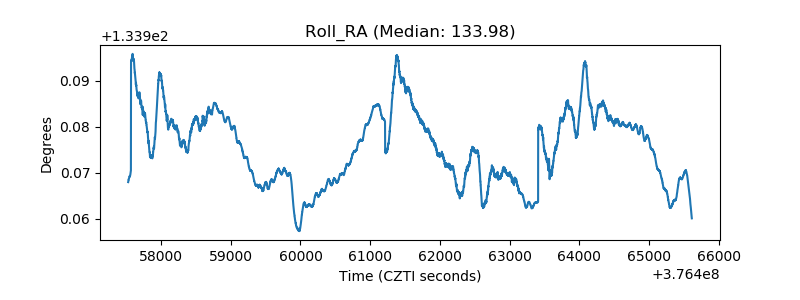 |
| Veto Counter | 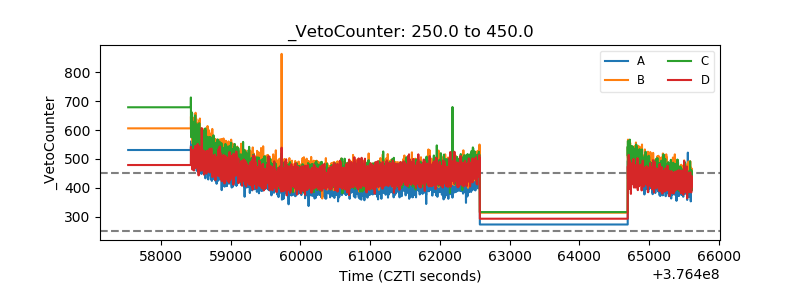 |