| Param | Original file | Final file |
|---|---|---|
| Filename | modeM0/AS1A11_047T10_9000004802_33470cztM0_level2.evt | modeM0/AS1A11_047T10_9000004802_33470cztM0_level2_quad_clean.evt |
| Size (bytes) | 461,704,320 | 63,167,040 |
| Size | 440.3 MB | 60.2 MB |
| Events in quadrant A | 2,448,412 | 394,149 |
| Events in quadrant B | 3,692,209 | 389,670 |
| Events in quadrant C | 2,895,067 | 386,478 |
| Events in quadrant D | 4,581,504 | 365,024 |
| Mode SS | |||
|---|---|---|---|
| Quadrant | BADHDUFLAG | Total packets | Discarded packets |
| A | 0 | 110 | 0 |
| B | 0 | 110 | 0 |
| C | 0 | 110 | 0 |
| D | 0 | 110 | 0 |
| Mode M9 | |||
|---|---|---|---|
| Quadrant | BADHDUFLAG | Total packets | Discarded packets |
| A | 0 | 27 | 0 |
| B | 0 | 27 | 0 |
| C | 0 | 27 | 0 |
| D | 0 | 28 | 0 |
| Mode M0 | |||
|---|---|---|---|
| Quadrant | BADHDUFLAG | Total packets | Discarded packets |
| A | 0 | 10800 | 3 |
| B | 0 | 14351 | 2 |
| C | 0 | 11661 | 2 |
| D | 0 | 17269 | 2 |
| Quadrant | Total seconds | Saturated seconds | Saturation percentage |
|---|---|---|---|
| A | 5387 | 3 | 0.055690% |
| B | 5387 | 220 | 4.083906% |
| C | 5387 | 62 | 1.150919% |
| D | 5387 | 264 | 4.900687% |
Noise dominated data is calculated using 1-second bins in cleaned event files. If a bin has >2000 counts, and if more than 50% of those come from <1% of pixels, then it is considered to be noise-dominated and hence unusable.
| Quadrant | # 1 sec bins | Bins with >0 counts | Bins with >2000 counts | High rate bins dominated by noise | Noise dominated (total time) | Noise dominated (detector-on time) | Marked lightcurve |
|---|---|---|---|---|---|---|---|
| A | 7090 | 5388 | 0 | 0 | 0.00% | 0.00% | 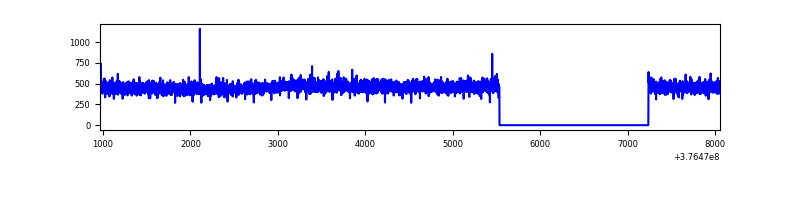 |
| B | 7090 | 5388 | 177 | 177 | 2.50% | 3.29% | 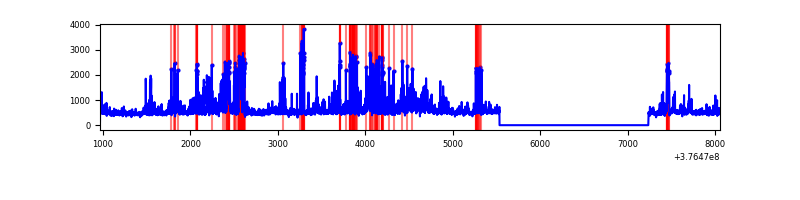 |
| C | 7090 | 5388 | 56 | 56 | 0.79% | 1.04% | 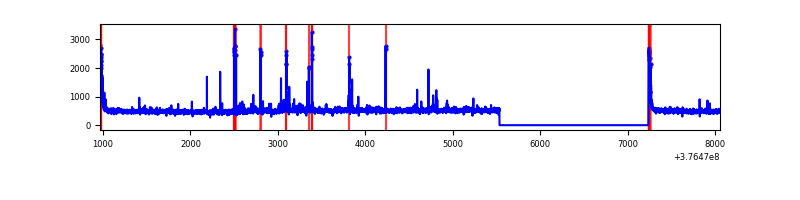 |
| D | 7090 | 5388 | 240 | 240 | 3.39% | 4.45% | 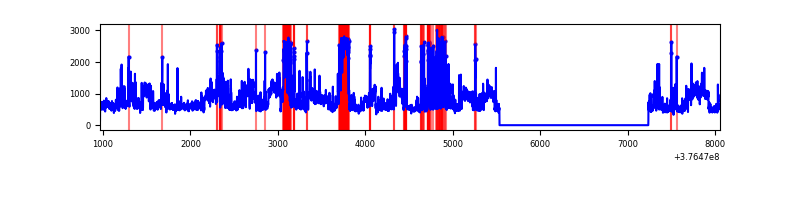 |
Top three noisy pixels from each quadrant. If the there are fewer than three noisy pixels in the level2.evt file, extra rows are filled as -1
| Pixel properties | Quadrant properties | ||||||
|---|---|---|---|---|---|---|---|
| Quadrant | DetID | PixID | Counts | Sigma | Mean | Median | Sigma |
| A | 13 | 254 | 8880 | 65.35 | 629 | 616 | 126.5 |
| A | 7 | 192 | 6840 | 49.21 | 629 | 616 | 126.5 |
| A | 13 | 6 | 6138 | 43.66 | 629 | 616 | 126.5 |
| B | 5 | 172 | 516874 | 4383.24 | 615 | 601 | 117.8 |
| B | 4 | 171 | 200999 | 1701.41 | 615 | 601 | 117.8 |
| B | 5 | 255 | 157497 | 1332.07 | 615 | 601 | 117.8 |
| C | 15 | 214 | 235712 | 1683.32 | 604 | 609 | 139.7 |
| C | 14 | 254 | 156789 | 1118.24 | 604 | 609 | 139.7 |
| C | 0 | 10 | 110589 | 787.45 | 604 | 609 | 139.7 |
| D | 8 | 195 | 1307771 | 8840.17 | 598 | 579 | 147.9 |
| D | 2 | 249 | 355462 | 2399.97 | 598 | 579 | 147.9 |
| D | 2 | 250 | 226019 | 1524.58 | 598 | 579 | 147.9 |
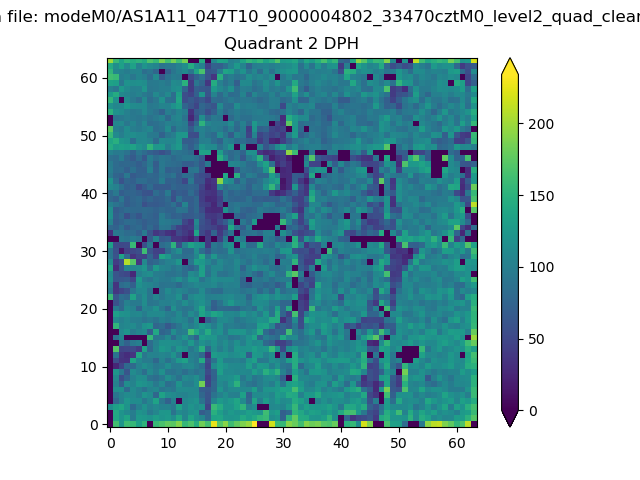
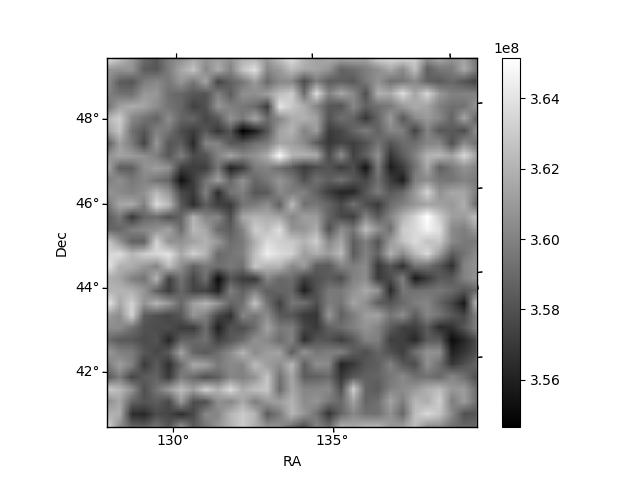
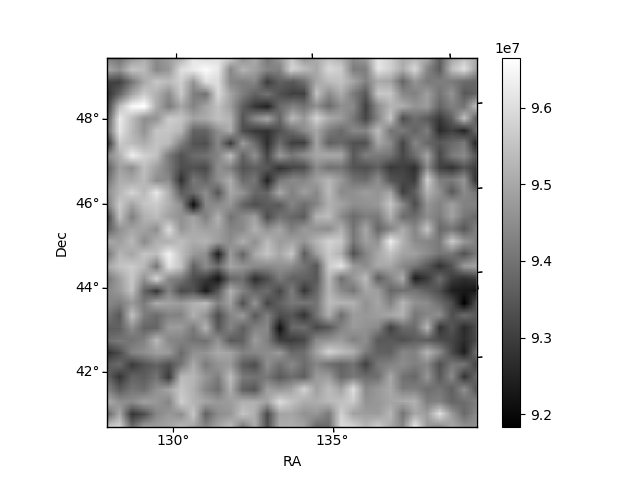
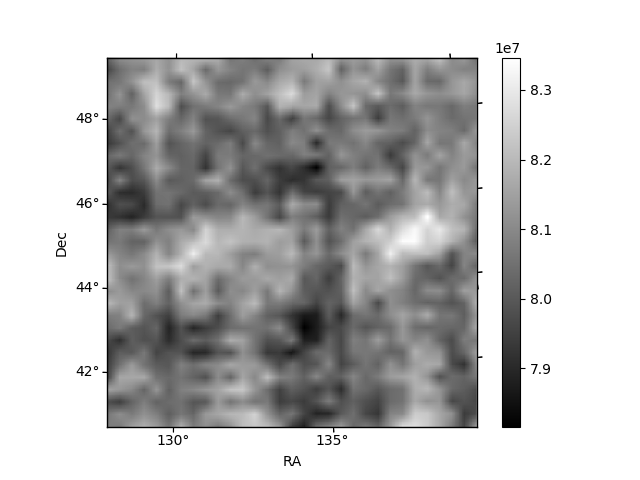
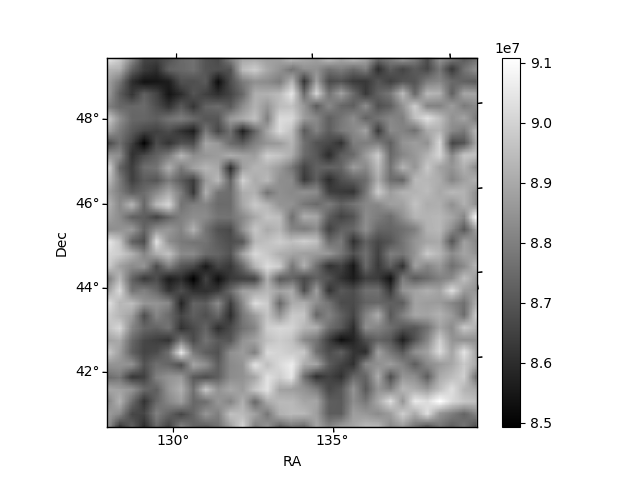
Histogram calculated using DETX and DETY for each event in the final _common_clean file
| Quadrant A | 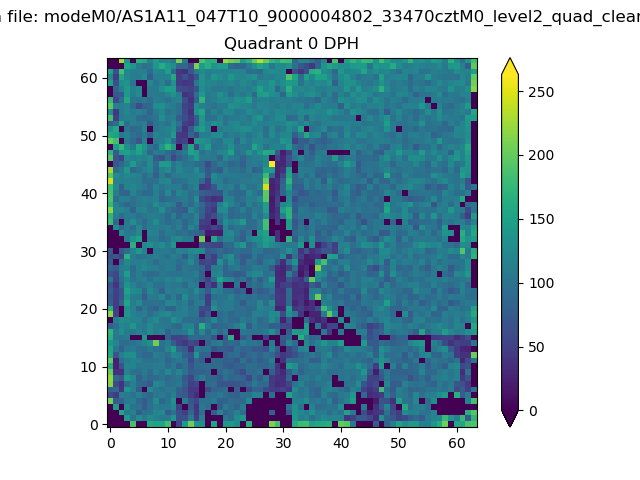 |
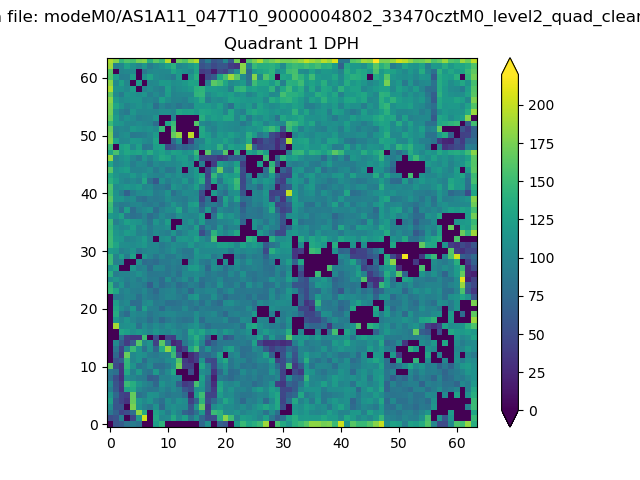 |
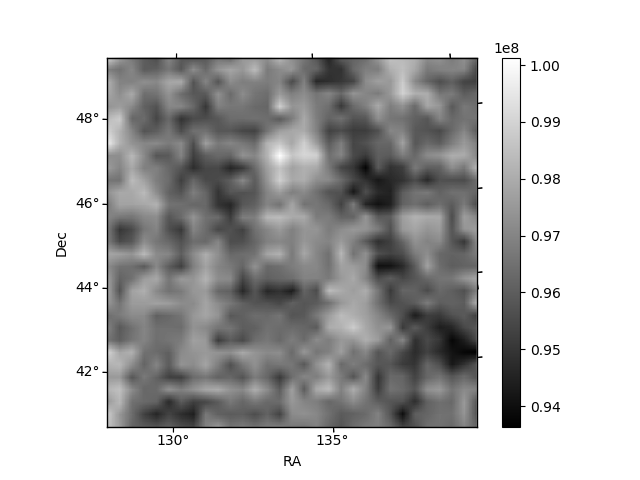
Quadrant B |
|---|---|---|---|
| Quadrant D | 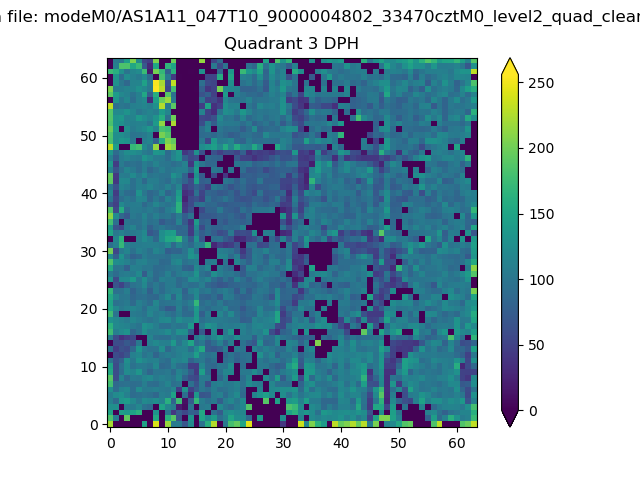 |
 |
Quadrant C |
| Plot type | Count rate plots | Images |
|---|---|---|
| Comparison with Poisson distribution Blue bars denote a histogram of data divided into 1 sec bins. Red curve is a Poisson curve with rate = median count rate of data. |
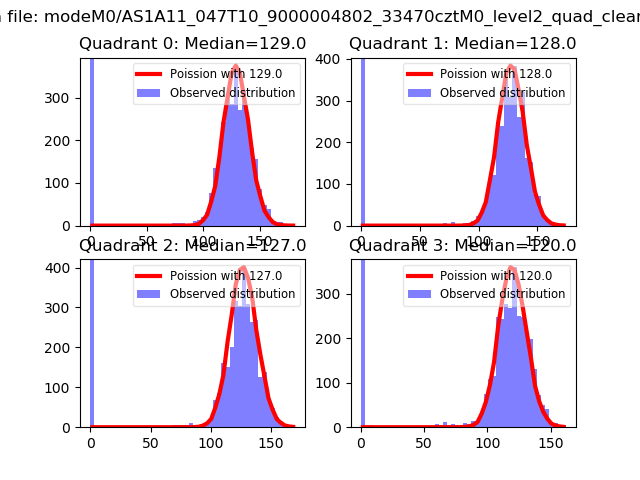 |
 |
| Quadrant-wise count rates Data is divided into 100 sec bins |
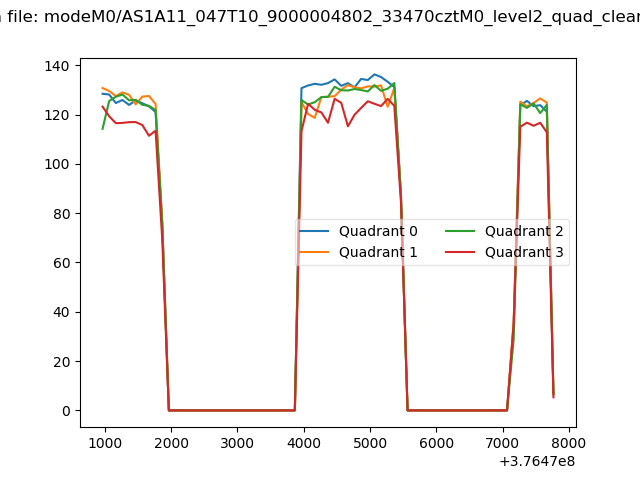 |
|
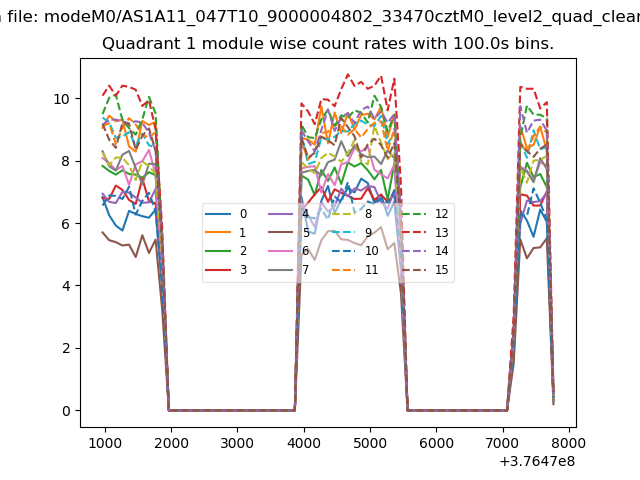
| Module-wise count rates for Quadrant A Data is divided into 100 sec bins |
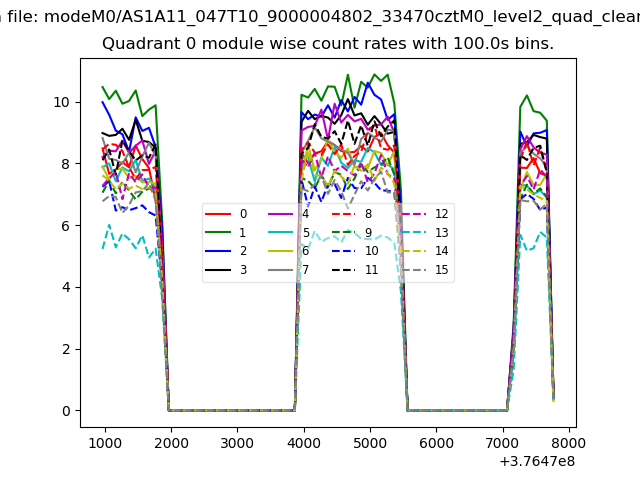 |
 |
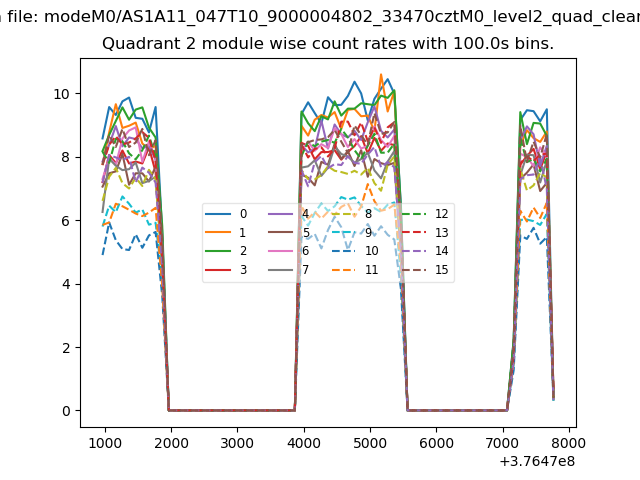
| Module-wise count rates for Quadrant B Data is divided into 100 sec bins |
 |
 |
| Module-wise count rates for Quadrant C Data is divided into 100 sec bins |
 |
 |
| Module-wise count rates for Quadrant D Data is divided into 100 sec bins |
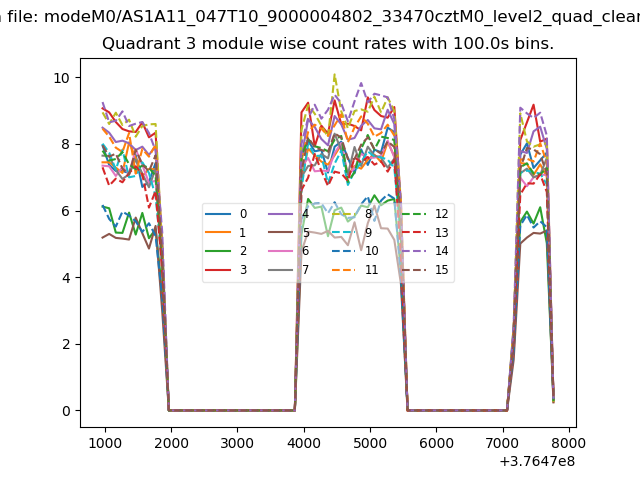 |
 |
| Parameter | Plot |
|---|---|
| CZT HV Monitor | 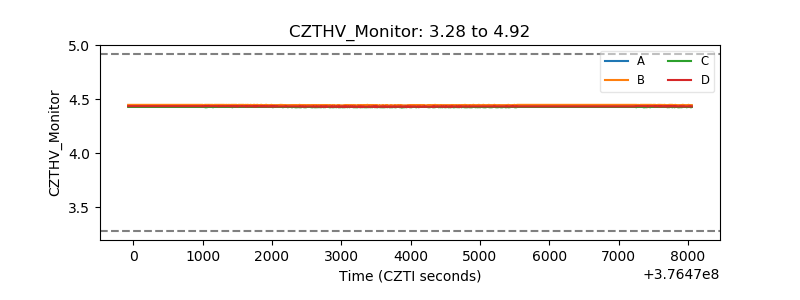 |
| D_VDD | 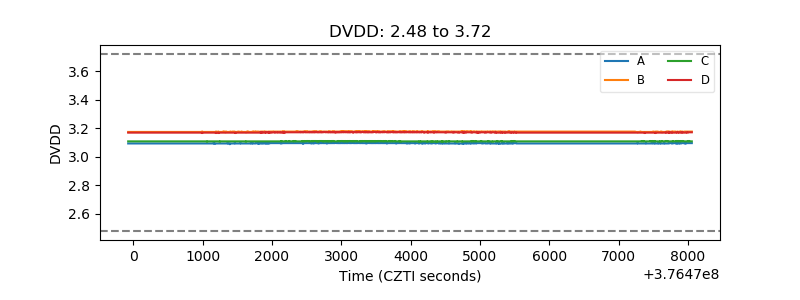 |
| Temperature 1 | 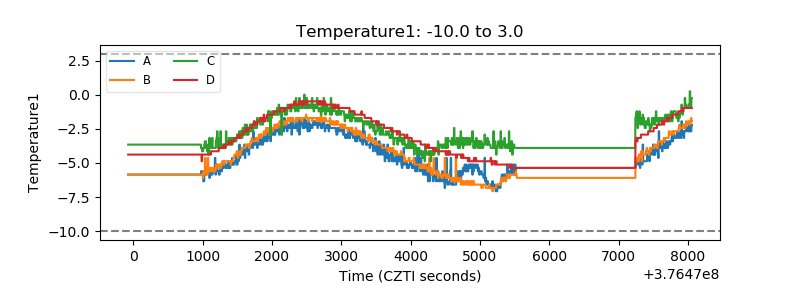 |
| Veto HV Monitor | 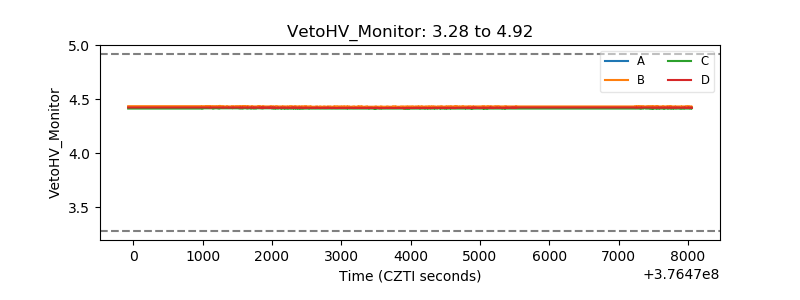 |
| Veto LLD | 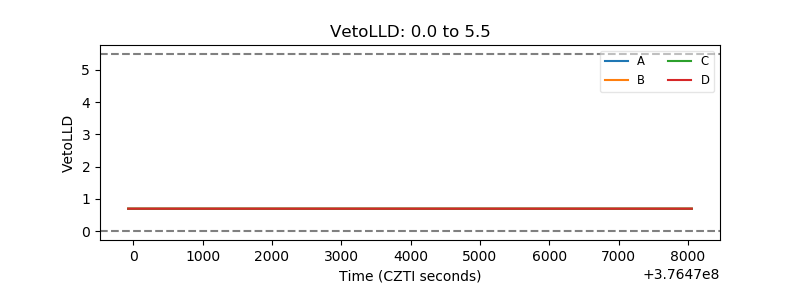 |
| Alpha Counter | 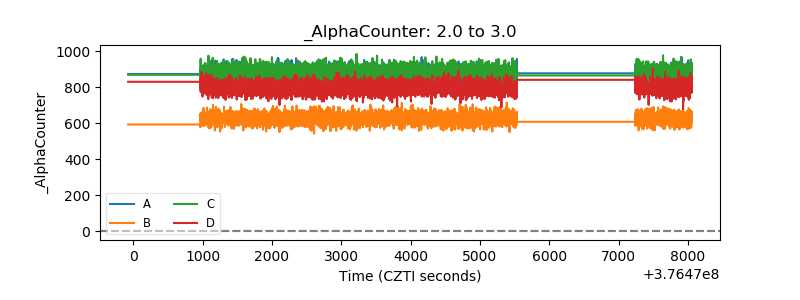 |
| _CPM_Rate | 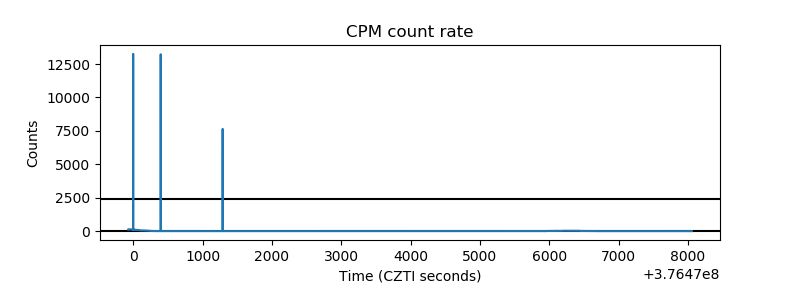 |
| CZT Counter | 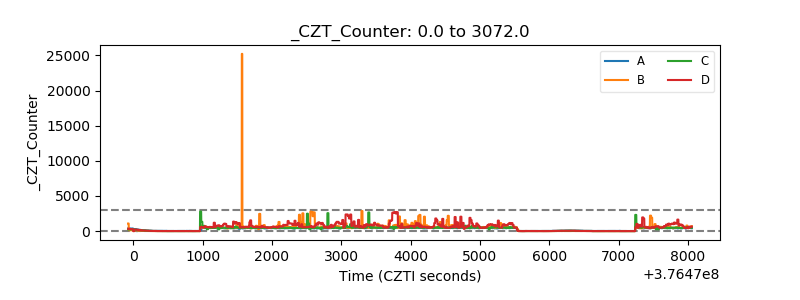 |
| +2.5 Volts monitor |  |
| +5 Volts monitor | 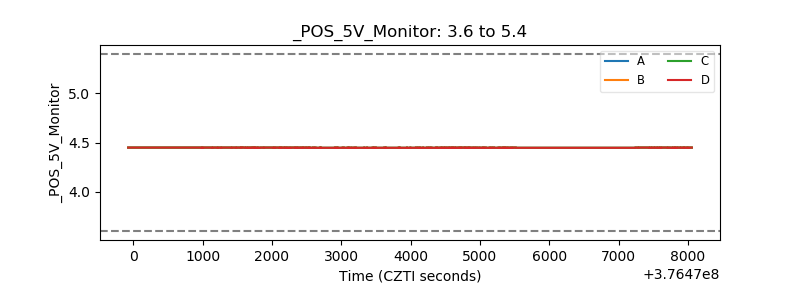 |
| _ROLL_ROT | 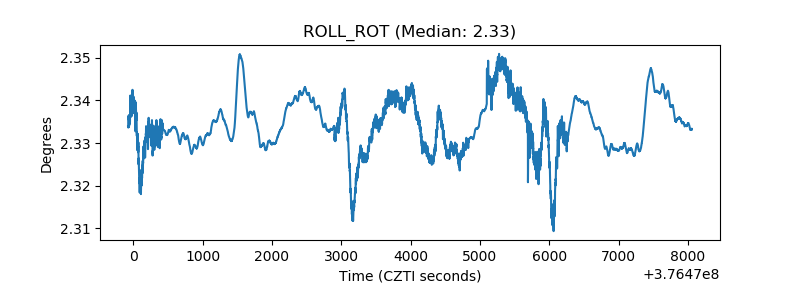 |
| _Roll_DEC | 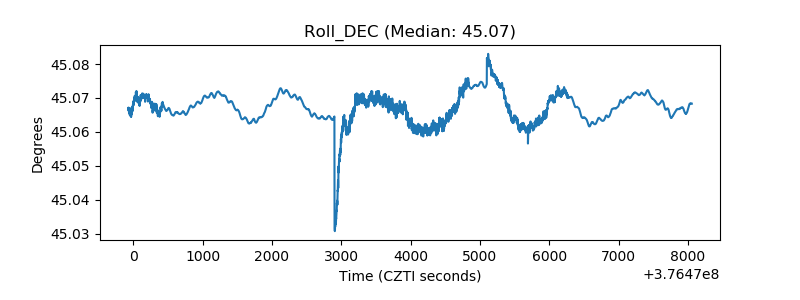 |
| _Roll_RA | 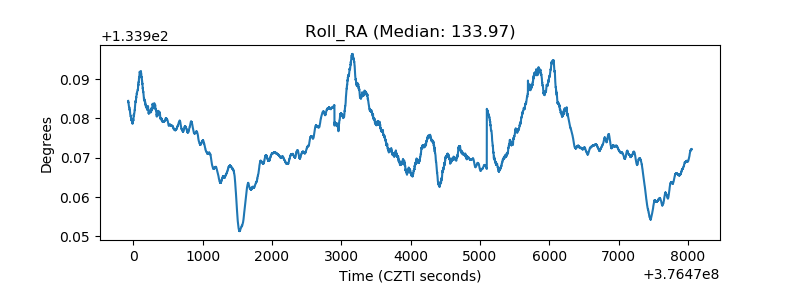 |
| Veto Counter | 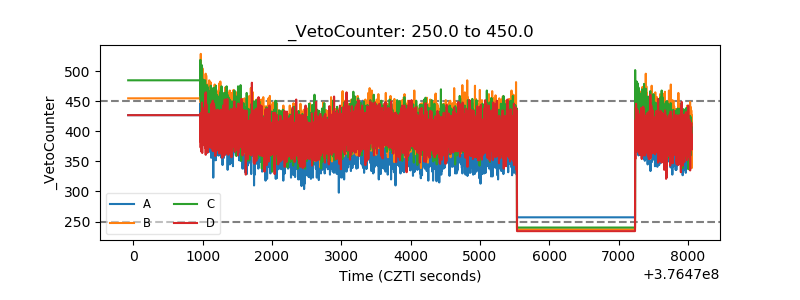 |