| Param | Original file | Final file |
|---|---|---|
| Filename | modeM0/AS1A11_047T10_9000004802_33475cztM0_level2.evt | modeM0/AS1A11_047T10_9000004802_33475cztM0_level2_quad_clean.evt |
| Size (bytes) | 422,902,080 | 59,474,880 |
| Size | 403.3 MB | 56.7 MB |
| Events in quadrant A | 2,134,450 | 381,689 |
| Events in quadrant B | 3,121,887 | 371,431 |
| Events in quadrant C | 2,345,441 | 371,109 |
| Events in quadrant D | 4,883,526 | 343,332 |
| Mode SS | |||
|---|---|---|---|
| Quadrant | BADHDUFLAG | Total packets | Discarded packets |
| A | 0 | 94 | 0 |
| B | 0 | 94 | 0 |
| C | 0 | 94 | 0 |
| D | 0 | 94 | 0 |
| Mode M9 | |||
|---|---|---|---|
| Quadrant | BADHDUFLAG | Total packets | Discarded packets |
| A | 0 | 11 | 0 |
| B | 0 | 11 | 0 |
| C | 0 | 11 | 0 |
| D | 0 | 12 | 0 |
| Mode M0 | |||
|---|---|---|---|
| Quadrant | BADHDUFLAG | Total packets | Discarded packets |
| A | 0 | 9529 | 2 |
| B | 0 | 12192 | 1 |
| C | 0 | 9703 | 1 |
| D | 0 | 17804 | 1 |
| Quadrant | Total seconds | Saturated seconds | Saturation percentage |
|---|---|---|---|
| A | 4745 | 1 | 0.021075% |
| B | 4745 | 161 | 3.393045% |
| C | 4745 | 5 | 0.105374% |
| D | 4745 | 624 | 13.150685% |
Noise dominated data is calculated using 1-second bins in cleaned event files. If a bin has >2000 counts, and if more than 50% of those come from <1% of pixels, then it is considered to be noise-dominated and hence unusable.
| Quadrant | # 1 sec bins | Bins with >0 counts | Bins with >2000 counts | High rate bins dominated by noise | Noise dominated (total time) | Noise dominated (detector-on time) | Marked lightcurve |
|---|---|---|---|---|---|---|---|
| A | 4745 | 4745 | 0 | 0 | 0.00% | 0.00% |  |
| B | 4745 | 4745 | 108 | 108 | 2.28% | 2.28% | 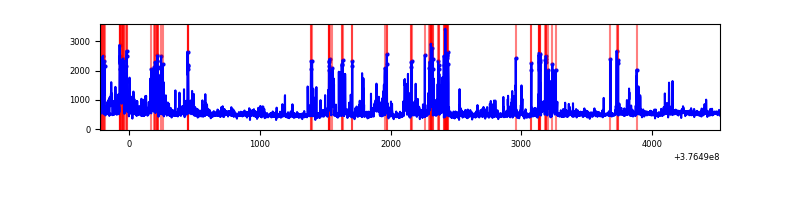 |
| C | 4745 | 4745 | 3 | 3 | 0.06% | 0.06% | 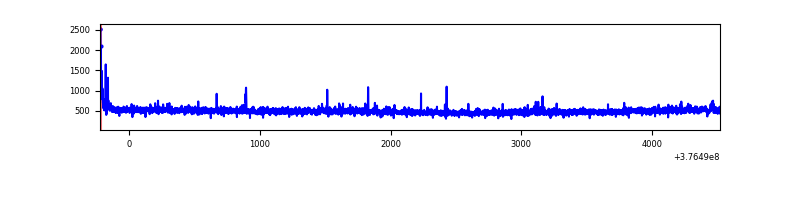 |
| D | 4745 | 4745 | 583 | 583 | 12.29% | 12.29% | 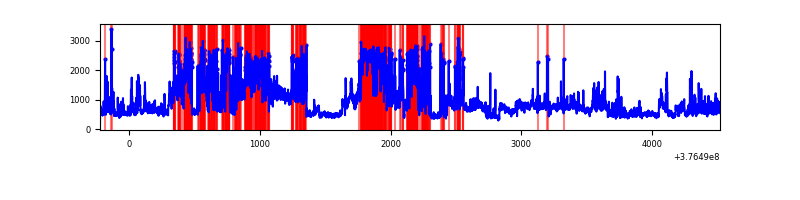 |
Top three noisy pixels from each quadrant. If the there are fewer than three noisy pixels in the level2.evt file, extra rows are filled as -1
| Pixel properties | Quadrant properties | ||||||
|---|---|---|---|---|---|---|---|
| Quadrant | DetID | PixID | Counts | Sigma | Mean | Median | Sigma |
| A | 13 | 254 | 8773 | 74.49 | 548 | 538 | 110.6 |
| A | 13 | 6 | 8140 | 68.76 | 548 | 538 | 110.6 |
| A | 3 | 137 | 5443 | 44.37 | 548 | 538 | 110.6 |
| B | 5 | 172 | 336628 | 3202.17 | 541 | 527 | 105.0 |
| B | 5 | 255 | 276414 | 2628.49 | 541 | 527 | 105.0 |
| B | 0 | 230 | 169213 | 1607.14 | 541 | 527 | 105.0 |
| C | 15 | 214 | 201433 | 1631.39 | 531 | 534 | 123.1 |
| C | 0 | 10 | 27548 | 219.37 | 531 | 534 | 123.1 |
| C | 14 | 67 | 14169 | 110.72 | 531 | 534 | 123.1 |
| D | 2 | 250 | 1407189 | 10622.2 | 500 | 489 | 132.4 |
| D | 8 | 195 | 1003327 | 7572.58 | 500 | 489 | 132.4 |
| D | 2 | 249 | 210403 | 1585.09 | 500 | 489 | 132.4 |
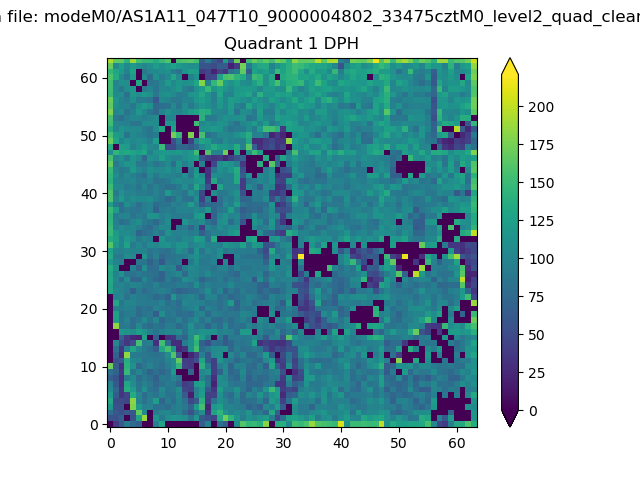
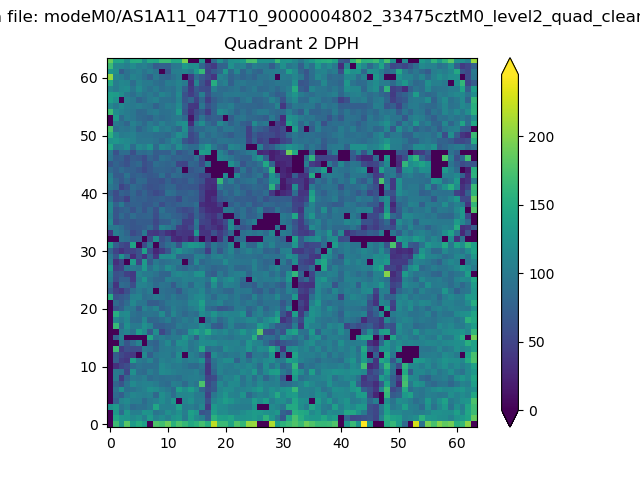
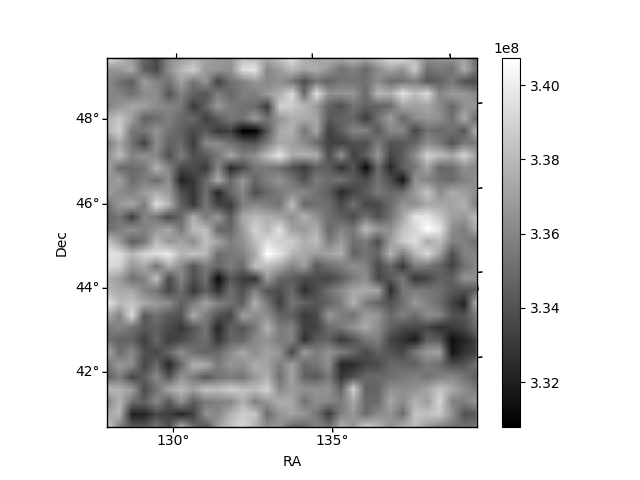
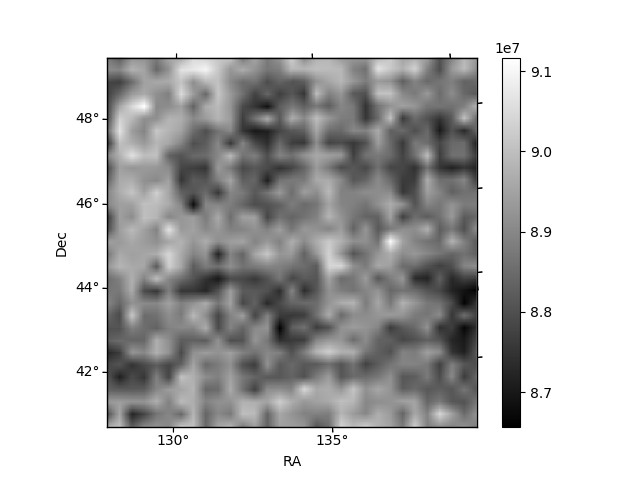
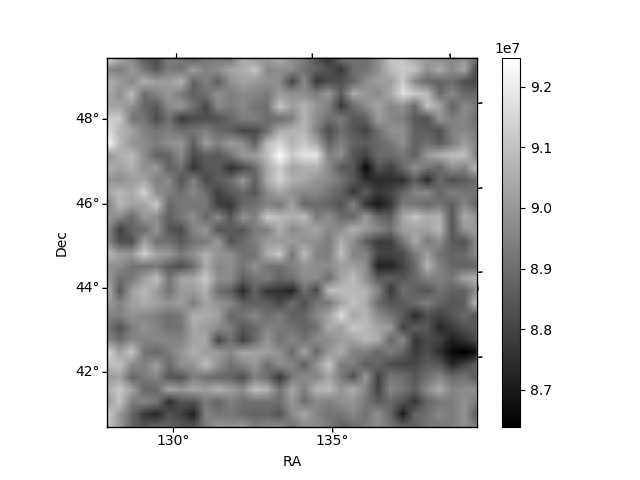
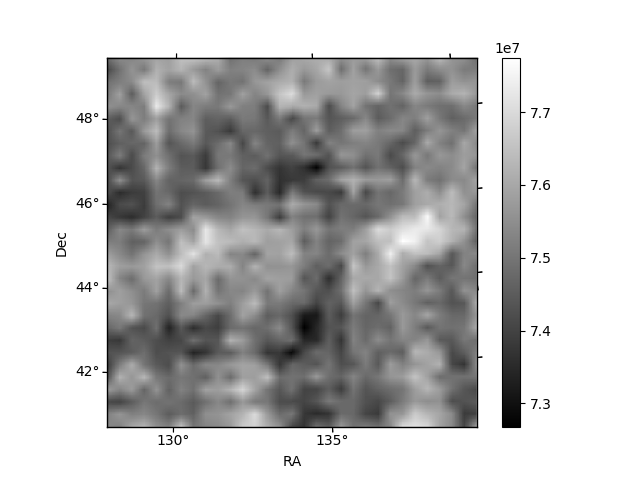
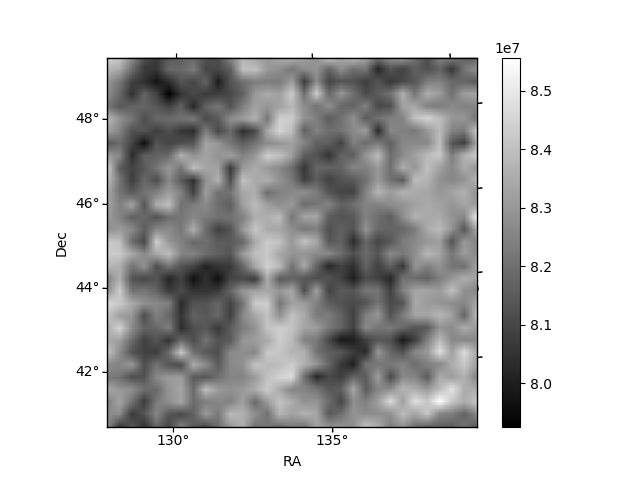
Histogram calculated using DETX and DETY for each event in the final _common_clean file
| Quadrant A | 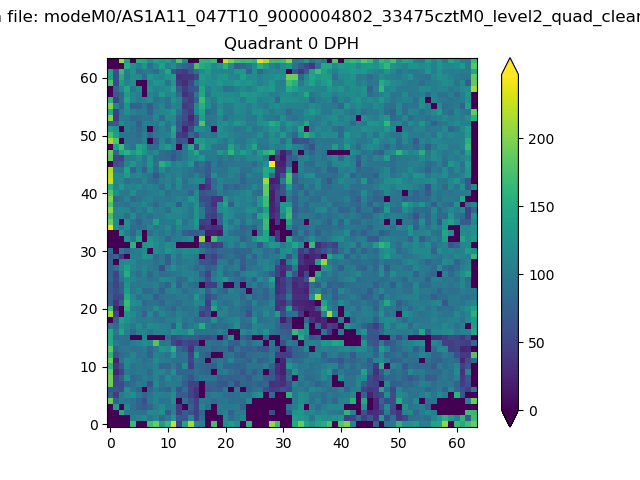 |
 |
Quadrant B |
|---|---|---|---|
| Quadrant D | 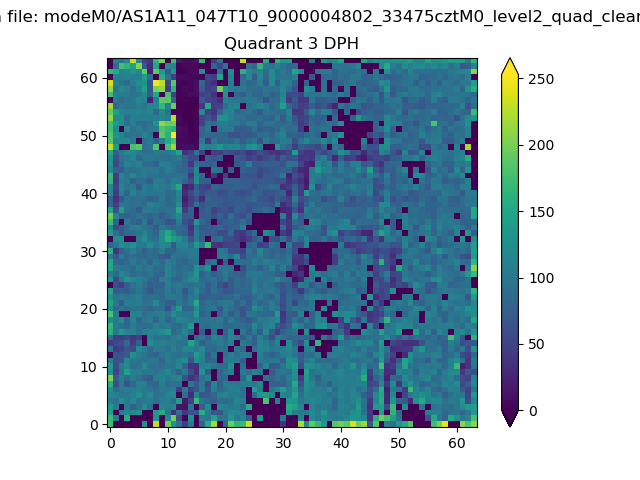 |
 |
Quadrant C |
| Plot type | Count rate plots | Images |
|---|---|---|
| Comparison with Poisson distribution Blue bars denote a histogram of data divided into 1 sec bins. Red curve is a Poisson curve with rate = median count rate of data. |
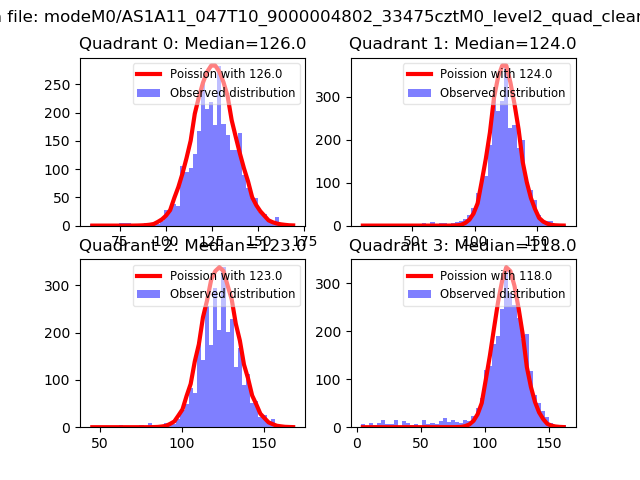 |
 |
| Quadrant-wise count rates Data is divided into 100 sec bins |
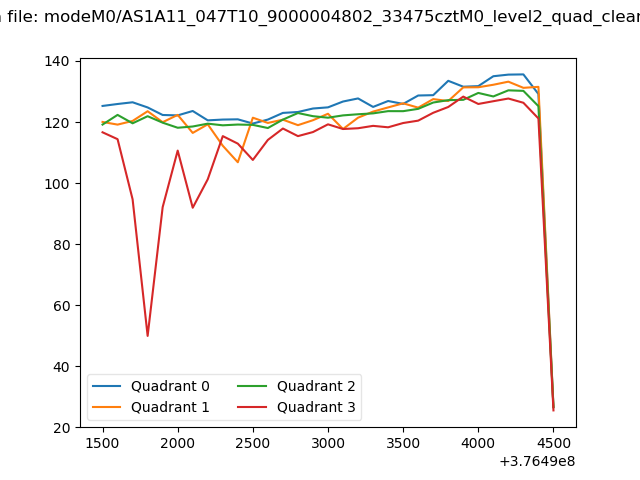 |
|
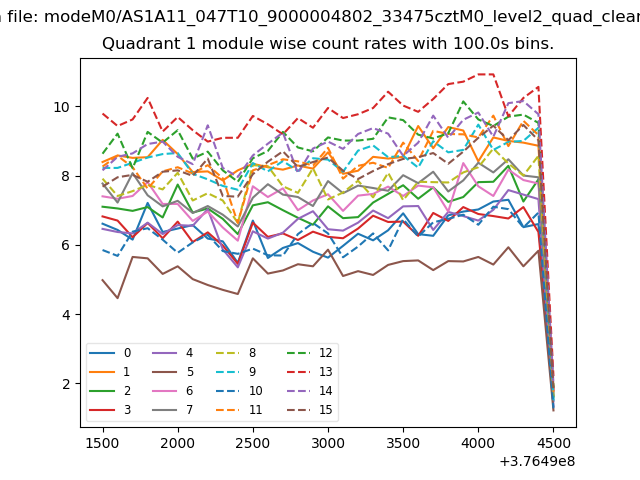
| Module-wise count rates for Quadrant A Data is divided into 100 sec bins |
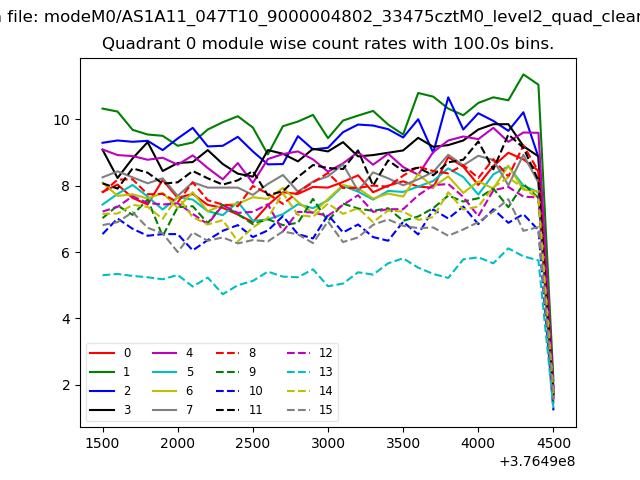 |
 |
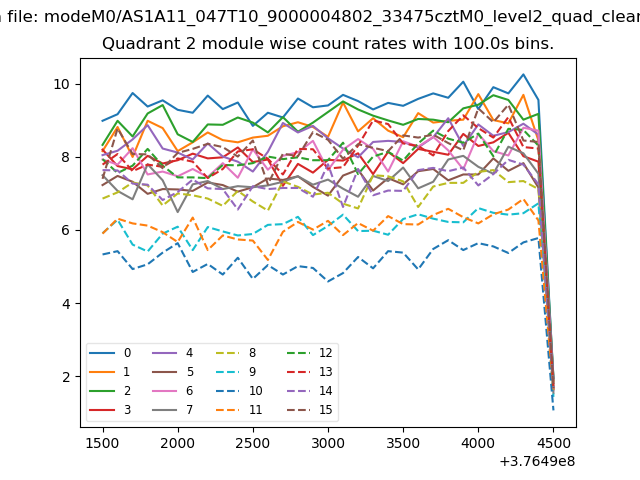
| Module-wise count rates for Quadrant B Data is divided into 100 sec bins |
 |
 |
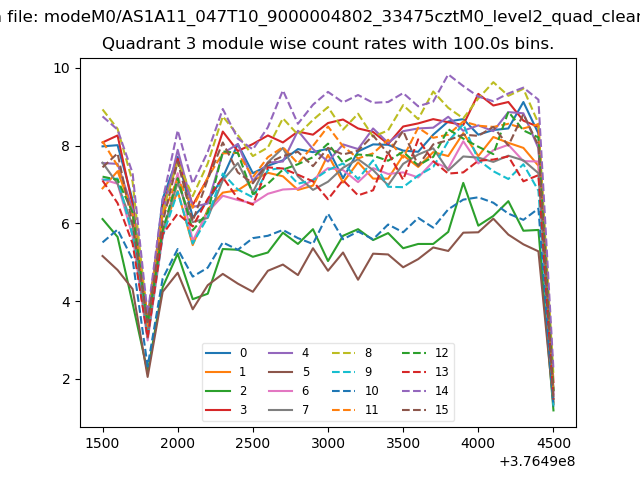
| Module-wise count rates for Quadrant C Data is divided into 100 sec bins |
 |
 |
| Module-wise count rates for Quadrant D Data is divided into 100 sec bins |
 |
 |
| Parameter | Plot |
|---|---|
| CZT HV Monitor | 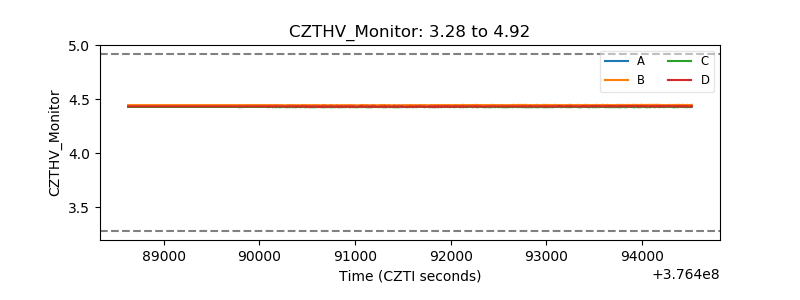 |
| D_VDD | 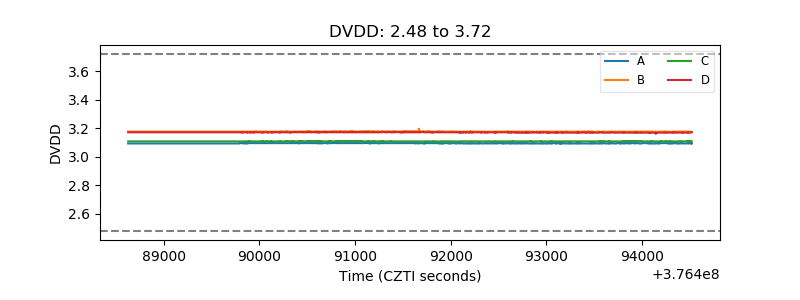 |
| Temperature 1 | 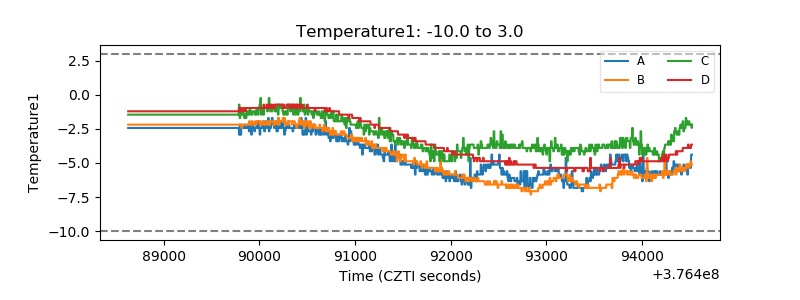 |
| Veto HV Monitor |  |
| Veto LLD | 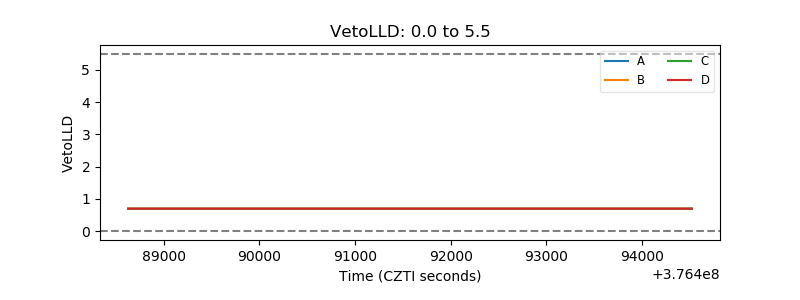 |
| Alpha Counter | 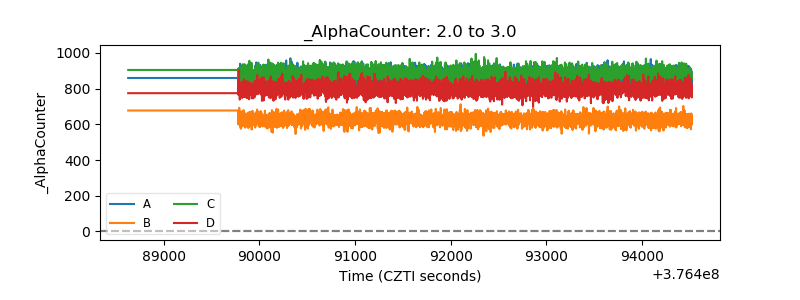 |
| _CPM_Rate | 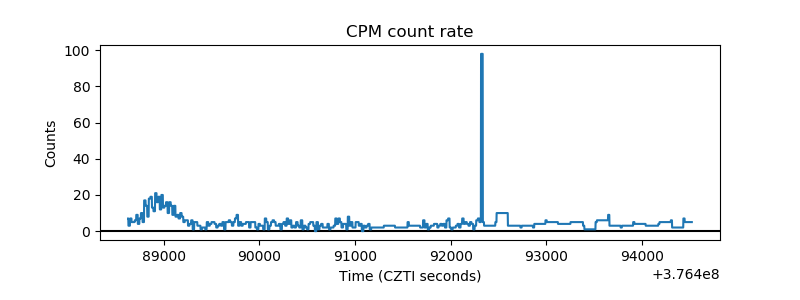 |
| CZT Counter | 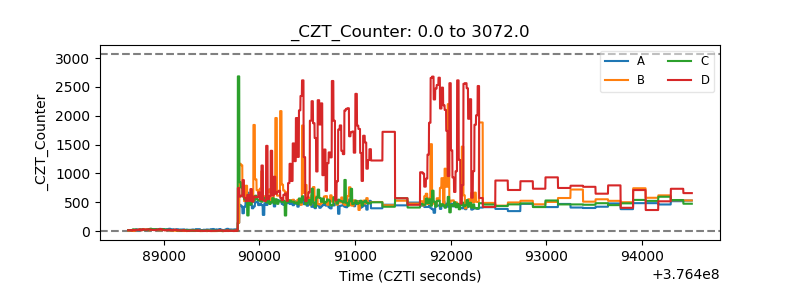 |
| +2.5 Volts monitor |  |
| +5 Volts monitor |  |
| _ROLL_ROT | 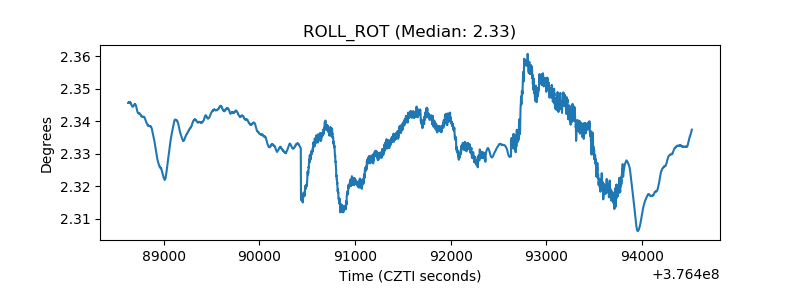 |
| _Roll_DEC | 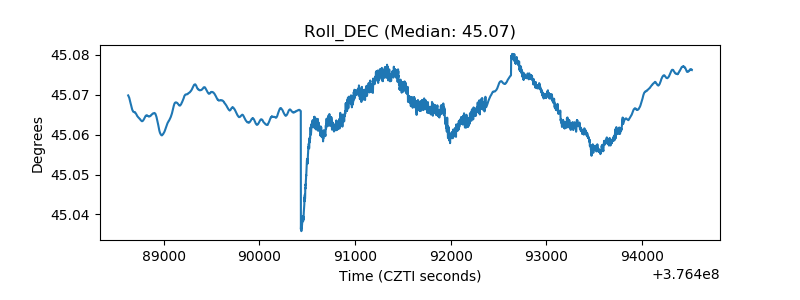 |
| _Roll_RA | 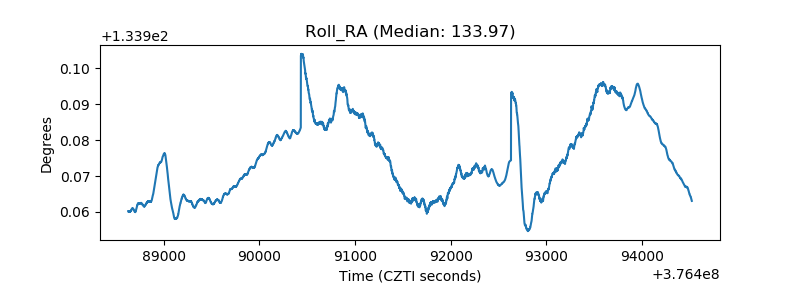 |
| Veto Counter | 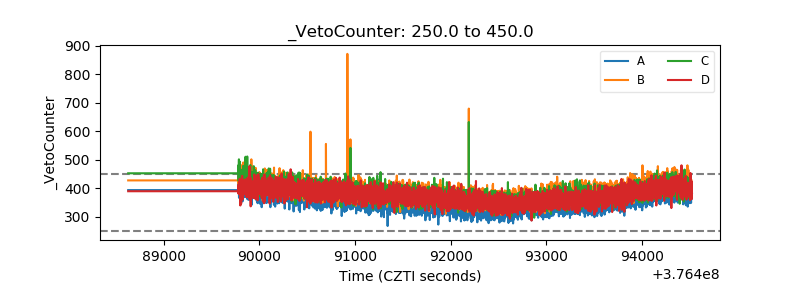 |