| Param | Original file | Final file |
|---|---|---|
| Filename | modeM0/AS1A11_047T10_9000004802_33476cztM0_level2.evt | modeM0/AS1A11_047T10_9000004802_33476cztM0_level2_quad_clean.evt |
| Size (bytes) | 963,106,560 | 173,488,320 |
| Size | 918.5 MB | 165.5 MB |
| Events in quadrant A | 5,377,631 | 1,140,383 |
| Events in quadrant B | 7,900,926 | 1,105,618 |
| Events in quadrant C | 6,037,016 | 1,115,800 |
| Events in quadrant D | 9,057,174 | 1,078,329 |
| Mode SS | |||
|---|---|---|---|
| Quadrant | BADHDUFLAG | Total packets | Discarded packets |
| A | 0 | 242 | 0 |
| B | 0 | 242 | 0 |
| C | 0 | 242 | 0 |
| D | 0 | 242 | 0 |
| Mode M9 | |||
|---|---|---|---|
| Quadrant | BADHDUFLAG | Total packets | Discarded packets |
| A | 0 | 42 | 0 |
| B | 0 | 42 | 0 |
| C | 0 | 42 | 0 |
| D | 0 | 42 | 0 |
| Mode M0 | |||
|---|---|---|---|
| Quadrant | BADHDUFLAG | Total packets | Discarded packets |
| A | 0 | 23727 | 3 |
| B | 0 | 30947 | 3 |
| C | 0 | 24911 | 3 |
| D | 0 | 34897 | 3 |
| Quadrant | Total seconds | Saturated seconds | Saturation percentage |
|---|---|---|---|
| A | 11772 | 12 | 0.101937% |
| B | 11772 | 458 | 3.890588% |
| C | 11772 | 60 | 0.509684% |
| D | 11772 | 242 | 2.055725% |
Noise dominated data is calculated using 1-second bins in cleaned event files. If a bin has >2000 counts, and if more than 50% of those come from <1% of pixels, then it is considered to be noise-dominated and hence unusable.
| Quadrant | # 1 sec bins | Bins with >0 counts | Bins with >2000 counts | High rate bins dominated by noise | Noise dominated (total time) | Noise dominated (detector-on time) | Marked lightcurve |
|---|---|---|---|---|---|---|---|
| A | 16011 | 11775 | 0 | 0 | 0.00% | 0.00% | 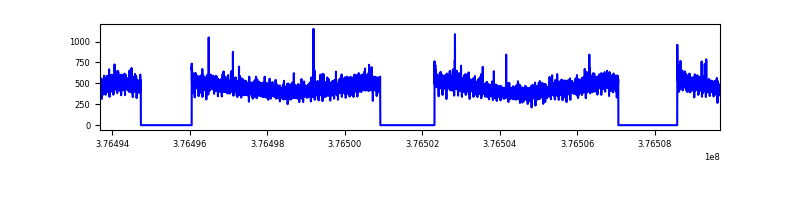 |
| B | 16011 | 11775 | 335 | 335 | 2.09% | 2.85% | 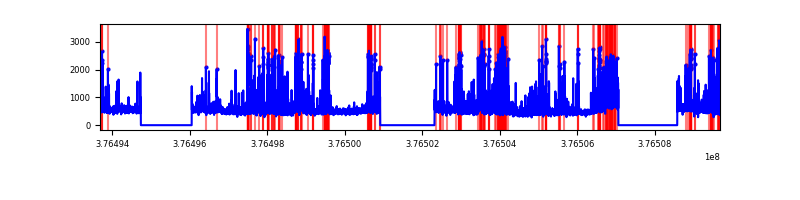 |
| C | 16011 | 11775 | 35 | 35 | 0.22% | 0.30% | 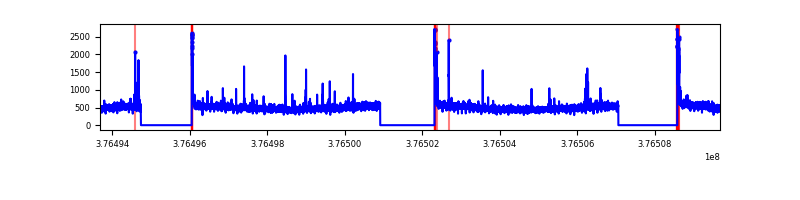 |
| D | 16011 | 11775 | 201 | 201 | 1.26% | 1.71% | 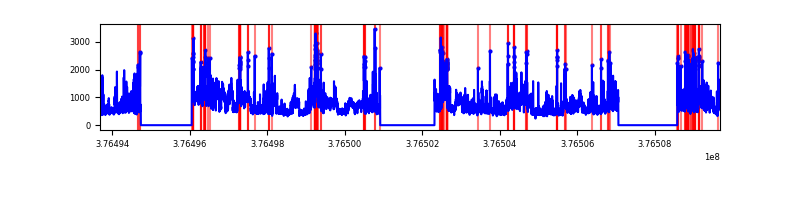 |
Top three noisy pixels from each quadrant. If the there are fewer than three noisy pixels in the level2.evt file, extra rows are filled as -1
| Pixel properties | Quadrant properties | ||||||
|---|---|---|---|---|---|---|---|
| Quadrant | DetID | PixID | Counts | Sigma | Mean | Median | Sigma |
| A | 13 | 254 | 22183 | 75.28 | 1379 | 1352 | 276.7 |
| A | 13 | 6 | 16473 | 54.64 | 1379 | 1352 | 276.7 |
| A | 7 | 192 | 14436 | 47.28 | 1379 | 1352 | 276.7 |
| B | 5 | 172 | 838746 | 3255.55 | 1351 | 1316 | 257.2 |
| B | 0 | 213 | 641054 | 2487.01 | 1351 | 1316 | 257.2 |
| B | 5 | 255 | 424685 | 1645.87 | 1351 | 1316 | 257.2 |
| C | 15 | 214 | 502289 | 1629.91 | 1332 | 1343 | 307.3 |
| C | 0 | 10 | 143770 | 463.41 | 1332 | 1343 | 307.3 |
| C | 1 | 23 | 46330 | 146.37 | 1332 | 1343 | 307.3 |
| D | 8 | 195 | 2617784 | 7323.76 | 1314 | 1286 | 357.3 |
| D | 2 | 250 | 491202 | 1371.31 | 1314 | 1286 | 357.3 |
| D | 2 | 120 | 233222 | 649.2 | 1314 | 1286 | 357.3 |
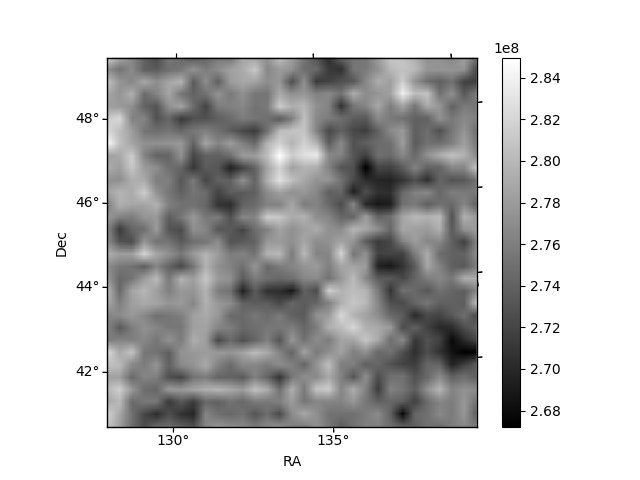
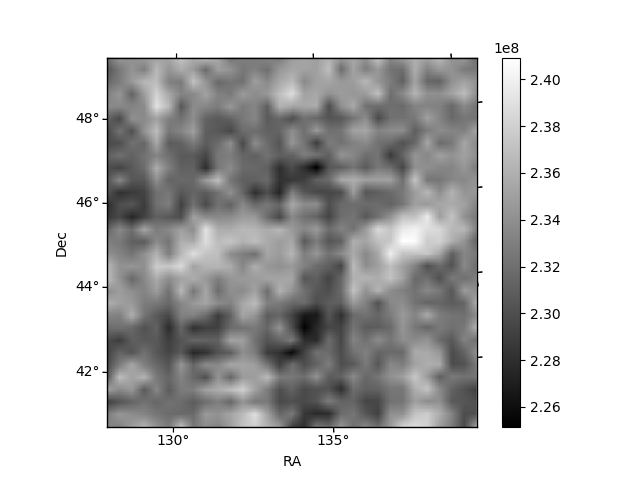
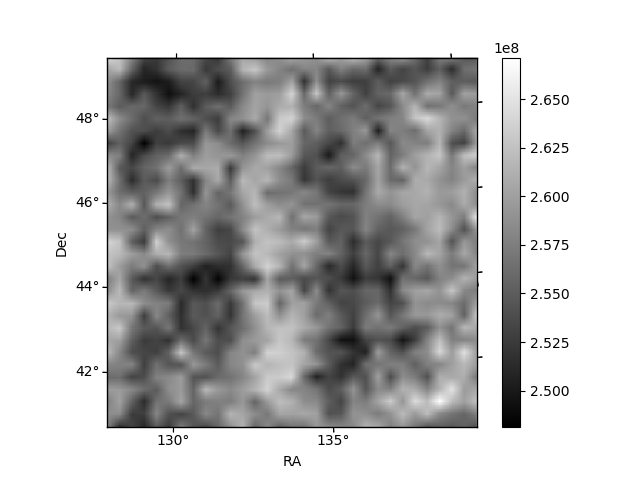
Histogram calculated using DETX and DETY for each event in the final _common_clean file
| Quadrant A | 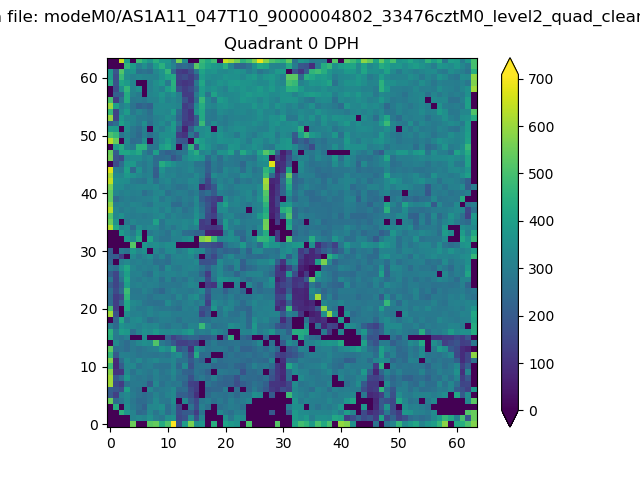 |
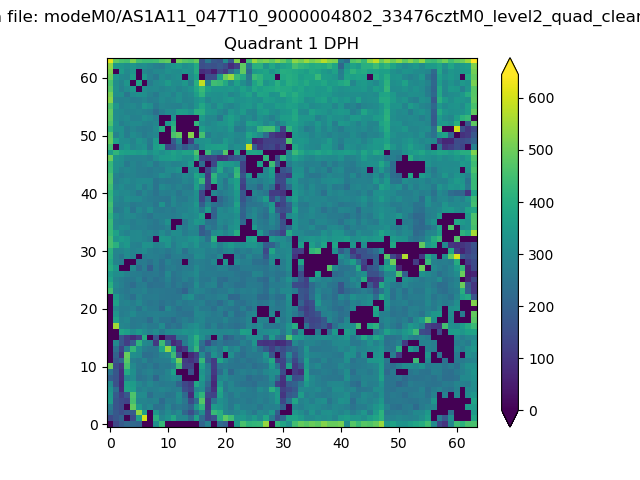 |
Quadrant B |
|---|---|---|---|
| Quadrant D | 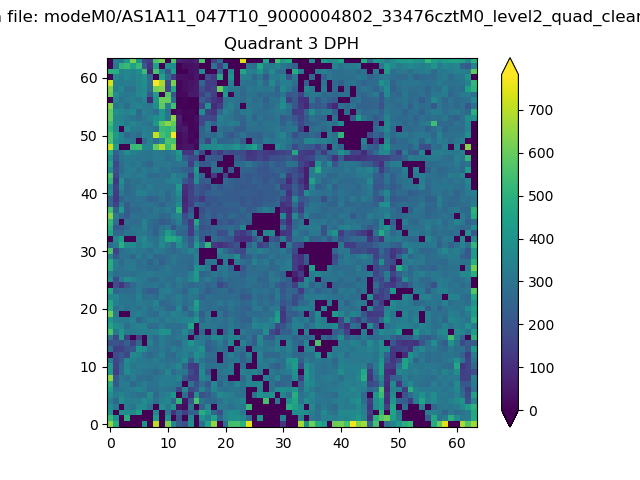 |
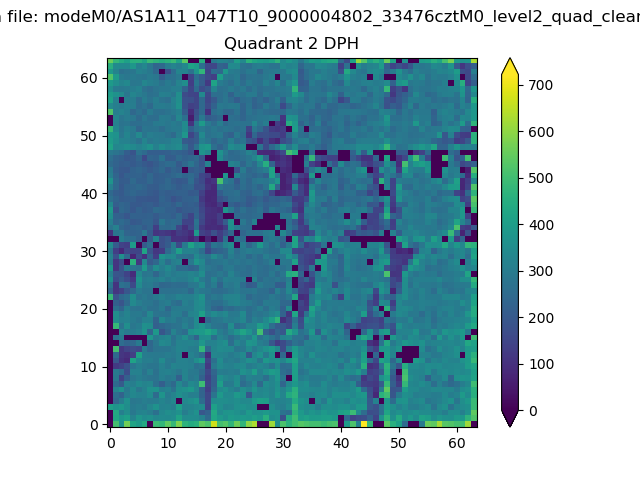 |
Quadrant C |
| Plot type | Count rate plots | Images |
|---|---|---|
| Comparison with Poisson distribution Blue bars denote a histogram of data divided into 1 sec bins. Red curve is a Poisson curve with rate = median count rate of data. |
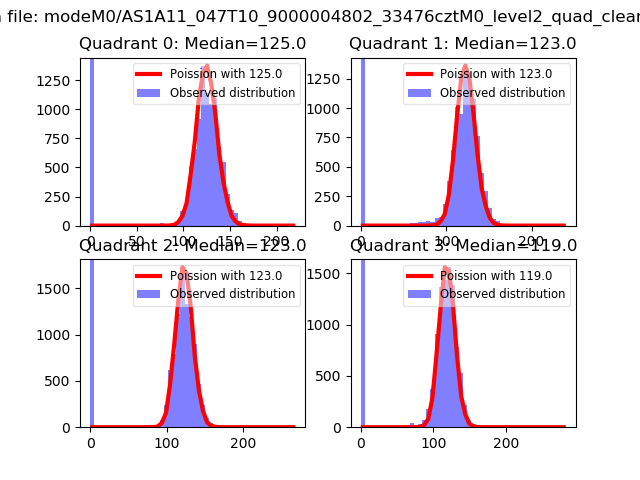 |
 |
| Quadrant-wise count rates Data is divided into 100 sec bins |
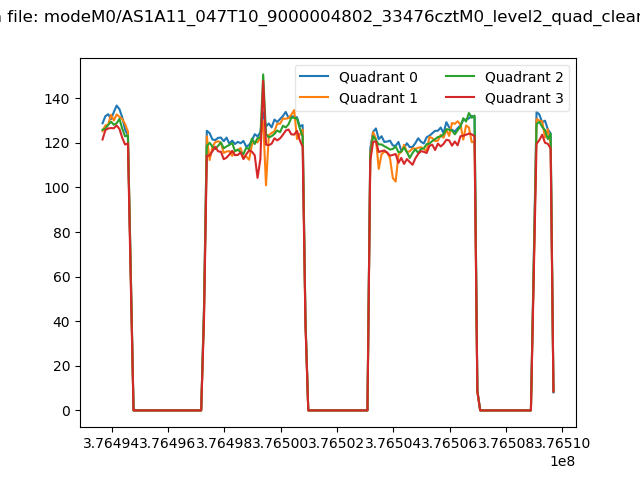 |
|
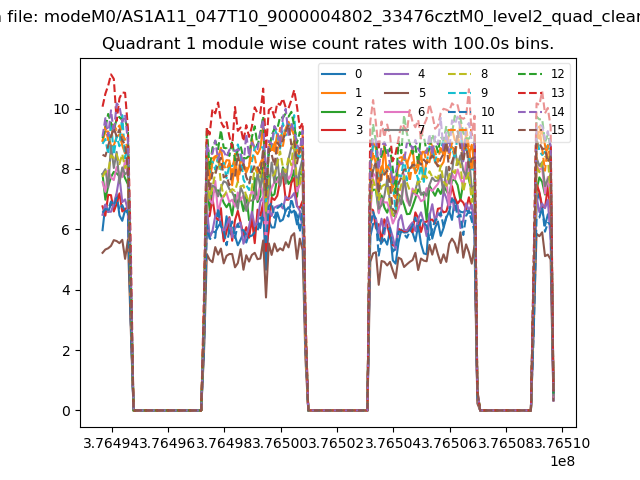
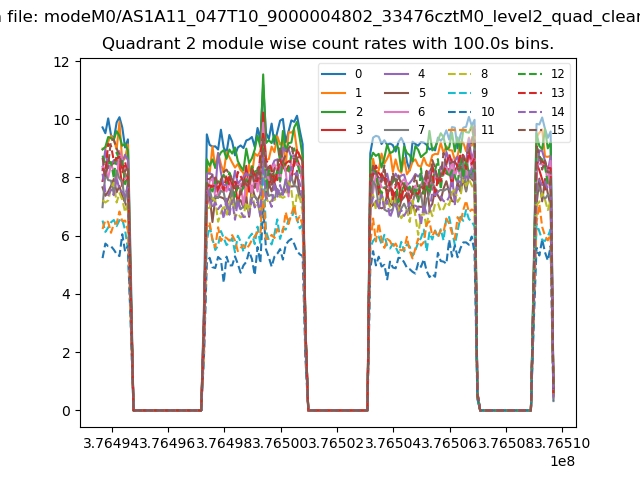
| Module-wise count rates for Quadrant A Data is divided into 100 sec bins |
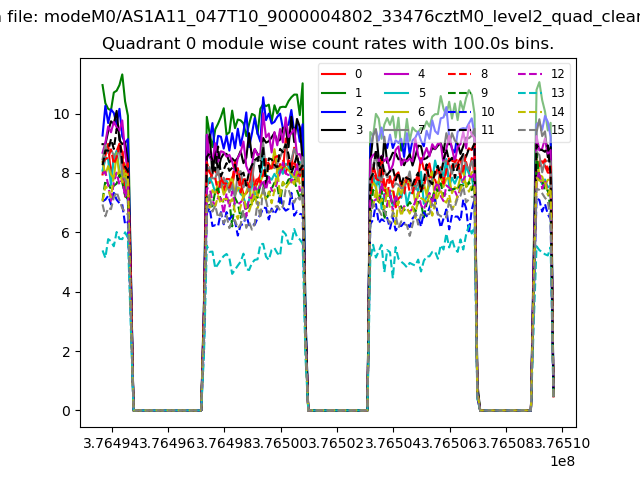 |
 |
| Module-wise count rates for Quadrant B Data is divided into 100 sec bins |
 |
 |
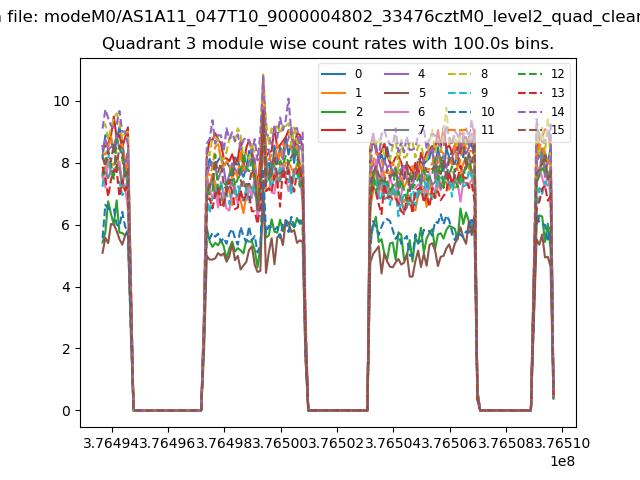
| Module-wise count rates for Quadrant C Data is divided into 100 sec bins |
 |
 |
| Module-wise count rates for Quadrant D Data is divided into 100 sec bins |
 |
 |
| Parameter | Plot |
|---|---|
| CZT HV Monitor | 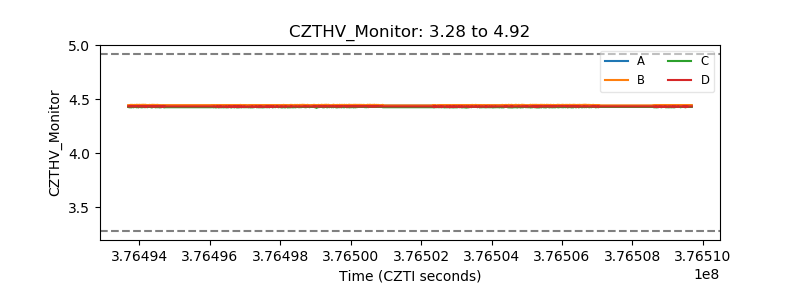 |
| D_VDD | 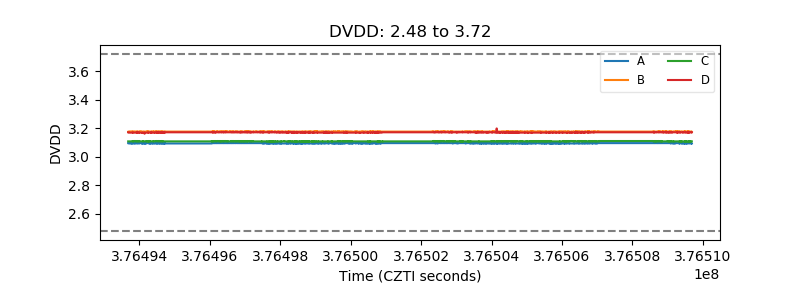 |
| Temperature 1 | 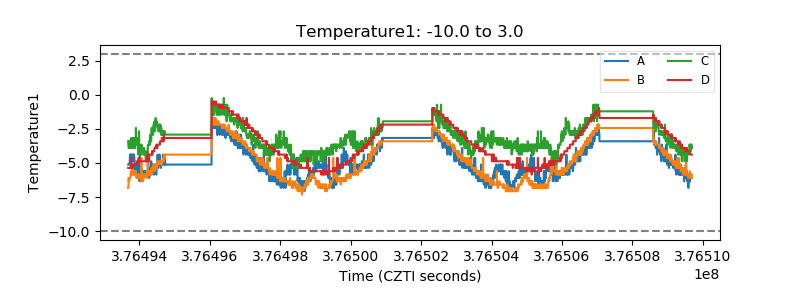 |
| Veto HV Monitor | 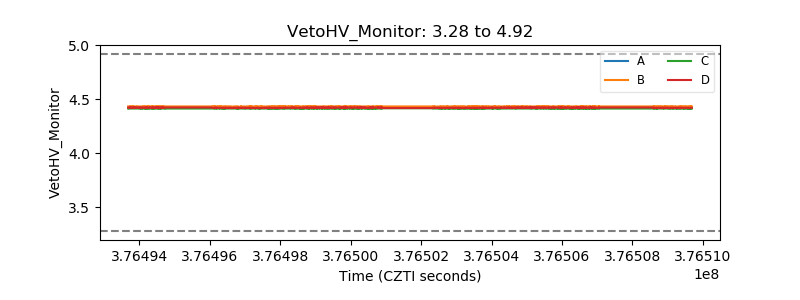 |
| Veto LLD | 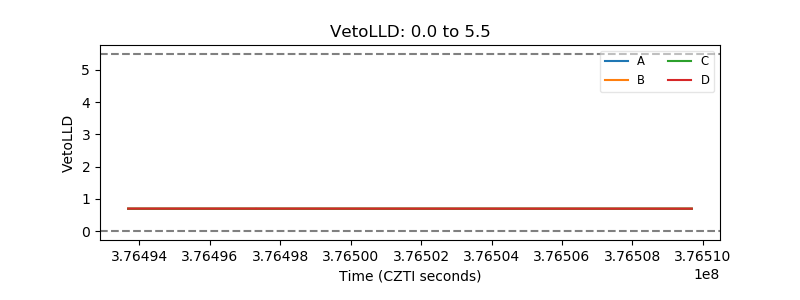 |
| Alpha Counter | 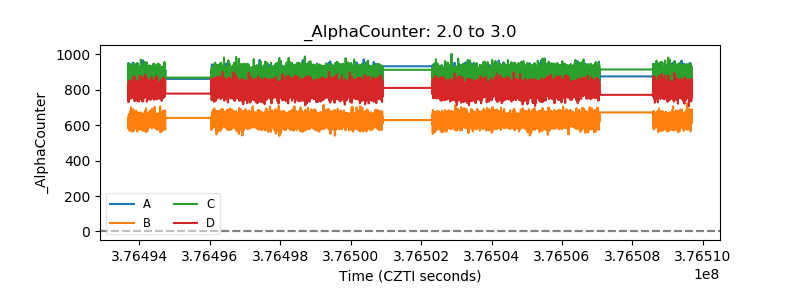 |
| _CPM_Rate | 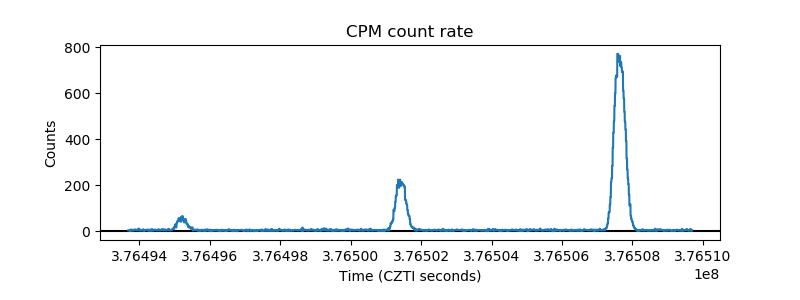 |
| CZT Counter | 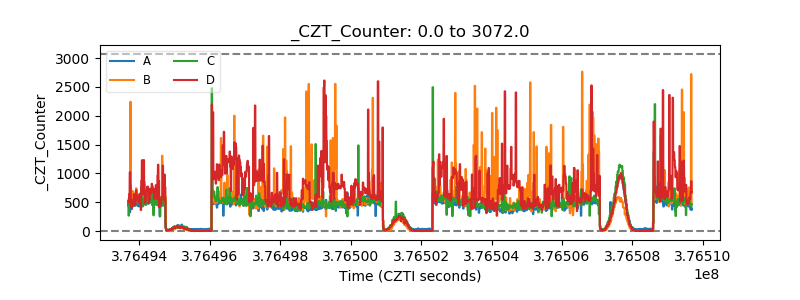 |
| +2.5 Volts monitor |  |
| +5 Volts monitor |  |
| _ROLL_ROT | 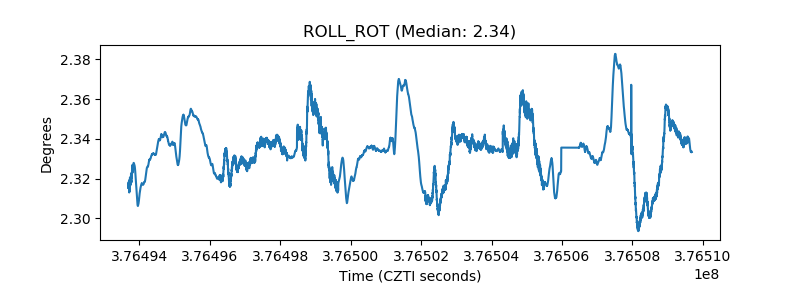 |
| _Roll_DEC | 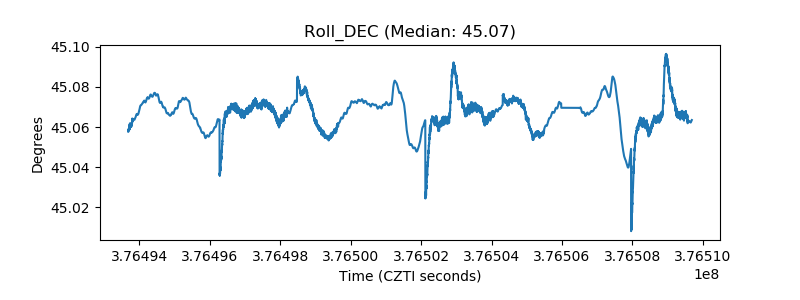 |
| _Roll_RA |  |
| Veto Counter | 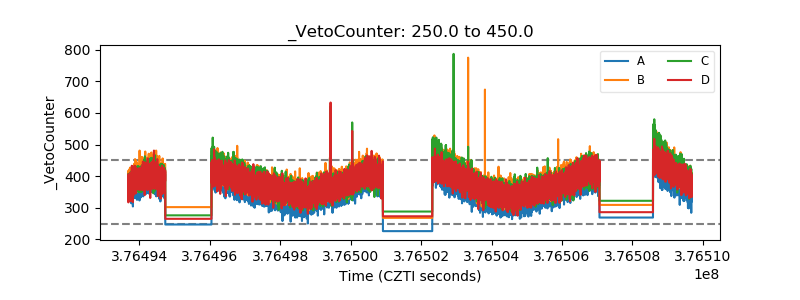 |