| Param | Original file | Final file |
|---|---|---|
| Filename | modeM0/AS1A11_065T10_9000004800cztM0_level2.fits | modeM0/AS1A11_065T10_9000004800cztM0_level2_quad_clean.evt |
| Size (bytes) | 18,043,200 | 24,410,880 |
| Size | 17.2 MB | 23.3 MB |
| Events in quadrant A | 108,030 | 159,035 |
| Events in quadrant B | 102,828 | 154,284 |
| Events in quadrant C | 104,546 | 148,108 |
| Events in quadrant D | 88,656 | 134,354 |
| Mode M9 | |||
|---|---|---|---|
| Quadrant | BADHDUFLAG | Total packets | Discarded packets |
| A | 0 | 14 | 0 |
| B | 0 | 14 | 0 |
| C | 0 | 14 | 0 |
| D | 0 | 14 | 0 |
| Mode M0 | |||
|---|---|---|---|
| Quadrant | BADHDUFLAG | Total packets | Discarded packets |
| A | 0 | 3966 | 0 |
| B | 0 | 4733 | 0 |
| C | 0 | 4439 | 0 |
| D | 0 | 6734 | 0 |
| Mode SS | |||
|---|---|---|---|
| Quadrant | BADHDUFLAG | Total packets | Discarded packets |
| A | 0 | 42 | 0 |
| B | 0 | 42 | 0 |
| C | 0 | 42 | 0 |
| D | 0 | 42 | 0 |
| Quadrant | Total seconds | Saturated seconds | Saturation percentage |
|---|---|---|---|
| A | 1956 | 2 | 0.102249% |
| B | 1956 | 36 | 1.840491% |
| C | 1956 | 40 | 2.044990% |
| D | 1956 | 92 | 4.703476% |
Noise dominated data is calculated using 1-second bins in cleaned event files. If a bin has >2000 counts, and if more than 50% of those come from <1% of pixels, then it is considered to be noise-dominated and hence unusable.
| Quadrant | # 1 sec bins | Bins with >0 counts | Bins with >2000 counts | High rate bins dominated by noise | Noise dominated (total time) | Noise dominated (detector-on time) | Marked lightcurve |
|---|---|---|---|---|---|---|---|
| A | 3388 | 1956 | 0 | 0 | 0.00% | 0.00% | 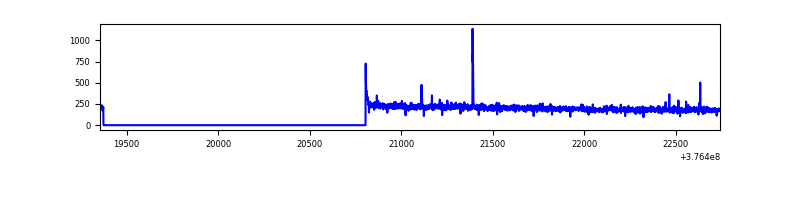 |
| B | 3388 | 1955 | 0 | 0 | 0.00% | 0.00% |  |
| C | 3388 | 1955 | 0 | 0 | 0.00% | 0.00% | 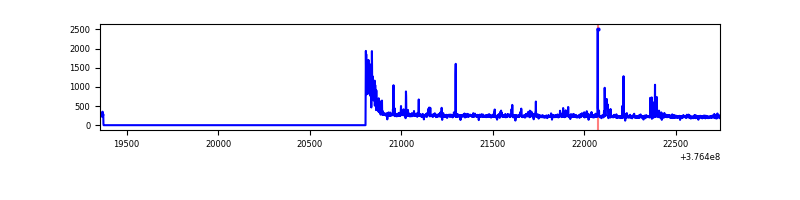 |
| D | 3387 | 1955 | 0 | 0 | 0.00% | 0.00% | 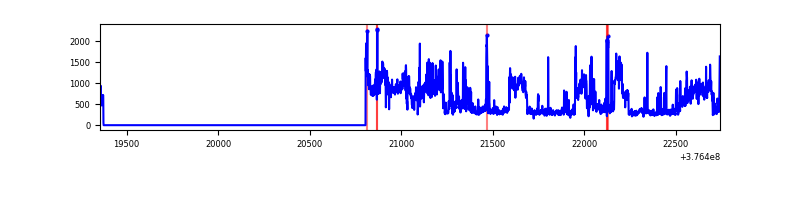 |
Top three noisy pixels from each quadrant. If the there are fewer than three noisy pixels in the level2.evt file, extra rows are filled as -1
| Pixel properties | Quadrant properties | ||||||
|---|---|---|---|---|---|---|---|
| Quadrant | DetID | PixID | Counts | Sigma | Mean | Median | Sigma |
| A | 9 | 19 | 107 | 9.33 | 28 | 26 | 8.7 |
| A | 0 | 29 | 90 | 7.37 | 28 | 26 | 8.7 |
| A | 12 | 254 | 86 | 6.91 | 28 | 26 | 8.7 |
| B | 2 | 9 | 105 | 10.37 | 27 | 26 | 7.6 |
| B | 3 | 80 | 86 | 7.87 | 27 | 26 | 7.6 |
| B | 2 | 8 | 82 | 7.35 | 27 | 26 | 7.6 |
| C | 3 | 203 | 91 | 7.36 | 27 | 26 | 8.8 |
| C | 3 | 187 | 87 | 6.91 | 27 | 26 | 8.8 |
| C | 12 | 16 | 73 | 5.32 | 27 | 26 | 8.8 |
| D | 7 | 3 | 72 | 5.82 | 25 | 23 | 8.4 |
| D | 10 | 63 | 71 | 5.71 | 25 | 23 | 8.4 |
| D | 11 | 66 | 69 | 5.47 | 25 | 23 | 8.4 |
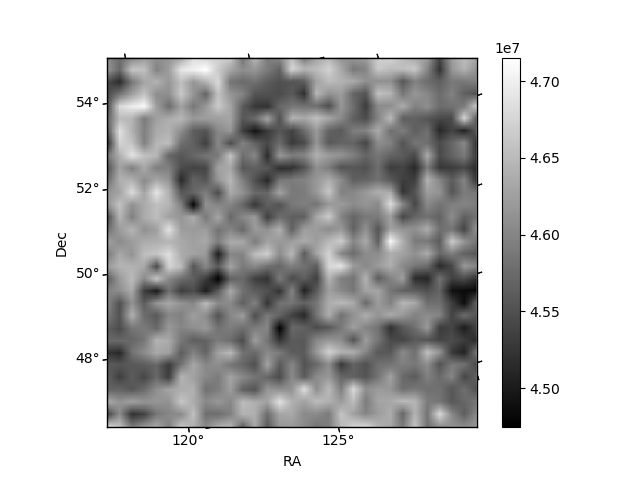
Histogram calculated using DETX and DETY for each event in the final _common_clean file
| Quadrant A |  |
 |
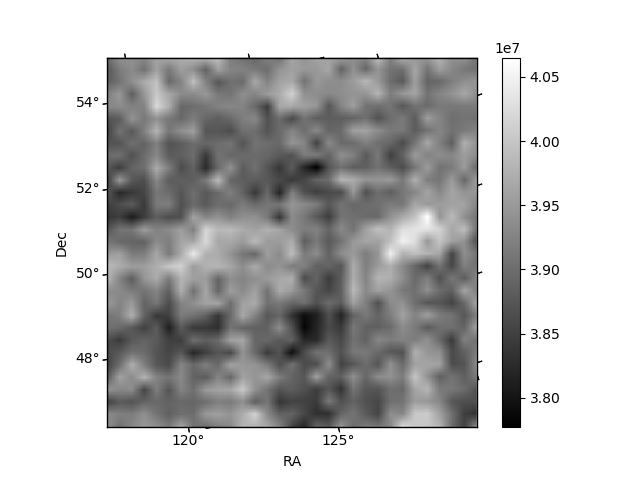
Quadrant B |
|---|---|---|---|
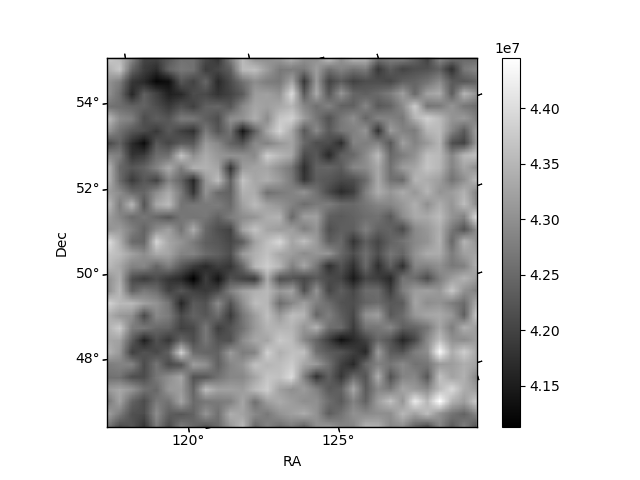
| Quadrant D |  |
 |
Quadrant C |
| Plot type | Count rate plots | Images |
|---|---|---|
| Comparison with Poisson distribution Blue bars denote a histogram of data divided into 1 sec bins. Red curve is a Poisson curve with rate = median count rate of data. |
 |
 |
| Quadrant-wise count rates Data is divided into 100 sec bins |
 |
|
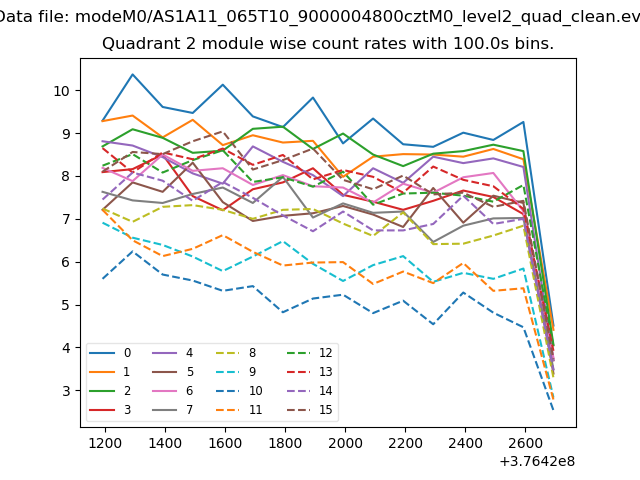
| Module-wise count rates for Quadrant A Data is divided into 100 sec bins |
 |
 |
| Module-wise count rates for Quadrant B Data is divided into 100 sec bins |
 |
 |
| Module-wise count rates for Quadrant C Data is divided into 100 sec bins |
 |
 |
| Module-wise count rates for Quadrant D Data is divided into 100 sec bins |
 |
 |
| Parameter | Plot |
|---|---|
| CZT HV Monitor |  |
| D_VDD |  |
| Temperature 1 | 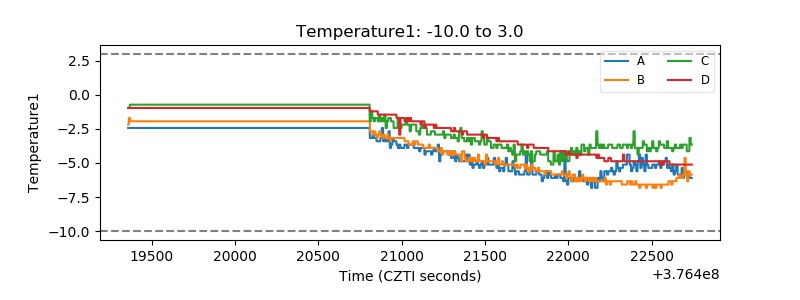 |
| Veto HV Monitor | 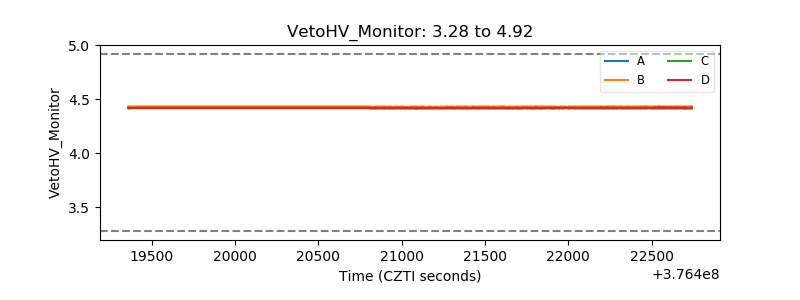 |
| Veto LLD | 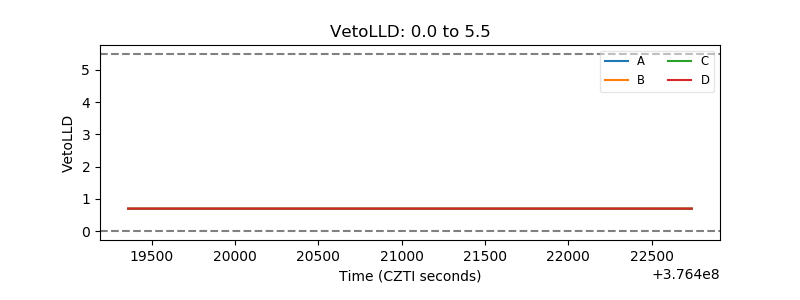 |
| Alpha Counter |  |
| _CPM_Rate |  |
| CZT Counter | 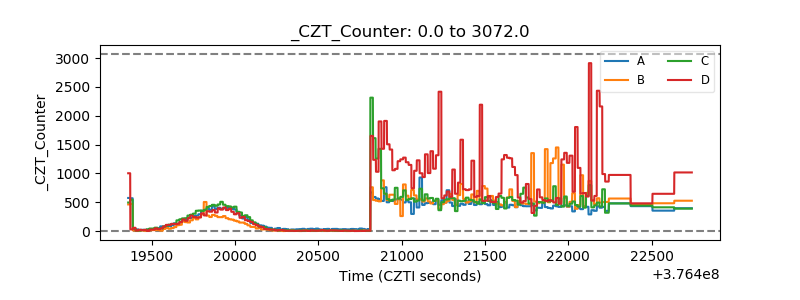 |
| +2.5 Volts monitor |  |
| +5 Volts monitor |  |
| _ROLL_ROT |  |
| _Roll_DEC |  |
| _Roll_RA | 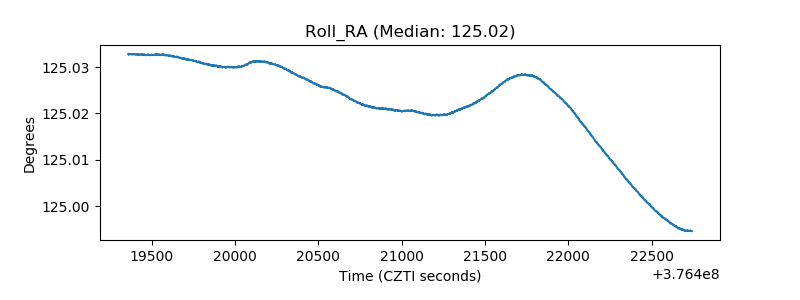 |
| Veto Counter | 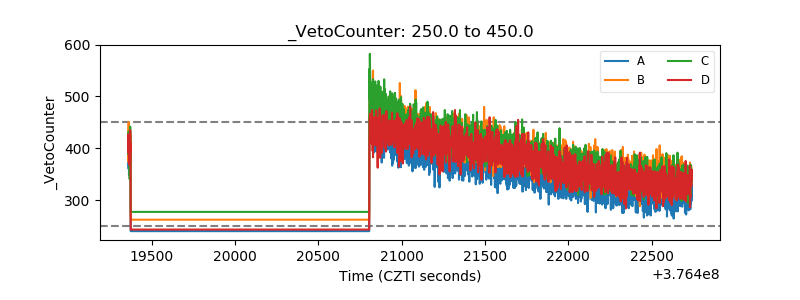 |