| Param | Original file | Final file |
|---|---|---|
| Filename | modeM0/AS1A11_065T10_9000004800_33461cztM0_level2.evt | modeM0/AS1A11_065T10_9000004800_33461cztM0_level2_quad_clean.evt |
| Size (bytes) | 168,621,120 | 29,347,200 |
| Size | 160.8 MB | 28.0 MB |
| Events in quadrant A | 879,268 | 191,515 |
| Events in quadrant B | 1,182,141 | 188,439 |
| Events in quadrant C | 1,086,706 | 186,889 |
| Events in quadrant D | 1,823,388 | 178,724 |
| Mode M9 | |||
|---|---|---|---|
| Quadrant | BADHDUFLAG | Total packets | Discarded packets |
| A | 0 | 14 | 0 |
| B | 0 | 14 | 0 |
| C | 0 | 14 | 0 |
| D | 0 | 14 | 0 |
| Mode M0 | |||
|---|---|---|---|
| Quadrant | BADHDUFLAG | Total packets | Discarded packets |
| A | 0 | 3967 | 1 |
| B | 0 | 4734 | 1 |
| C | 0 | 4440 | 1 |
| D | 0 | 6735 | 1 |
| Mode SS | |||
|---|---|---|---|
| Quadrant | BADHDUFLAG | Total packets | Discarded packets |
| A | 0 | 42 | 0 |
| B | 0 | 42 | 0 |
| C | 0 | 42 | 0 |
| D | 0 | 42 | 0 |
| Quadrant | Total seconds | Saturated seconds | Saturation percentage |
|---|---|---|---|
| A | 1956 | 2 | 0.102249% |
| B | 1956 | 36 | 1.840491% |
| C | 1956 | 40 | 2.044990% |
| D | 1956 | 92 | 4.703476% |
Noise dominated data is calculated using 1-second bins in cleaned event files. If a bin has >2000 counts, and if more than 50% of those come from <1% of pixels, then it is considered to be noise-dominated and hence unusable.
| Quadrant | # 1 sec bins | Bins with >0 counts | Bins with >2000 counts | High rate bins dominated by noise | Noise dominated (total time) | Noise dominated (detector-on time) | Marked lightcurve |
|---|---|---|---|---|---|---|---|
| A | 3388 | 1957 | 0 | 0 | 0.00% | 0.00% | 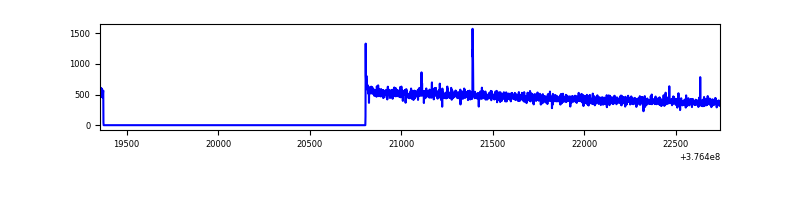 |
| B | 3388 | 1957 | 24 | 24 | 0.71% | 1.23% | 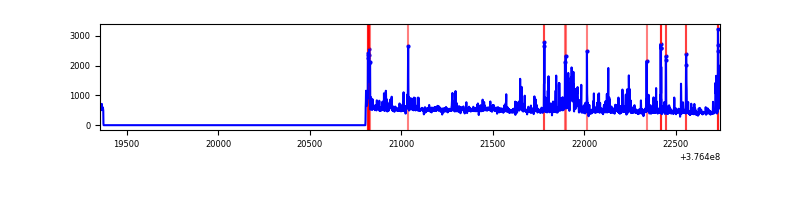 |
| C | 3388 | 1957 | 29 | 29 | 0.86% | 1.48% | 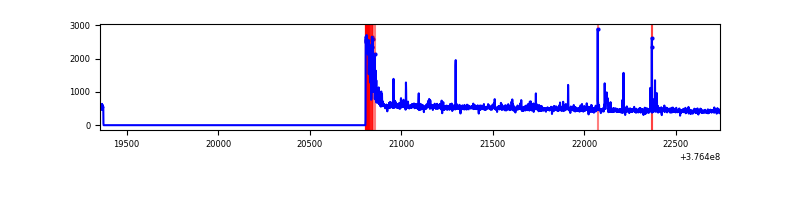 |
| D | 3388 | 1957 | 66 | 66 | 1.95% | 3.37% | 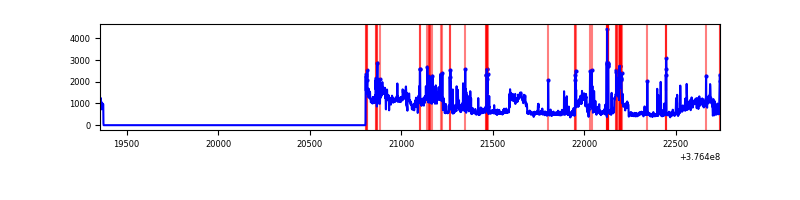 |
Top three noisy pixels from each quadrant. If the there are fewer than three noisy pixels in the level2.evt file, extra rows are filled as -1
| Pixel properties | Quadrant properties | ||||||
|---|---|---|---|---|---|---|---|
| Quadrant | DetID | PixID | Counts | Sigma | Mean | Median | Sigma |
| A | 7 | 192 | 4274 | 86.87 | 223 | 219 | 46.7 |
| A | 13 | 6 | 4144 | 84.09 | 223 | 219 | 46.7 |
| A | 13 | 254 | 4094 | 83.02 | 223 | 219 | 46.7 |
| B | 5 | 172 | 136273 | 3052.53 | 222 | 216 | 44.6 |
| B | 5 | 255 | 38153 | 851.14 | 222 | 216 | 44.6 |
| B | 0 | 190 | 29514 | 657.32 | 222 | 216 | 44.6 |
| C | 0 | 10 | 89523 | 1704.17 | 219 | 221 | 52.4 |
| C | 15 | 214 | 86161 | 1640.02 | 219 | 221 | 52.4 |
| C | 1 | 23 | 30247 | 572.99 | 219 | 221 | 52.4 |
| D | 8 | 195 | 651275 | 11309.89 | 216 | 211 | 57.6 |
| D | 12 | 233 | 99087 | 1717.61 | 216 | 211 | 57.6 |
| D | 10 | 118 | 57103 | 988.29 | 216 | 211 | 57.6 |
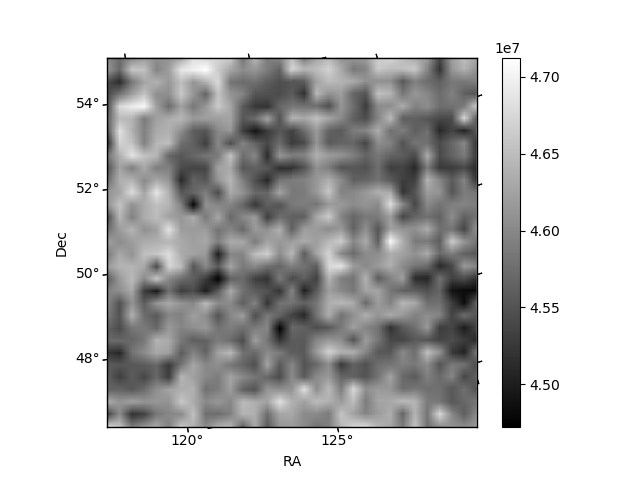
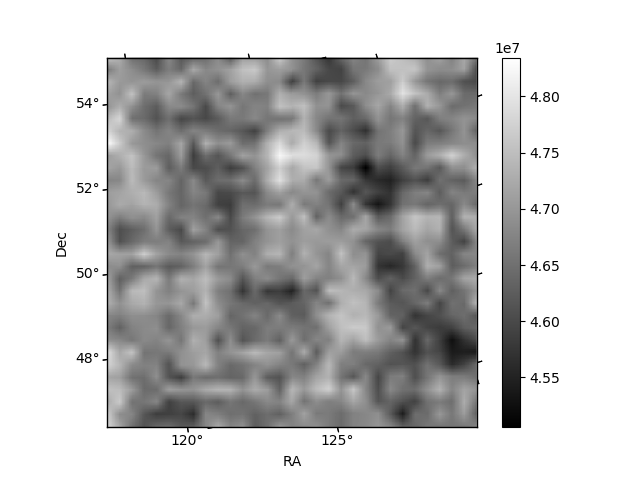
Histogram calculated using DETX and DETY for each event in the final _common_clean file
| Quadrant A | 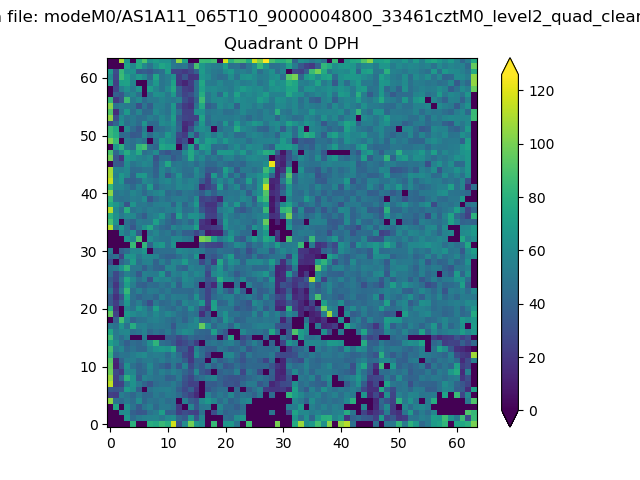 |
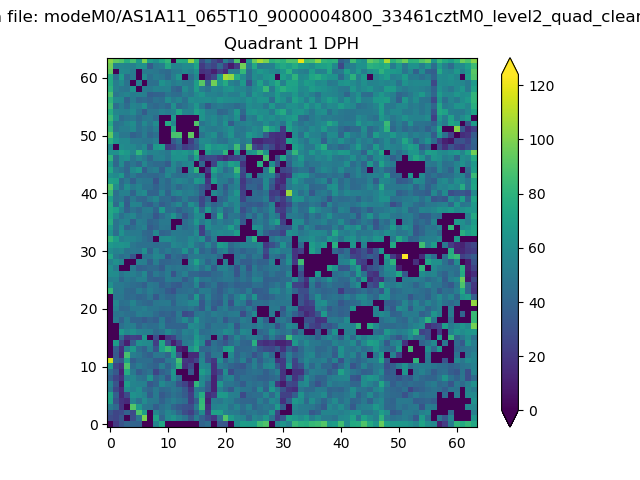 |
Quadrant B |
|---|---|---|---|
| Quadrant D | 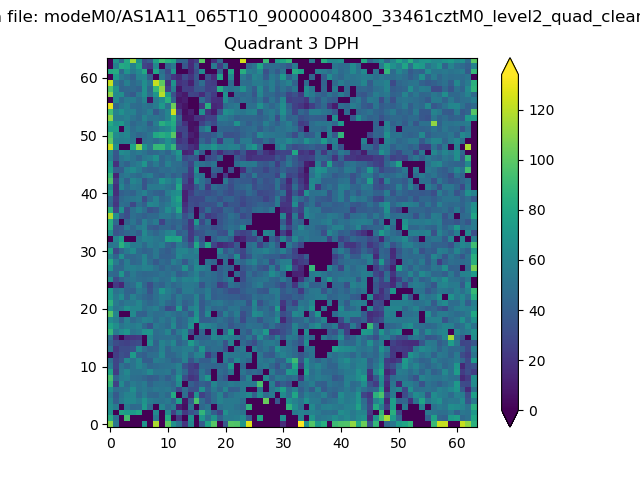 |
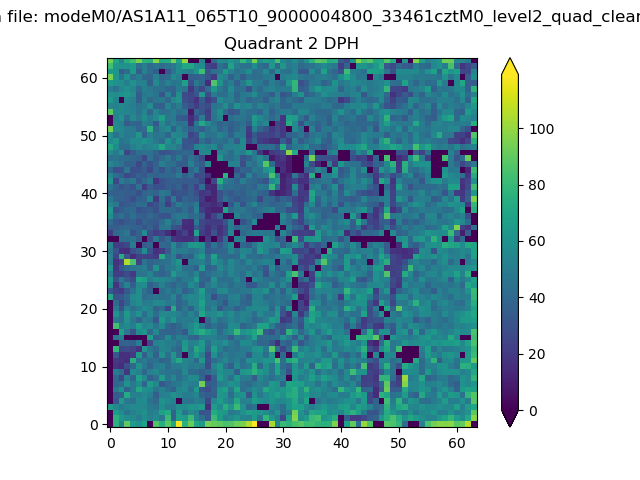 |
Quadrant C |
| Plot type | Count rate plots | Images |
|---|---|---|
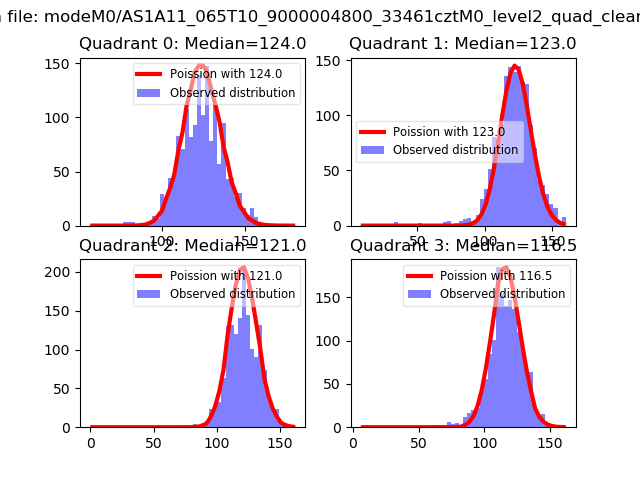
| Comparison with Poisson distribution Blue bars denote a histogram of data divided into 1 sec bins. Red curve is a Poisson curve with rate = median count rate of data. |
 |
 |
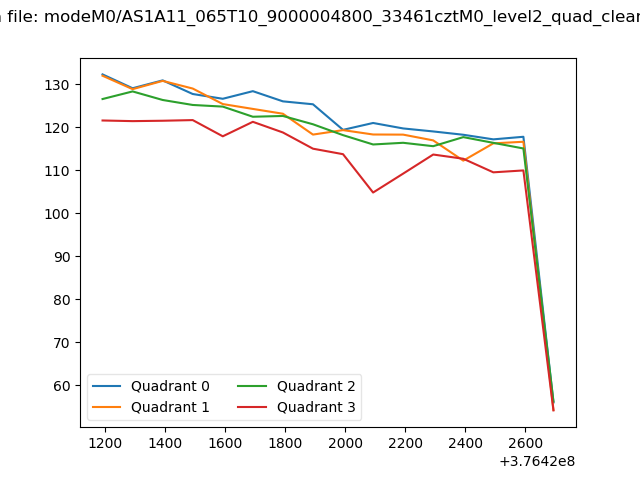
| Quadrant-wise count rates Data is divided into 100 sec bins |
 |
|
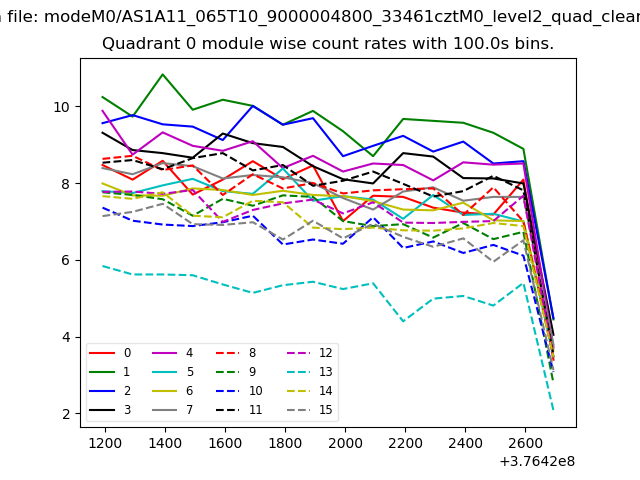
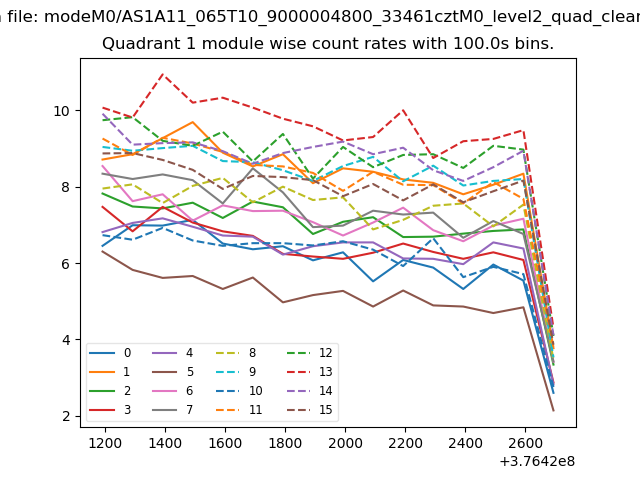
| Module-wise count rates for Quadrant A Data is divided into 100 sec bins |
 |
 |
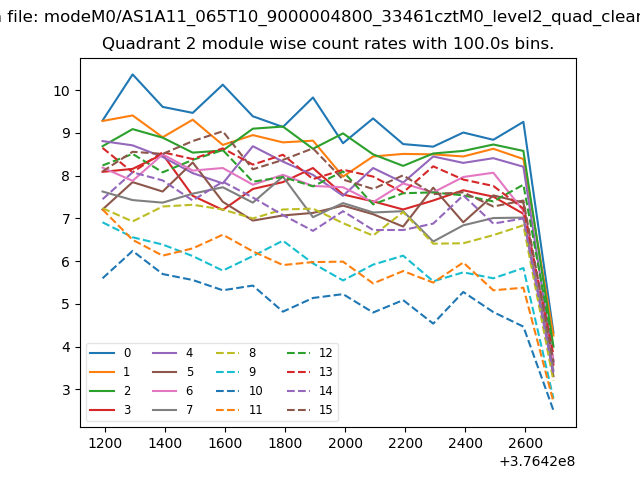
| Module-wise count rates for Quadrant B Data is divided into 100 sec bins |
 |
 |
| Module-wise count rates for Quadrant C Data is divided into 100 sec bins |
 |
 |
| Module-wise count rates for Quadrant D Data is divided into 100 sec bins |
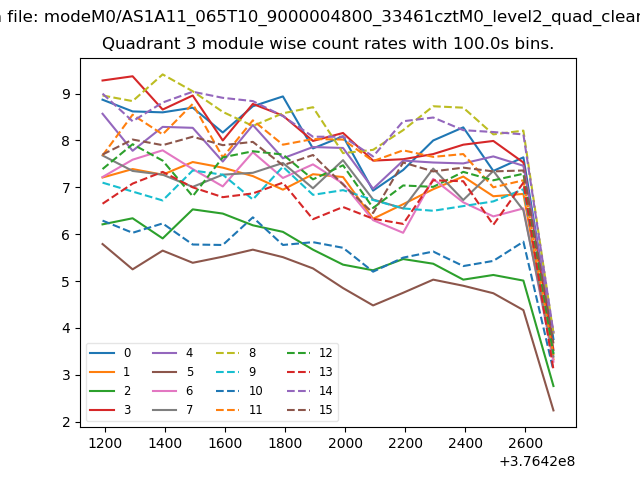 |
 |
| Parameter | Plot |
|---|---|
| CZT HV Monitor | 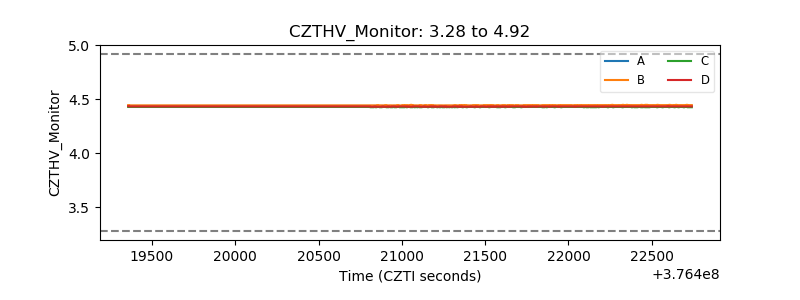 |
| D_VDD |  |
| Temperature 1 | 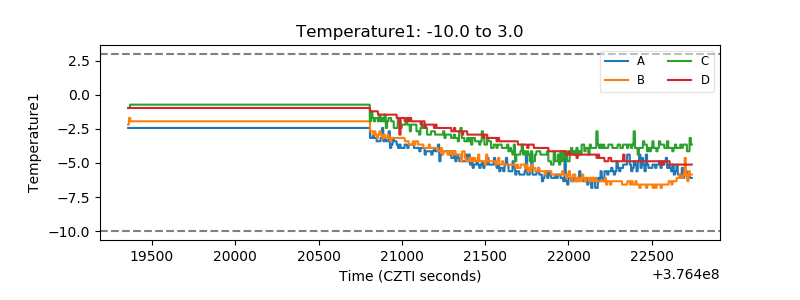 |
| Veto HV Monitor |  |
| Veto LLD | 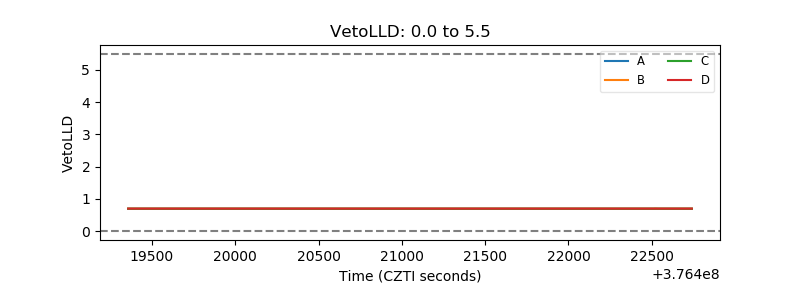 |
| Alpha Counter | 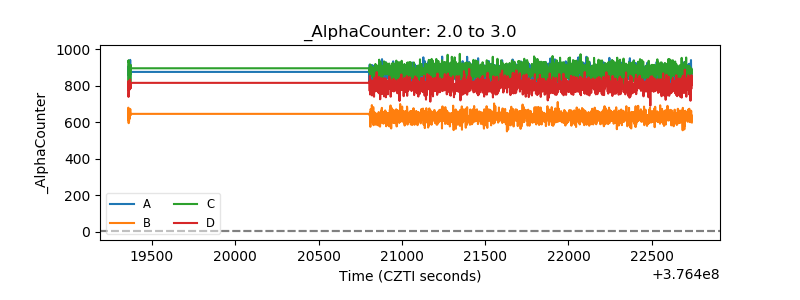 |
| _CPM_Rate | 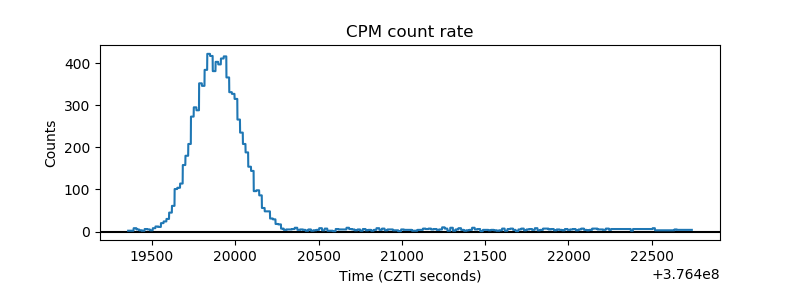 |
| CZT Counter | 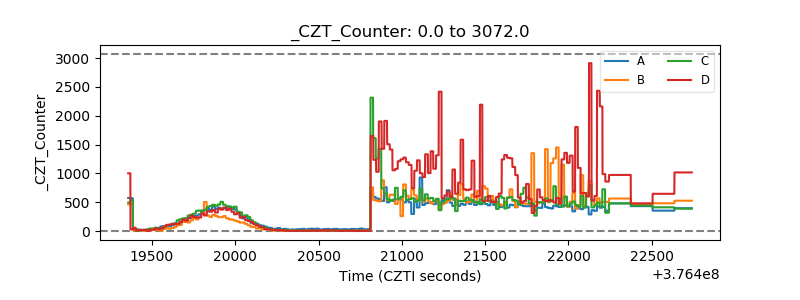 |
| +2.5 Volts monitor |  |
| +5 Volts monitor |  |
| _ROLL_ROT | 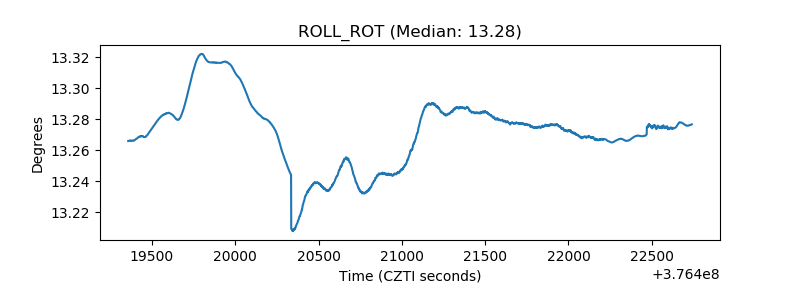 |
| _Roll_DEC | 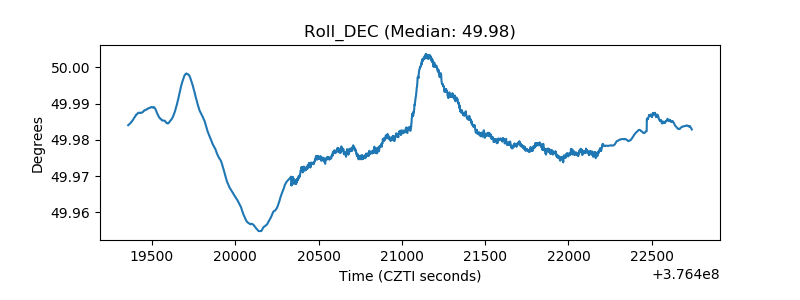 |
| _Roll_RA | 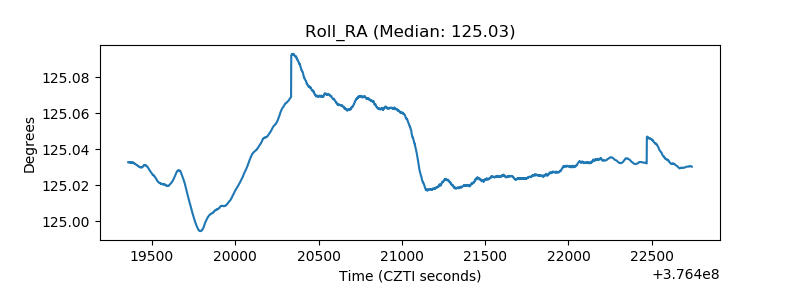 |
| Veto Counter | 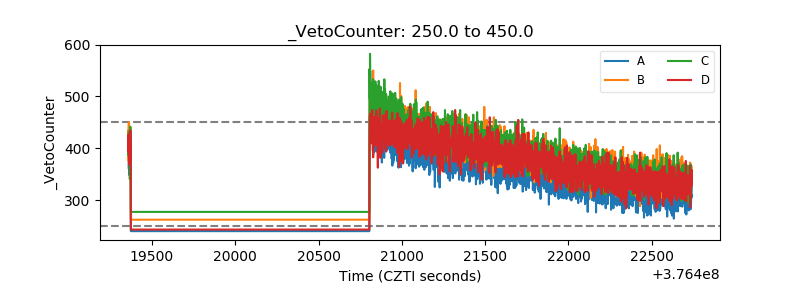 |