| Param | Original file | Final file |
|---|---|---|
| Filename | modeM0/AS1A11_060T01_9000004804cztM0_level2.fits | modeM0/AS1A11_060T01_9000004804cztM0_level2_quad_clean.evt |
| Size (bytes) | 1,870,954,560 | 1,608,537,600 |
| Size | 1.7 GB | 1.5 GB |
| Events in quadrant A | 11,667,054 | 9,569,195 |
| Events in quadrant B | 10,759,840 | 8,866,800 |
| Events in quadrant C | 11,283,954 | 8,883,046 |
| Events in quadrant D | 9,652,558 | 8,102,020 |
| Mode M9 | |||
|---|---|---|---|
| Quadrant | BADHDUFLAG | Total packets | Discarded packets |
| A | 0 | 739 | 0 |
| B | 0 | 739 | 0 |
| C | 0 | 739 | 0 |
| D | 0 | 739 | 0 |
| Mode M0 | |||
|---|---|---|---|
| Quadrant | BADHDUFLAG | Total packets | Discarded packets |
| A | 0 | 390905 | 0 |
| B | 0 | 542448 | 0 |
| C | 0 | 487031 | 0 |
| D | 0 | 607560 | 0 |
| Mode SS | |||
|---|---|---|---|
| Quadrant | BADHDUFLAG | Total packets | Discarded packets |
| A | 0 | 3966 | 0 |
| B | 0 | 3966 | 0 |
| C | 0 | 3966 | 0 |
| D | 0 | 3966 | 0 |
| Quadrant | Total seconds | Saturated seconds | Saturation percentage |
|---|---|---|---|
| A | 194034 | 234 | 0.120597% |
| B | 194034 | 14024 | 7.227599% |
| C | 194034 | 3173 | 1.635280% |
| D | 194034 | 8867 | 4.569818% |
Noise dominated data is calculated using 1-second bins in cleaned event files. If a bin has >2000 counts, and if more than 50% of those come from <1% of pixels, then it is considered to be noise-dominated and hence unusable.
| Quadrant | # 1 sec bins | Bins with >0 counts | Bins with >2000 counts | High rate bins dominated by noise | Noise dominated (total time) | Noise dominated (detector-on time) | Marked lightcurve |
|---|---|---|---|---|---|---|---|
| A | 267916 | 194033 | 0 | 0 | 0.00% | 0.00% | 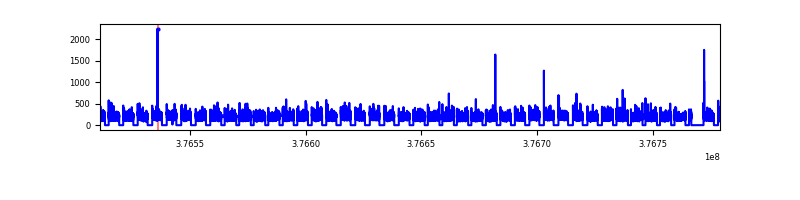 |
| B | 267916 | 193892 | 0 | 0 | 0.00% | 0.00% |  |
| C | 267916 | 194006 | 0 | 0 | 0.00% | 0.00% | 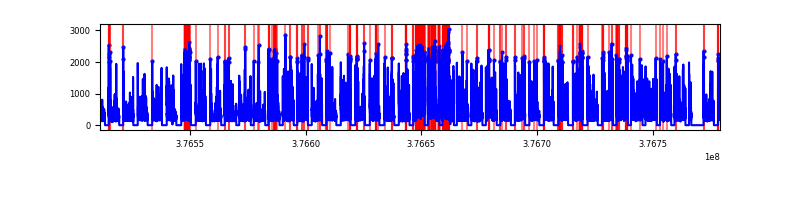 |
| D | 267915 | 193884 | 0 | 0 | 0.00% | 0.00% | 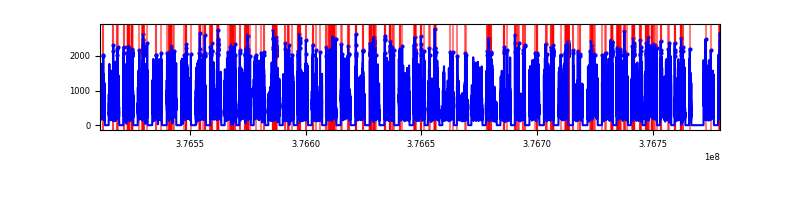 |
Top three noisy pixels from each quadrant. If the there are fewer than three noisy pixels in the level2.evt file, extra rows are filled as -1
| Pixel properties | Quadrant properties | ||||||
|---|---|---|---|---|---|---|---|
| Quadrant | DetID | PixID | Counts | Sigma | Mean | Median | Sigma |
| A | 7 | 110 | 9608 | 8.99 | 3036 | 2850 | 752.0 |
| A | 0 | 29 | 9273 | 8.54 | 3036 | 2850 | 752.0 |
| A | 9 | 19 | 9226 | 8.48 | 3036 | 2850 | 752.0 |
| B | 2 | 9 | 9228 | 11.53 | 2851 | 2715 | 564.9 |
| B | 3 | 80 | 8496 | 10.23 | 2851 | 2715 | 564.9 |
| B | 2 | 8 | 7562 | 8.58 | 2851 | 2715 | 564.9 |
| C | 1 | 81 | 9538 | 8.91 | 2988 | 2817 | 754.7 |
| C | 1 | 80 | 9295 | 8.58 | 2988 | 2817 | 754.7 |
| C | 3 | 202 | 8830 | 7.97 | 2988 | 2817 | 754.7 |
| D | 7 | 3 | 7138 | 6.38 | 2755 | 2522 | 723.1 |
| D | 3 | 14 | 6934 | 6.1 | 2755 | 2522 | 723.1 |
| D | 10 | 189 | 6911 | 6.07 | 2755 | 2522 | 723.1 |
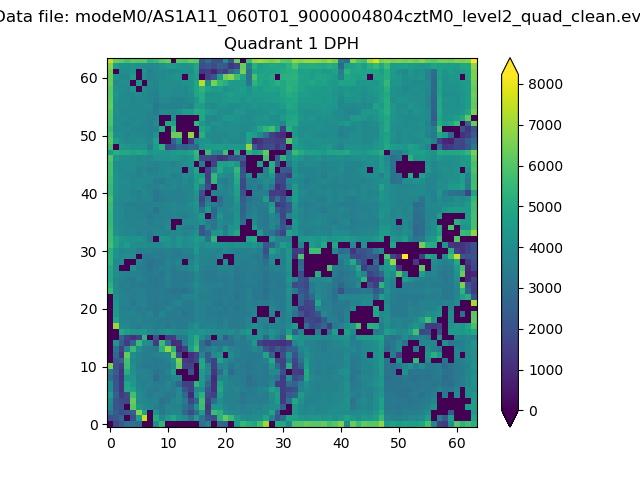
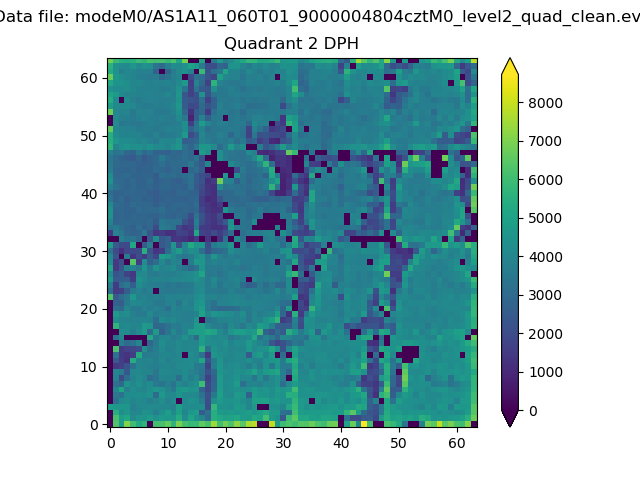
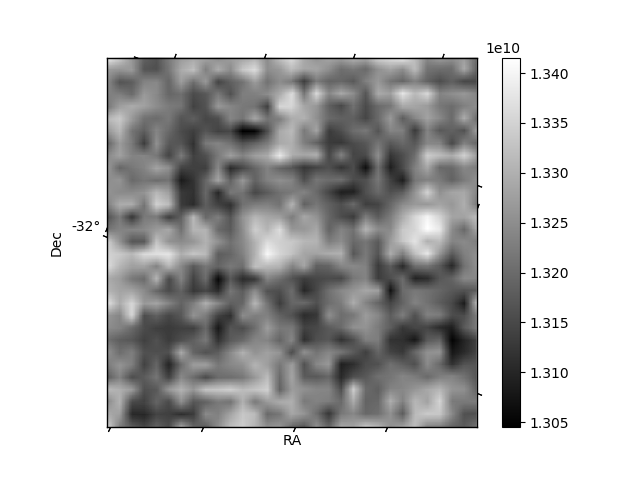
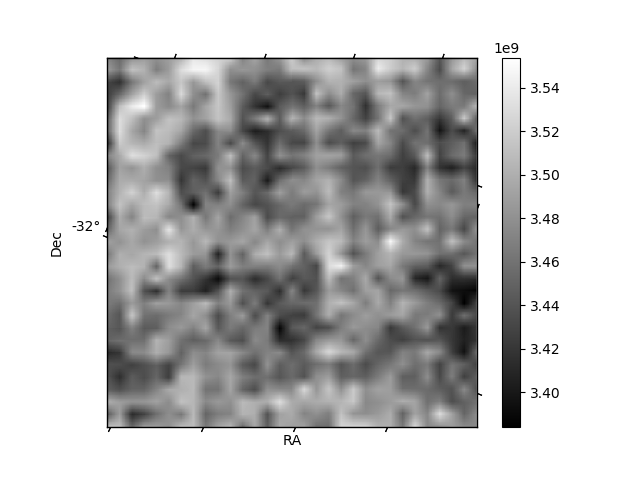
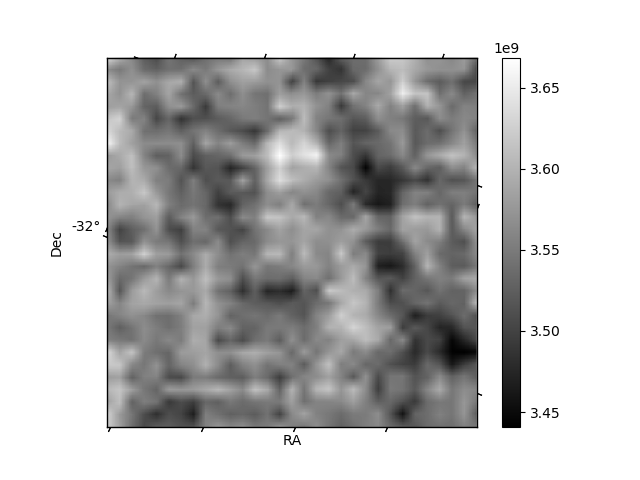
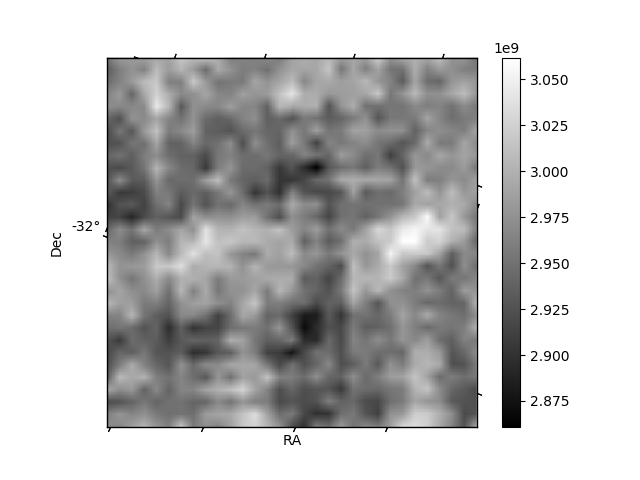
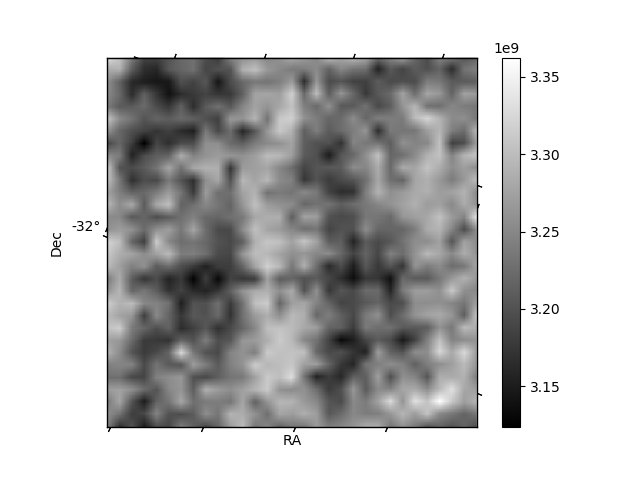
Histogram calculated using DETX and DETY for each event in the final _common_clean file
| Quadrant A | 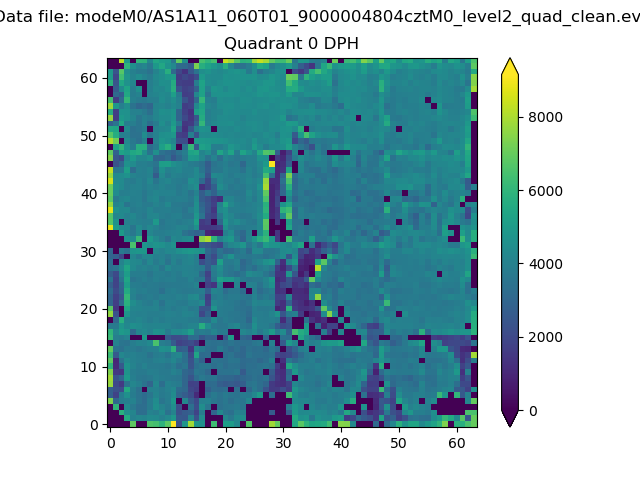 |
 |
Quadrant B |
|---|---|---|---|
| Quadrant D | 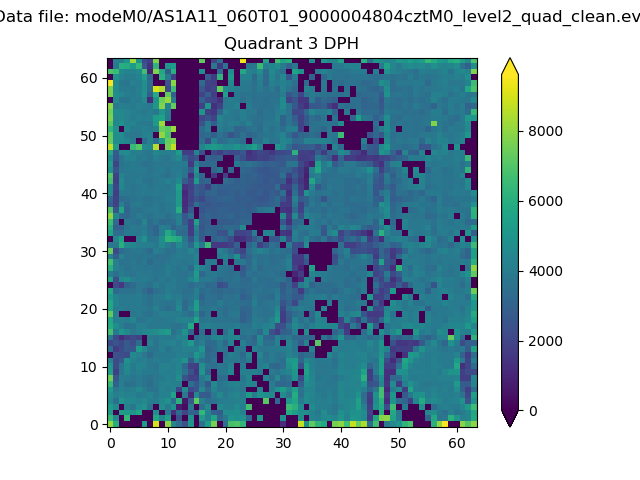 |
 |
Quadrant C |
| Plot type | Count rate plots | Images |
|---|---|---|
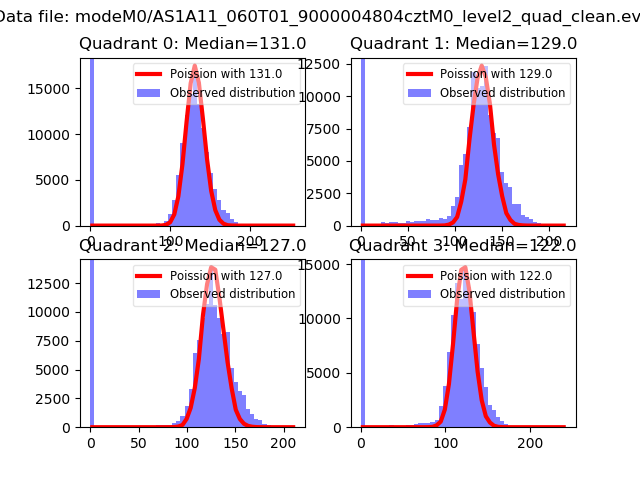
| Comparison with Poisson distribution Blue bars denote a histogram of data divided into 1 sec bins. Red curve is a Poisson curve with rate = median count rate of data. |
 |
 |
| Quadrant-wise count rates Data is divided into 100 sec bins |
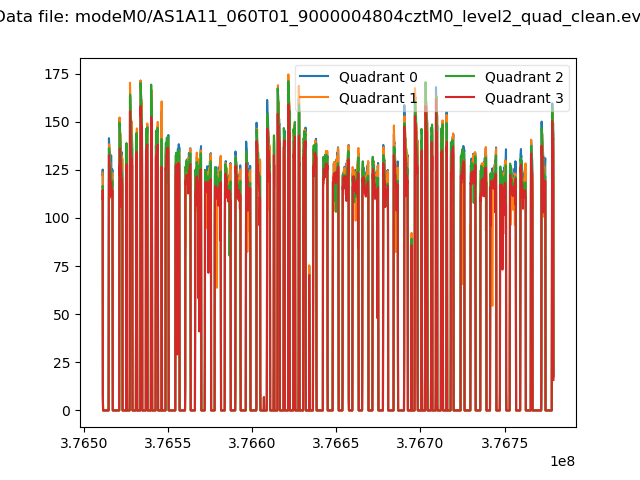 |
|
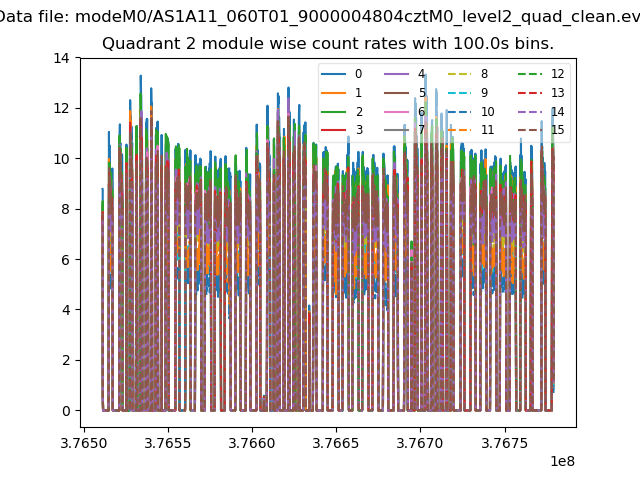
| Module-wise count rates for Quadrant A Data is divided into 100 sec bins |
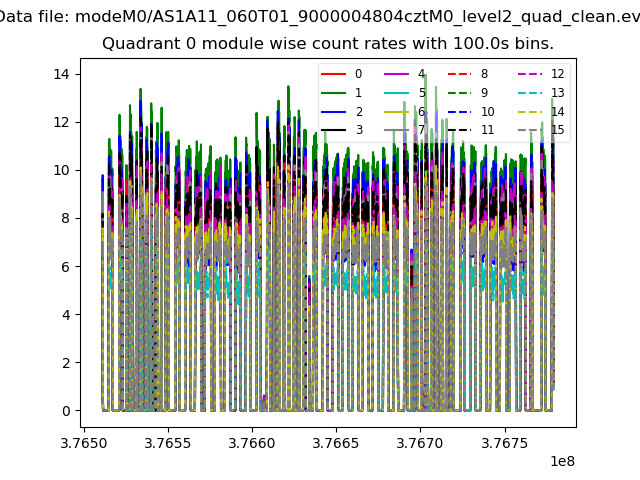 |
 |
| Module-wise count rates for Quadrant B Data is divided into 100 sec bins |
 |
 |
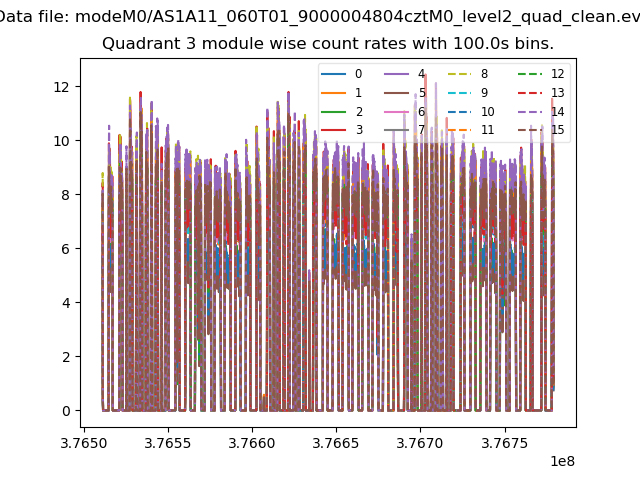
| Module-wise count rates for Quadrant C Data is divided into 100 sec bins |
 |
 |
| Module-wise count rates for Quadrant D Data is divided into 100 sec bins |
 |
 |
| Parameter | Plot |
|---|---|
| CZT HV Monitor |  |
| D_VDD | 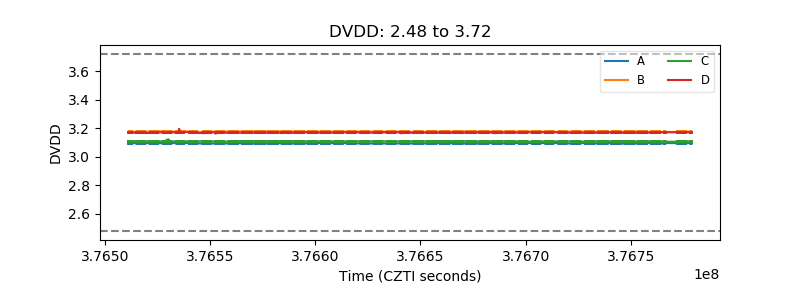 |
| Temperature 1 |  |
| Veto HV Monitor | 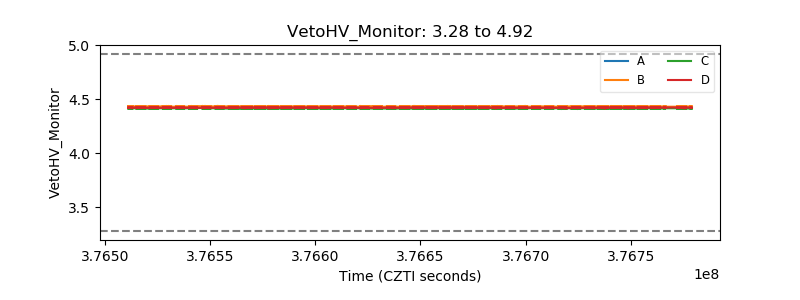 |
| Veto LLD | 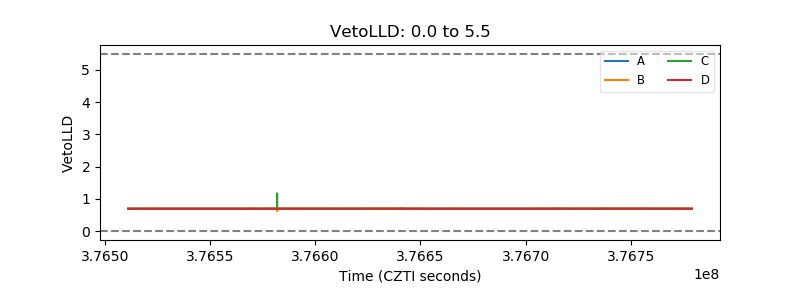 |
| Alpha Counter |  |
| _CPM_Rate | 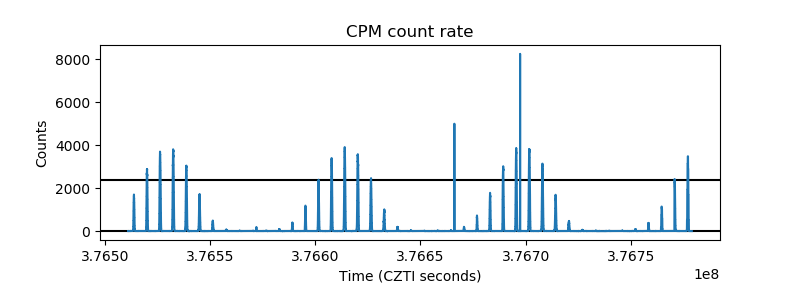 |
| CZT Counter | 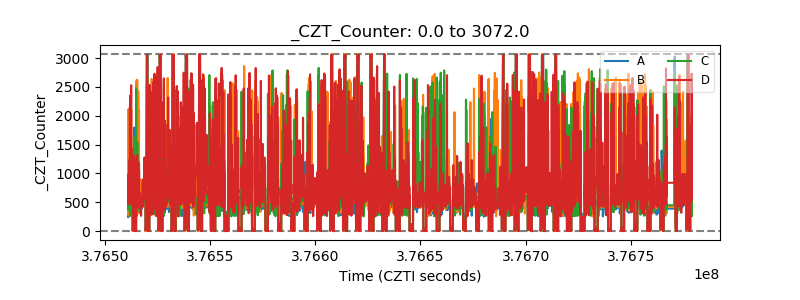 |
| +2.5 Volts monitor |  |
| +5 Volts monitor | 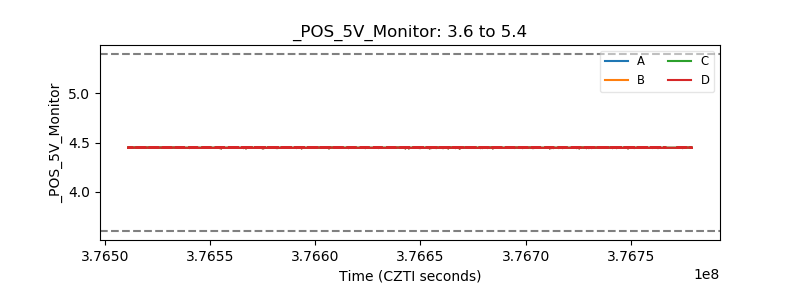 |
| _ROLL_ROT | 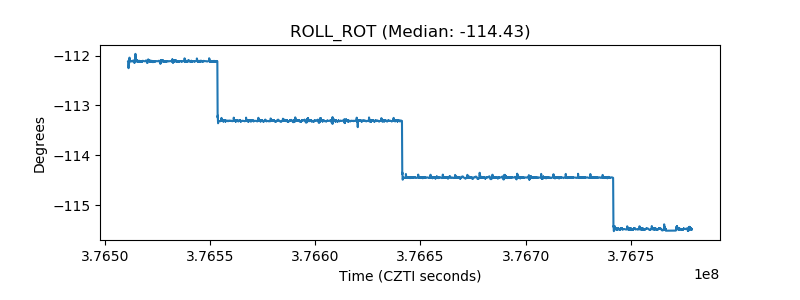 |
| _Roll_DEC | 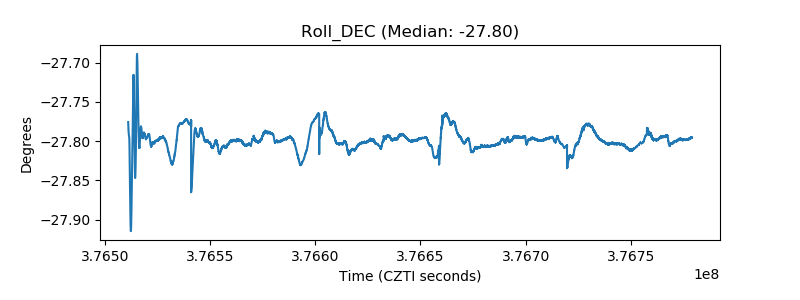 |
| _Roll_RA | 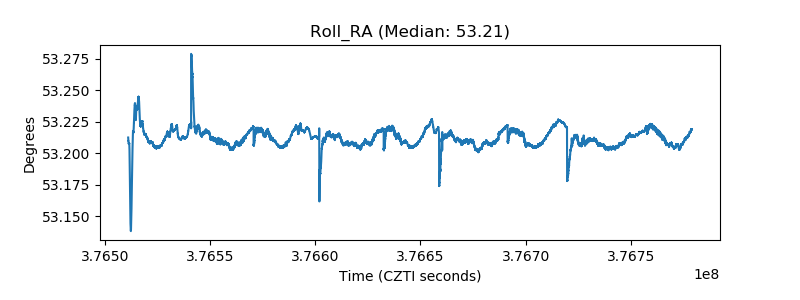 |
| Veto Counter | 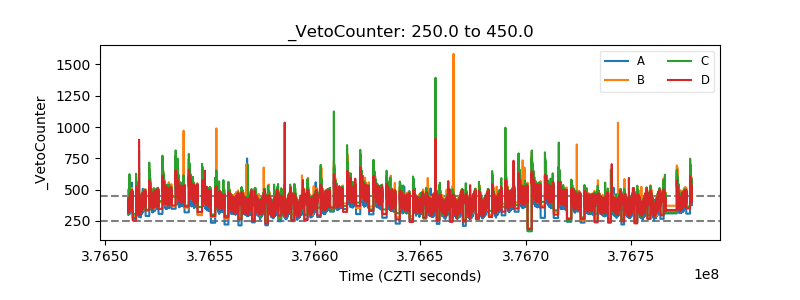 |