| Param | Original file | Final file |
|---|---|---|
| Filename | modeM0/AS1A11_060T01_9000004804_33476cztM0_level2.evt | modeM0/AS1A11_060T01_9000004804_33476cztM0_level2_quad_clean.evt |
| Size (bytes) | 268,784,640 | 27,385,920 |
| Size | 256.3 MB | 26.1 MB |
| Events in quadrant A | 1,475,861 | 159,722 |
| Events in quadrant B | 2,284,290 | 146,624 |
| Events in quadrant C | 1,784,174 | 152,721 |
| Events in quadrant D | 2,383,578 | 148,304 |
| Mode M9 | |||
|---|---|---|---|
| Quadrant | BADHDUFLAG | Total packets | Discarded packets |
| A | 0 | 17 | 0 |
| B | 0 | 17 | 0 |
| C | 0 | 17 | 0 |
| D | 0 | 17 | 0 |
| Mode M0 | |||
|---|---|---|---|
| Quadrant | BADHDUFLAG | Total packets | Discarded packets |
| A | 0 | 6297 | 2 |
| B | 0 | 8712 | 1 |
| C | 0 | 7147 | 1 |
| D | 0 | 9181 | 1 |
| Mode SS | |||
|---|---|---|---|
| Quadrant | BADHDUFLAG | Total packets | Discarded packets |
| A | 0 | 64 | 0 |
| B | 0 | 64 | 0 |
| C | 0 | 64 | 0 |
| D | 0 | 64 | 0 |
| Quadrant | Total seconds | Saturated seconds | Saturation percentage |
|---|---|---|---|
| A | 3107 | 4 | 0.128742% |
| B | 3107 | 212 | 6.823302% |
| C | 3107 | 34 | 1.094303% |
| D | 3107 | 66 | 2.124236% |
Noise dominated data is calculated using 1-second bins in cleaned event files. If a bin has >2000 counts, and if more than 50% of those come from <1% of pixels, then it is considered to be noise-dominated and hence unusable.
| Quadrant | # 1 sec bins | Bins with >0 counts | Bins with >2000 counts | High rate bins dominated by noise | Noise dominated (total time) | Noise dominated (detector-on time) | Marked lightcurve |
|---|---|---|---|---|---|---|---|
| A | 4748 | 3108 | 0 | 0 | 0.00% | 0.00% | 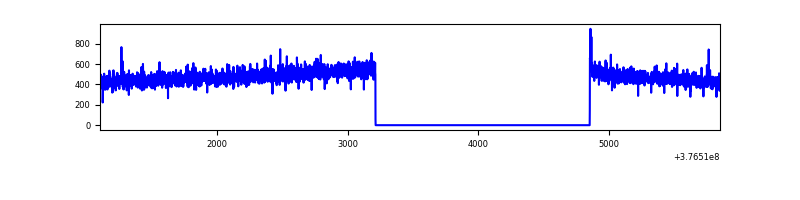 |
| B | 4748 | 3108 | 171 | 171 | 3.60% | 5.50% | 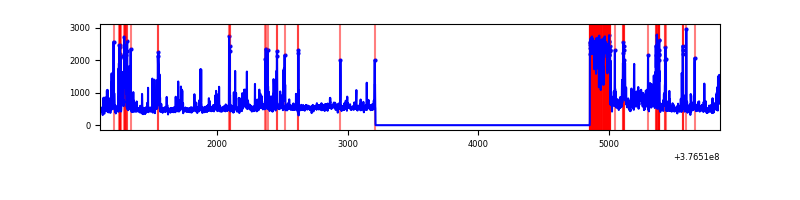 |
| C | 4748 | 3108 | 30 | 30 | 0.63% | 0.97% | 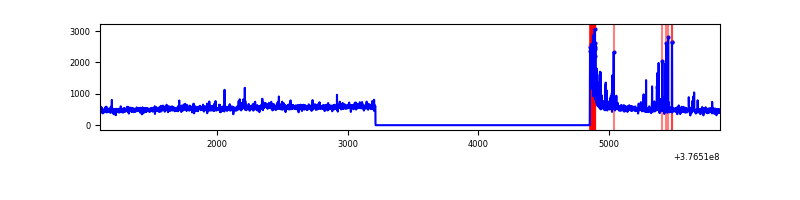 |
| D | 4748 | 3108 | 50 | 50 | 1.05% | 1.61% | 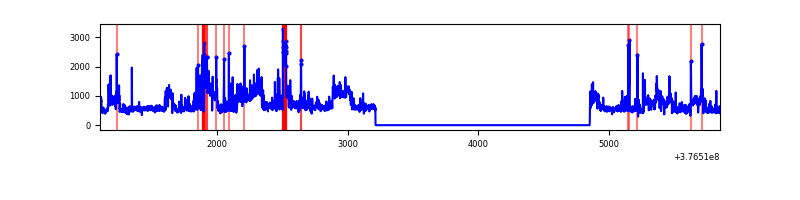 |
Top three noisy pixels from each quadrant. If the there are fewer than three noisy pixels in the level2.evt file, extra rows are filled as -1
| Pixel properties | Quadrant properties | ||||||
|---|---|---|---|---|---|---|---|
| Quadrant | DetID | PixID | Counts | Sigma | Mean | Median | Sigma |
| A | 13 | 254 | 5814 | 69.94 | 380 | 372 | 77.8 |
| A | 3 | 137 | 3656 | 42.2 | 380 | 372 | 77.8 |
| A | 0 | 226 | 3204 | 36.39 | 380 | 372 | 77.8 |
| B | 5 | 172 | 516851 | 7177.78 | 368 | 359 | 72.0 |
| B | 0 | 213 | 133753 | 1853.8 | 368 | 359 | 72.0 |
| B | 5 | 255 | 123682 | 1713.84 | 368 | 359 | 72.0 |
| C | 15 | 214 | 133161 | 1515.75 | 371 | 374 | 87.6 |
| C | 0 | 10 | 86253 | 980.3 | 371 | 374 | 87.6 |
| C | 1 | 23 | 45603 | 516.28 | 371 | 374 | 87.6 |
| D | 8 | 195 | 605617 | 6673.88 | 367 | 356 | 90.7 |
| D | 2 | 250 | 224210 | 2468.31 | 367 | 356 | 90.7 |
| D | 13 | 249 | 91303 | 1002.82 | 367 | 356 | 90.7 |
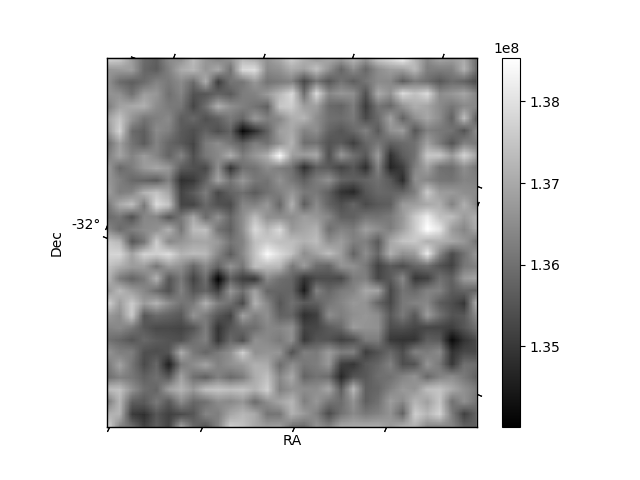
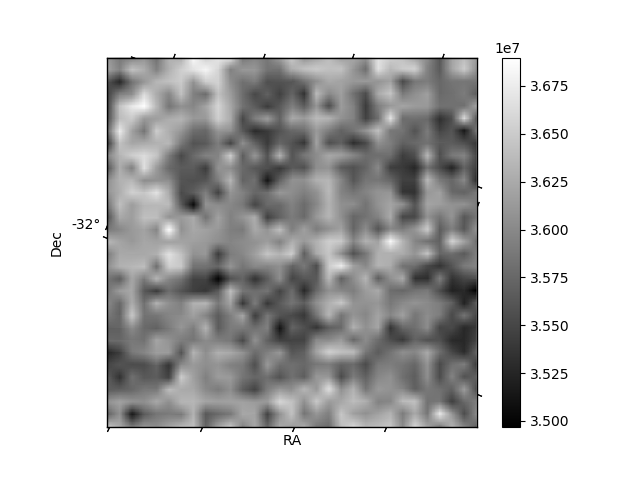
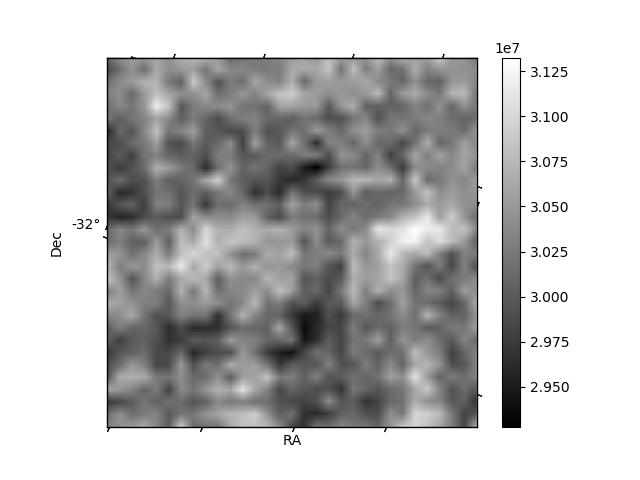
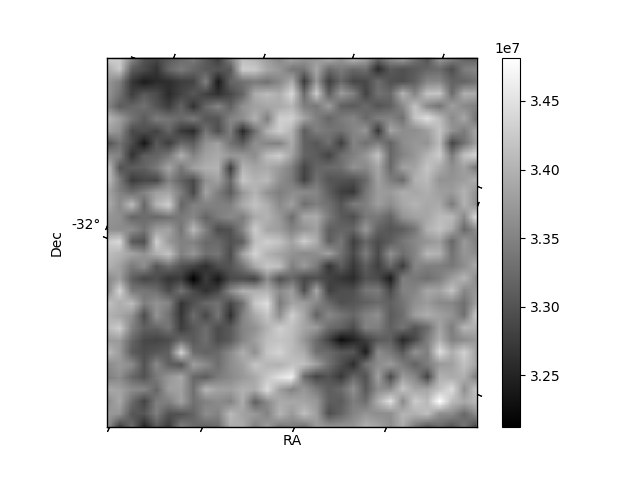
Histogram calculated using DETX and DETY for each event in the final _common_clean file
| Quadrant A | 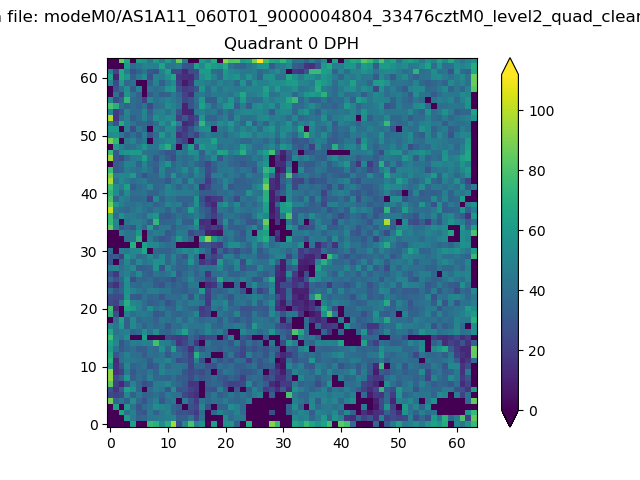 |
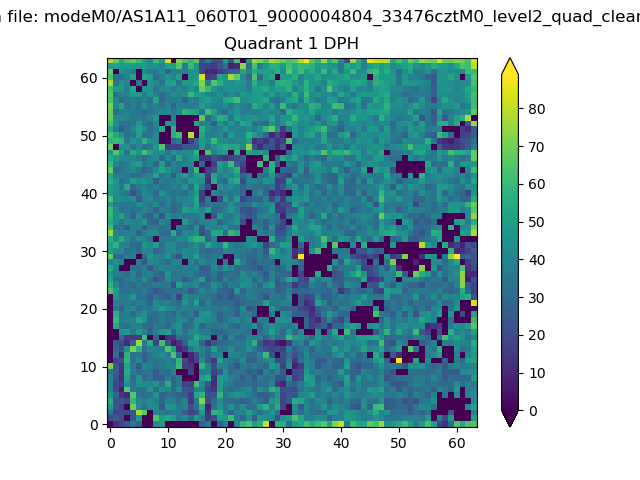 |
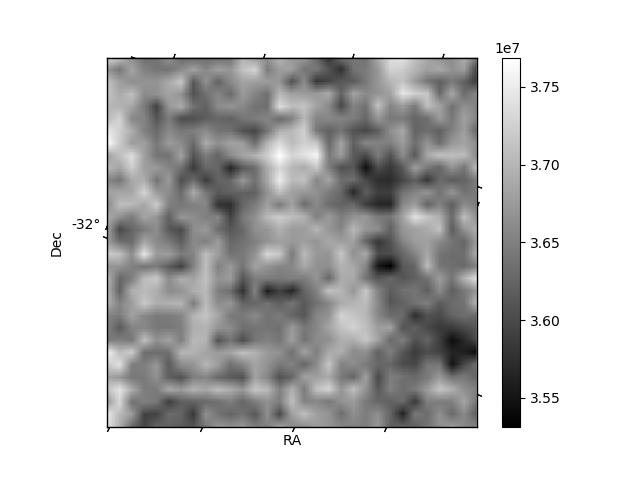
Quadrant B |
|---|---|---|---|
| Quadrant D | 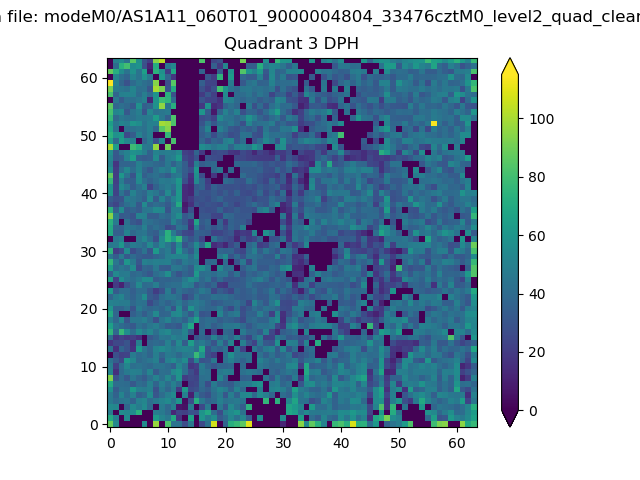 |
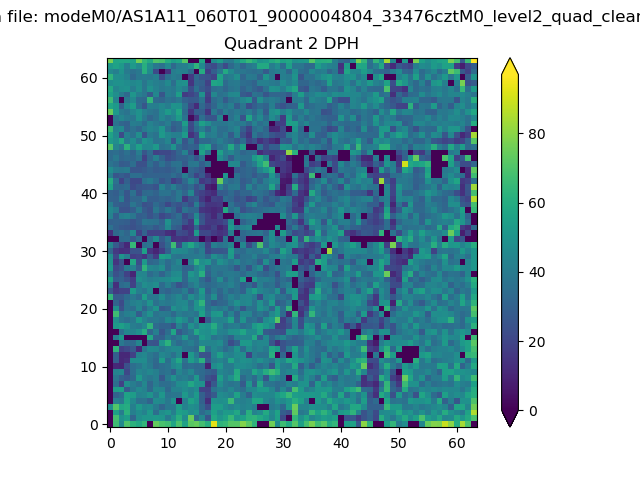 |
Quadrant C |
| Plot type | Count rate plots | Images |
|---|---|---|
| Comparison with Poisson distribution Blue bars denote a histogram of data divided into 1 sec bins. Red curve is a Poisson curve with rate = median count rate of data. |
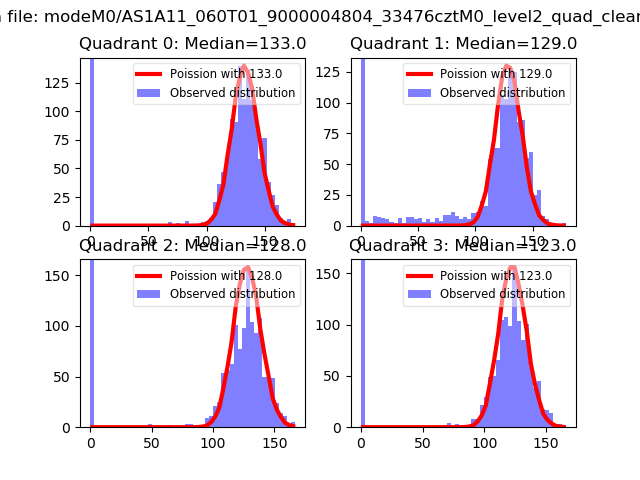 |
 |
| Quadrant-wise count rates Data is divided into 100 sec bins |
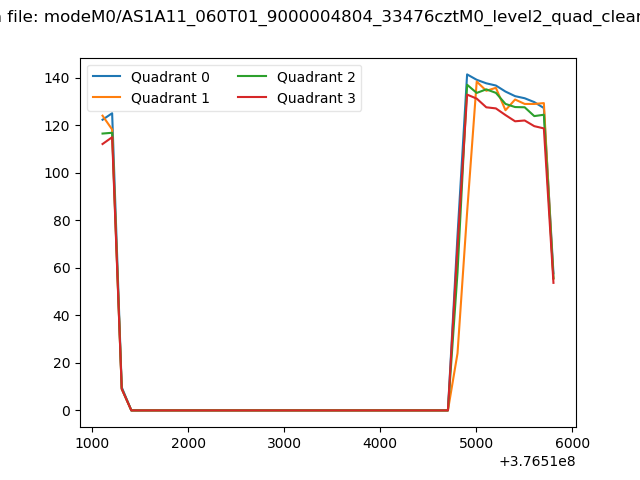 |
|
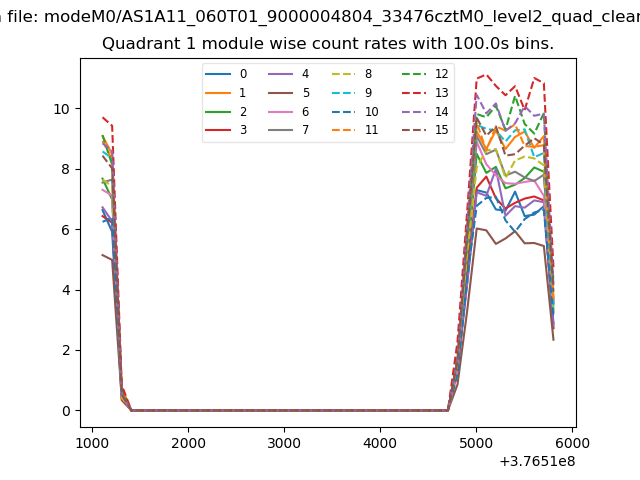
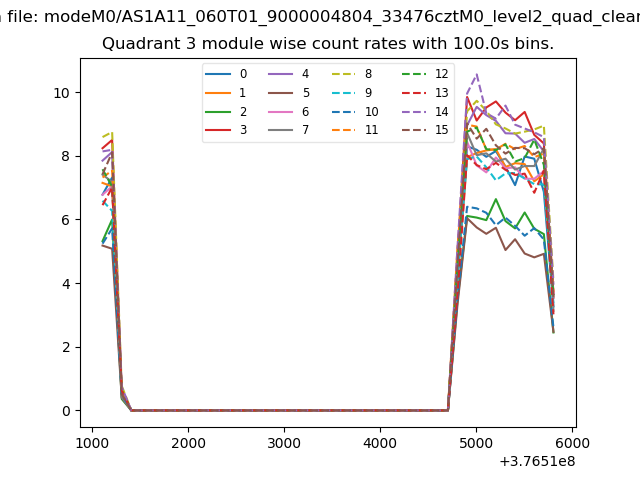
| Module-wise count rates for Quadrant A Data is divided into 100 sec bins |
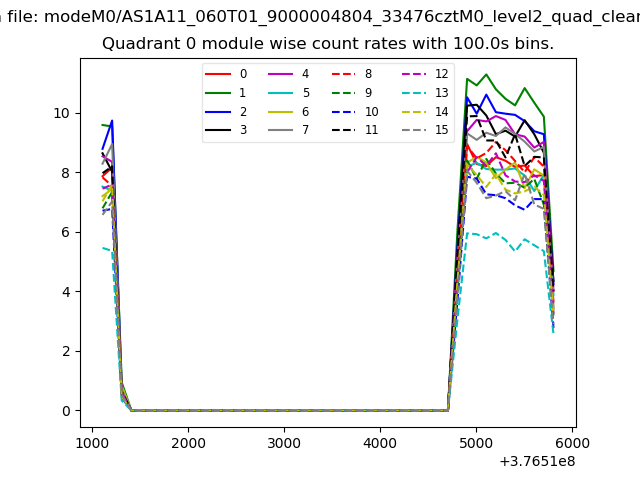 |
 |
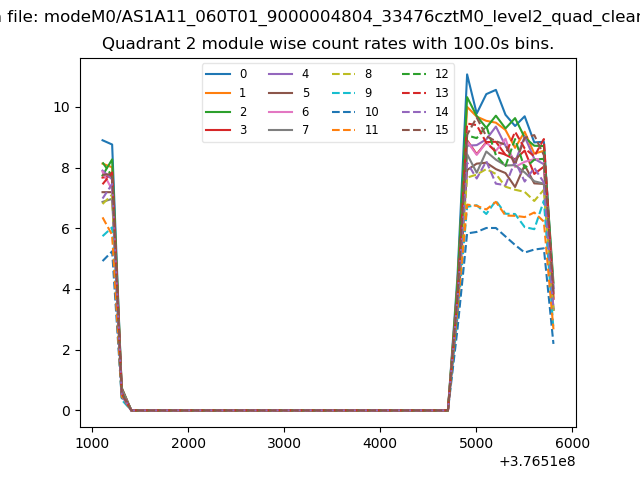
| Module-wise count rates for Quadrant B Data is divided into 100 sec bins |
 |
 |
| Module-wise count rates for Quadrant C Data is divided into 100 sec bins |
 |
 |
| Module-wise count rates for Quadrant D Data is divided into 100 sec bins |
 |
 |
| Parameter | Plot |
|---|---|
| CZT HV Monitor | 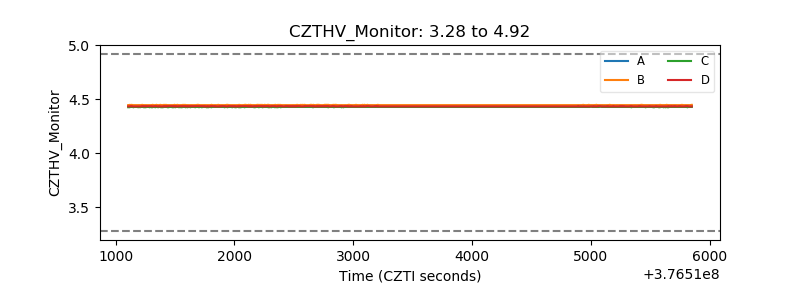 |
| D_VDD | 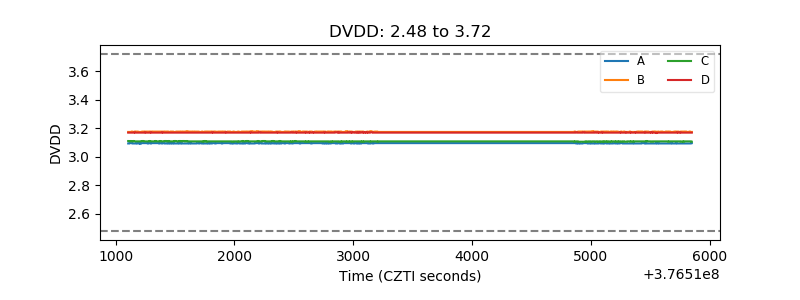 |
| Temperature 1 | 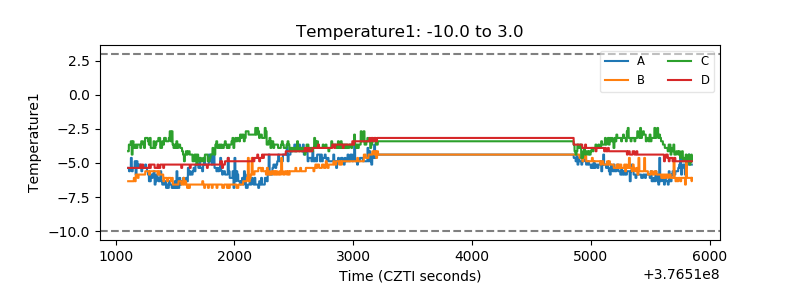 |
| Veto HV Monitor | 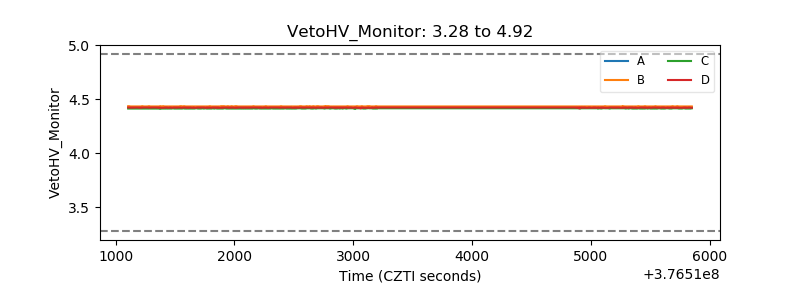 |
| Veto LLD | 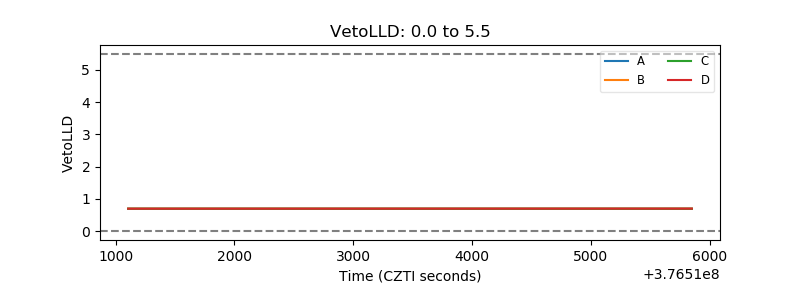 |
| Alpha Counter | 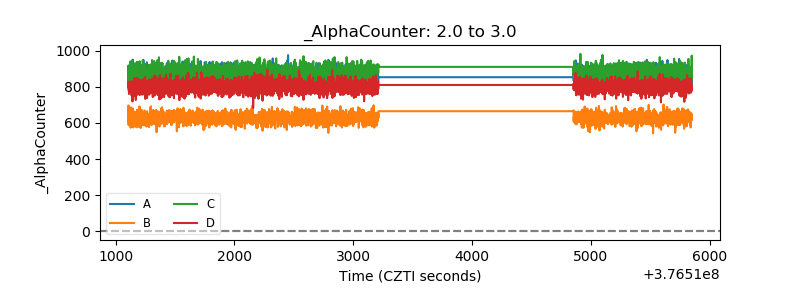 |
| _CPM_Rate | 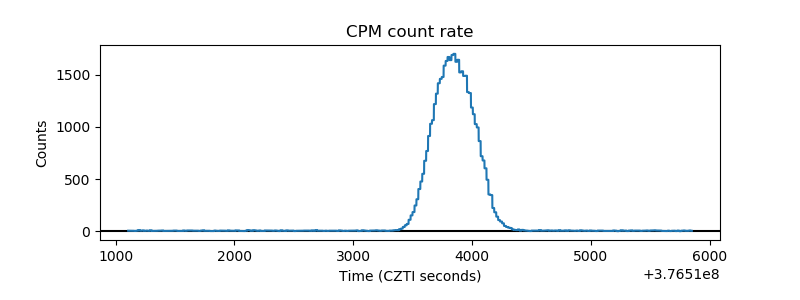 |
| CZT Counter | 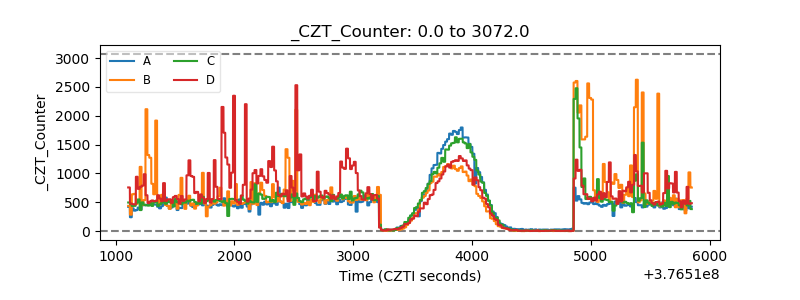 |
| +2.5 Volts monitor |  |
| +5 Volts monitor | 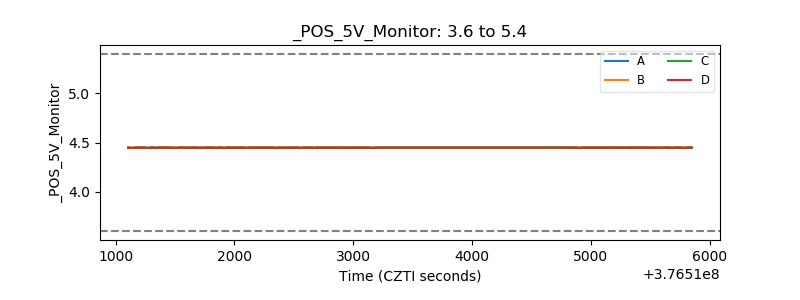 |
| _ROLL_ROT | 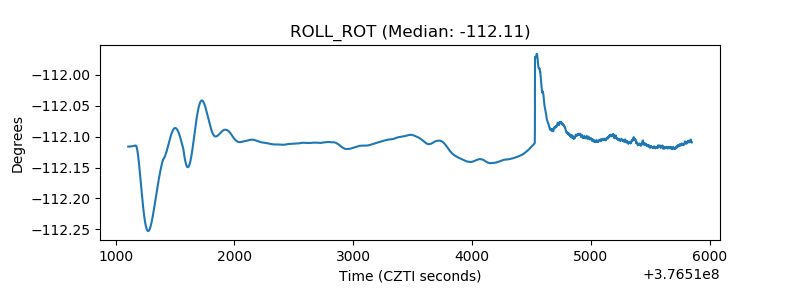 |
| _Roll_DEC | 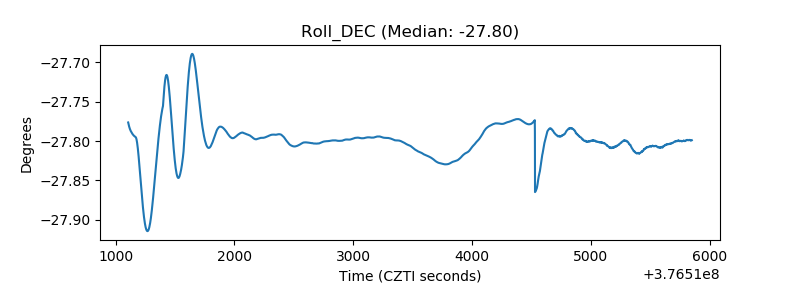 |
| _Roll_RA | 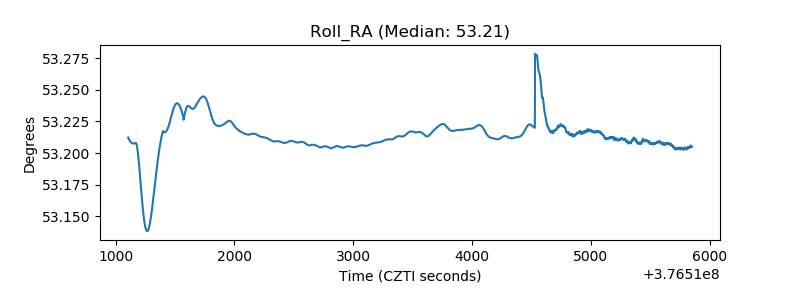 |
| Veto Counter |  |