| Param | Original file | Final file |
|---|---|---|
| Filename | modeM0/AS1A11_060T01_9000004804_33479cztM0_level2.evt | modeM0/AS1A11_060T01_9000004804_33479cztM0_level2_quad_clean.evt |
| Size (bytes) | 471,337,920 | 63,604,800 |
| Size | 449.5 MB | 60.7 MB |
| Events in quadrant A | 2,395,174 | 404,911 |
| Events in quadrant B | 3,874,527 | 401,603 |
| Events in quadrant C | 2,879,364 | 395,806 |
| Events in quadrant D | 4,780,951 | 367,373 |
| Mode M9 | |||
|---|---|---|---|
| Quadrant | BADHDUFLAG | Total packets | Discarded packets |
| A | 0 | 31 | 0 |
| B | 0 | 31 | 0 |
| C | 0 | 31 | 0 |
| D | 0 | 32 | 0 |
| Mode M0 | |||
|---|---|---|---|
| Quadrant | BADHDUFLAG | Total packets | Discarded packets |
| A | 0 | 10256 | 2 |
| B | 0 | 14885 | 1 |
| C | 0 | 11390 | 1 |
| D | 0 | 17520 | 1 |
| Mode SS | |||
|---|---|---|---|
| Quadrant | BADHDUFLAG | Total packets | Discarded packets |
| A | 0 | 102 | 0 |
| B | 0 | 102 | 0 |
| C | 0 | 102 | 0 |
| D | 0 | 102 | 0 |
| Quadrant | Total seconds | Saturated seconds | Saturation percentage |
|---|---|---|---|
| A | 5083 | 3 | 0.059020% |
| B | 5083 | 295 | 5.803659% |
| C | 5083 | 48 | 0.944324% |
| D | 5083 | 691 | 13.594334% |
Noise dominated data is calculated using 1-second bins in cleaned event files. If a bin has >2000 counts, and if more than 50% of those come from <1% of pixels, then it is considered to be noise-dominated and hence unusable.
| Quadrant | # 1 sec bins | Bins with >0 counts | Bins with >2000 counts | High rate bins dominated by noise | Noise dominated (total time) | Noise dominated (detector-on time) | Marked lightcurve |
|---|---|---|---|---|---|---|---|
| A | 6995 | 5084 | 0 | 0 | 0.00% | 0.00% | 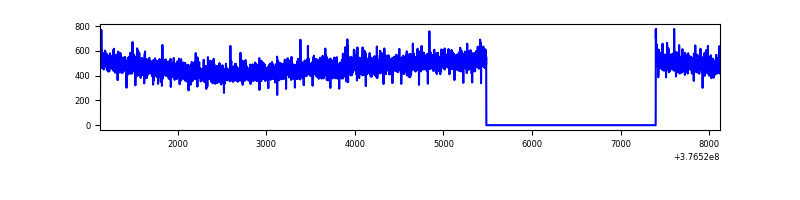 |
| B | 6995 | 5084 | 240 | 240 | 3.43% | 4.72% | 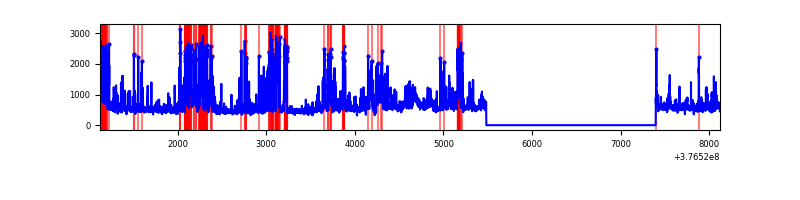 |
| C | 6995 | 5084 | 43 | 43 | 0.61% | 0.85% | 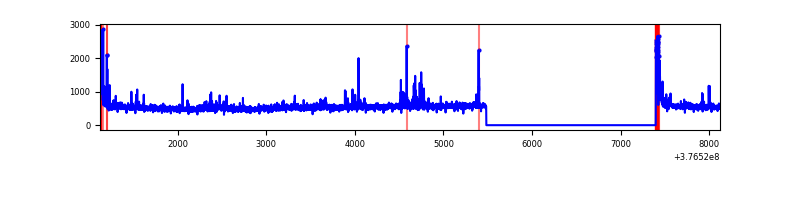 |
| D | 6994 | 5083 | 668 | 668 | 9.55% | 13.14% | 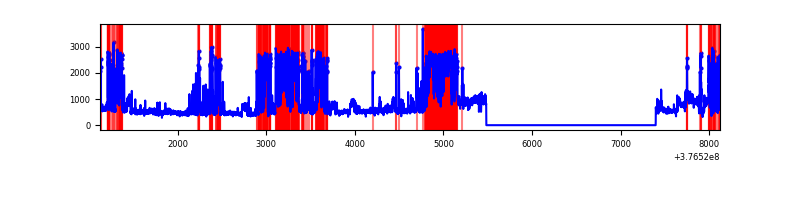 |
Top three noisy pixels from each quadrant. If the there are fewer than three noisy pixels in the level2.evt file, extra rows are filled as -1
| Pixel properties | Quadrant properties | ||||||
|---|---|---|---|---|---|---|---|
| Quadrant | DetID | PixID | Counts | Sigma | Mean | Median | Sigma |
| A | 13 | 254 | 9162 | 69.15 | 617 | 607 | 123.7 |
| A | 3 | 137 | 5971 | 43.36 | 617 | 607 | 123.7 |
| A | 10 | 83 | 5283 | 37.8 | 617 | 607 | 123.7 |
| B | 5 | 172 | 799586 | 6870.75 | 609 | 593 | 116.3 |
| B | 0 | 213 | 489581 | 4204.94 | 609 | 593 | 116.3 |
| B | 5 | 255 | 113740 | 972.98 | 609 | 593 | 116.3 |
| C | 15 | 214 | 220479 | 1564.89 | 607 | 613 | 140.5 |
| C | 0 | 10 | 162536 | 1152.48 | 607 | 613 | 140.5 |
| C | 14 | 254 | 46327 | 325.37 | 607 | 613 | 140.5 |
| D | 2 | 250 | 1328306 | 9661.08 | 567 | 553 | 137.4 |
| D | 8 | 195 | 604922 | 4397.55 | 567 | 553 | 137.4 |
| D | 12 | 6 | 373400 | 2712.93 | 567 | 553 | 137.4 |
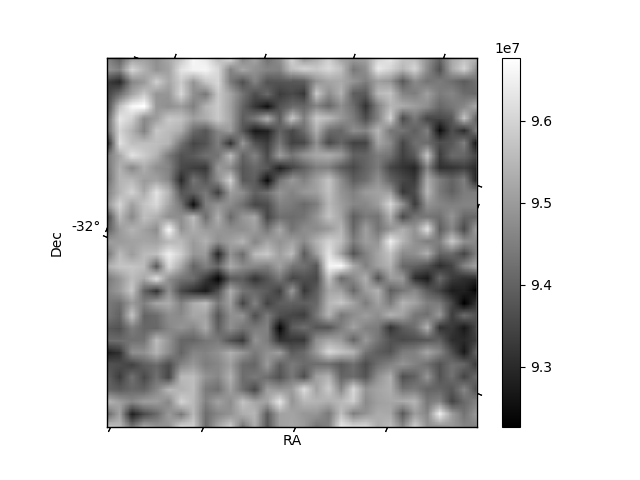
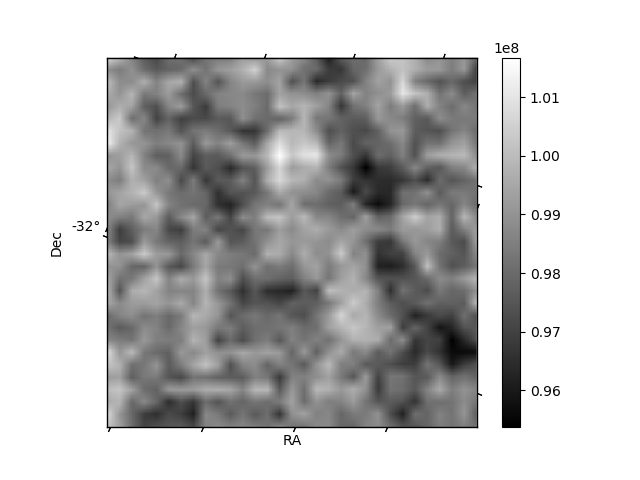
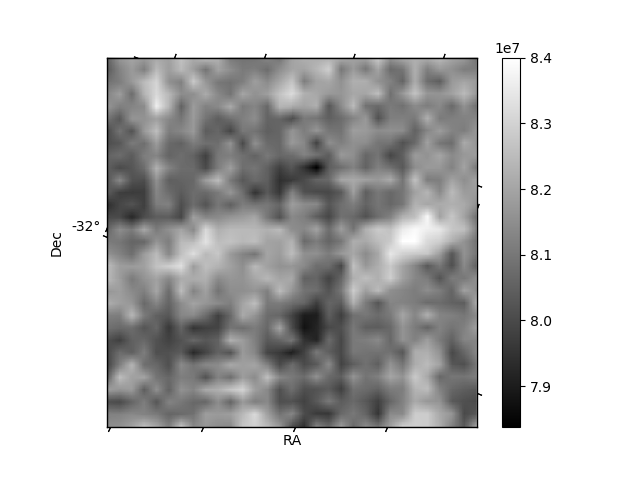
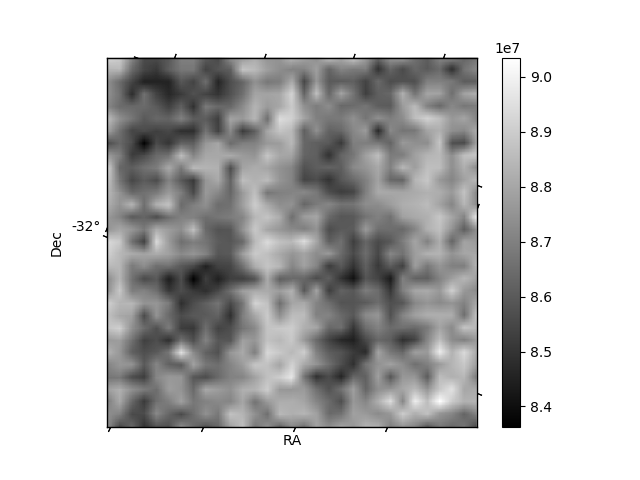
Histogram calculated using DETX and DETY for each event in the final _common_clean file
| Quadrant A |  |
 |
Quadrant B |
|---|---|---|---|
| Quadrant D |  |
 |
Quadrant C |
| Plot type | Count rate plots | Images |
|---|---|---|
| Comparison with Poisson distribution Blue bars denote a histogram of data divided into 1 sec bins. Red curve is a Poisson curve with rate = median count rate of data. |
 |
 |
| Quadrant-wise count rates Data is divided into 100 sec bins |
 |
|
| Module-wise count rates for Quadrant A Data is divided into 100 sec bins |
 |
 |
| Module-wise count rates for Quadrant B Data is divided into 100 sec bins |
 |
 |
| Module-wise count rates for Quadrant C Data is divided into 100 sec bins |
 |
 |
| Module-wise count rates for Quadrant D Data is divided into 100 sec bins |
 |
 |
| Parameter | Plot |
|---|---|
| CZT HV Monitor |  |
| D_VDD | 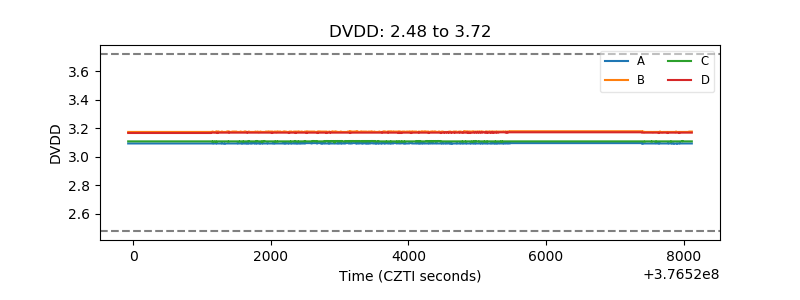 |
| Temperature 1 | 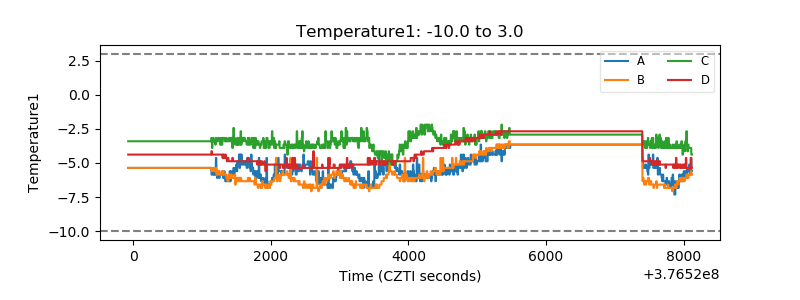 |
| Veto HV Monitor |  |
| Veto LLD |  |
| Alpha Counter |  |
| _CPM_Rate |  |
| CZT Counter |  |
| +2.5 Volts monitor |  |
| +5 Volts monitor |  |
| _ROLL_ROT |  |
| _Roll_DEC |  |
| _Roll_RA |  |
| Veto Counter |  |