| Param | Original file | Final file |
|---|---|---|
| Filename | modeM0/AS1A11_060T01_9000004804_33482cztM0_level2.evt | modeM0/AS1A11_060T01_9000004804_33482cztM0_level2_quad_clean.evt |
| Size (bytes) | 493,764,480 | 51,307,200 |
| Size | 470.9 MB | 48.9 MB |
| Events in quadrant A | 2,448,984 | 306,087 |
| Events in quadrant B | 3,483,736 | 309,462 |
| Events in quadrant C | 3,106,169 | 307,212 |
| Events in quadrant D | 5,579,096 | 283,009 |
| Mode M9 | |||
|---|---|---|---|
| Quadrant | BADHDUFLAG | Total packets | Discarded packets |
| A | 0 | 36 | 0 |
| B | 0 | 36 | 0 |
| C | 0 | 36 | 0 |
| D | 0 | 37 | 0 |
| Mode M0 | |||
|---|---|---|---|
| Quadrant | BADHDUFLAG | Total packets | Discarded packets |
| A | 0 | 10007 | 3 |
| B | 0 | 13266 | 2 |
| C | 0 | 12051 | 2 |
| D | 0 | 20004 | 2 |
| Mode SS | |||
|---|---|---|---|
| Quadrant | BADHDUFLAG | Total packets | Discarded packets |
| A | 0 | 102 | 0 |
| B | 0 | 102 | 0 |
| C | 0 | 102 | 0 |
| D | 0 | 102 | 0 |
| Quadrant | Total seconds | Saturated seconds | Saturation percentage |
|---|---|---|---|
| A | 4950 | 6 | 0.121212% |
| B | 4950 | 287 | 5.797980% |
| C | 4950 | 56 | 1.131313% |
| D | 4950 | 752 | 15.191919% |
Noise dominated data is calculated using 1-second bins in cleaned event files. If a bin has >2000 counts, and if more than 50% of those come from <1% of pixels, then it is considered to be noise-dominated and hence unusable.
| Quadrant | # 1 sec bins | Bins with >0 counts | Bins with >2000 counts | High rate bins dominated by noise | Noise dominated (total time) | Noise dominated (detector-on time) | Marked lightcurve |
|---|---|---|---|---|---|---|---|
| A | 7104 | 4952 | 0 | 0 | 0.00% | 0.00% | 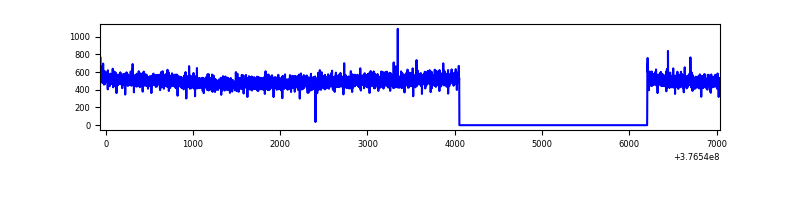 |
| B | 7104 | 4952 | 222 | 222 | 3.12% | 4.48% | 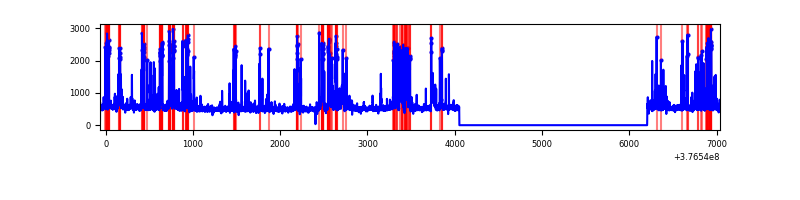 |
| C | 7104 | 4952 | 38 | 38 | 0.53% | 0.77% | 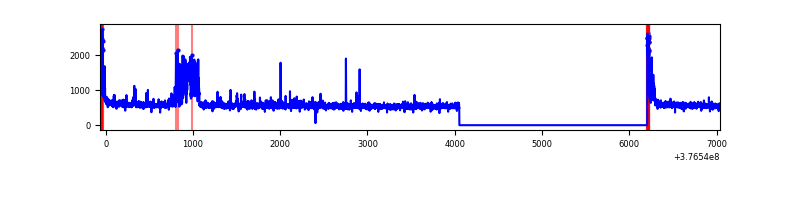 |
| D | 7104 | 4952 | 689 | 689 | 9.70% | 13.91% | 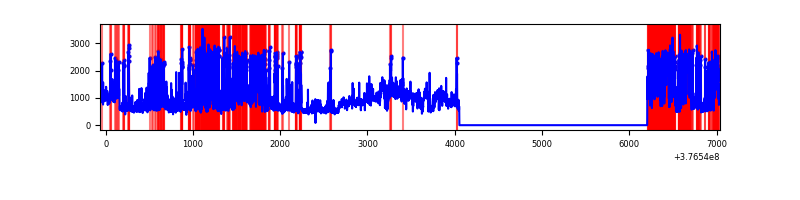 |
Top three noisy pixels from each quadrant. If the there are fewer than three noisy pixels in the level2.evt file, extra rows are filled as -1
| Pixel properties | Quadrant properties | ||||||
|---|---|---|---|---|---|---|---|
| Quadrant | DetID | PixID | Counts | Sigma | Mean | Median | Sigma |
| A | 13 | 254 | 8031 | 58.97 | 632 | 622 | 125.6 |
| A | 3 | 137 | 5940 | 42.33 | 632 | 622 | 125.6 |
| A | 10 | 83 | 5763 | 40.92 | 632 | 622 | 125.6 |
| B | 5 | 172 | 607839 | 5108.88 | 625 | 611 | 118.9 |
| B | 5 | 255 | 385917 | 3241.75 | 625 | 611 | 118.9 |
| B | 12 | 111 | 14056 | 113.12 | 625 | 611 | 118.9 |
| C | 10 | 49 | 238160 | 1638.26 | 630 | 638 | 145.0 |
| C | 15 | 214 | 215350 | 1480.94 | 630 | 638 | 145.0 |
| C | 0 | 10 | 146907 | 1008.86 | 630 | 638 | 145.0 |
| D | 2 | 250 | 1764673 | 12396.52 | 588 | 573 | 142.3 |
| D | 8 | 195 | 967982 | 6798.09 | 588 | 573 | 142.3 |
| D | 13 | 249 | 410937 | 2883.67 | 588 | 573 | 142.3 |
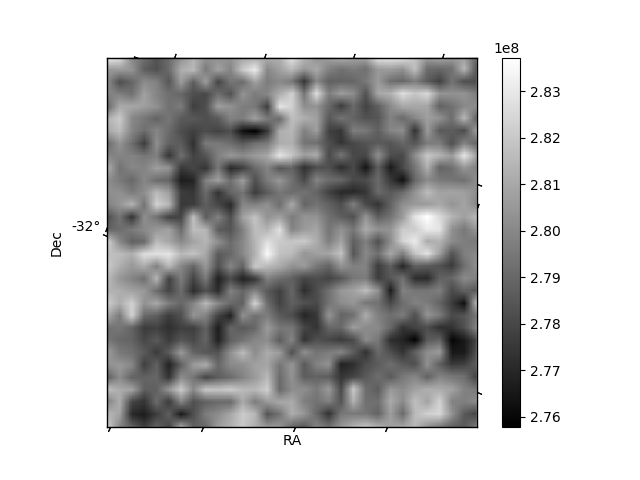
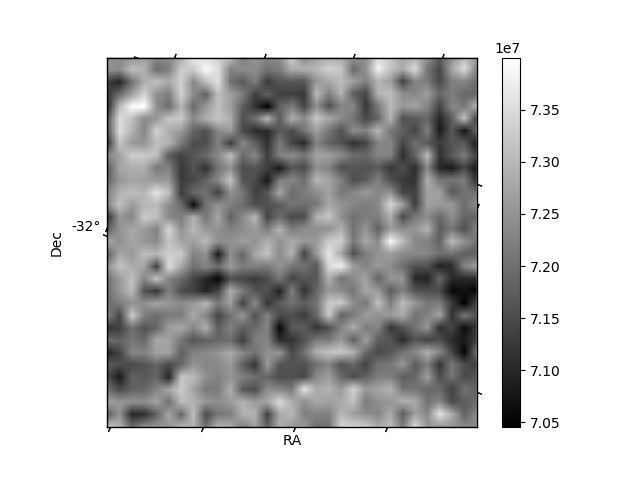
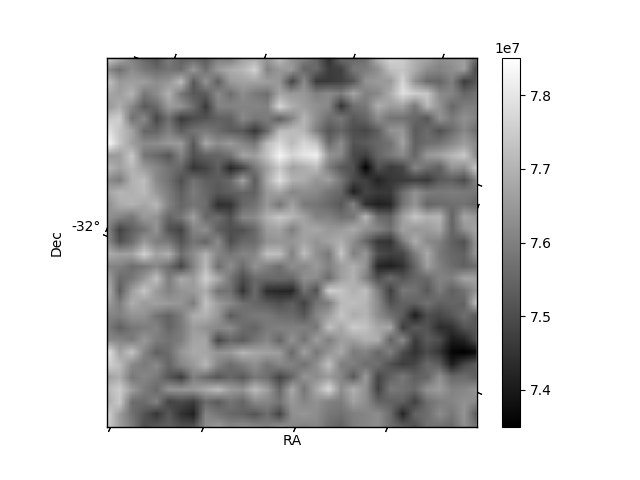
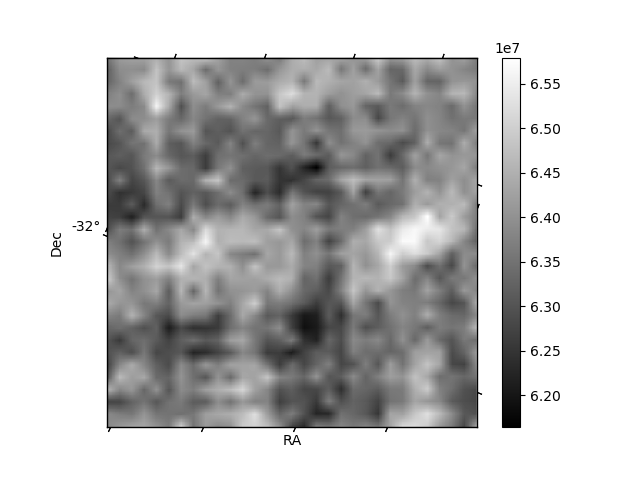
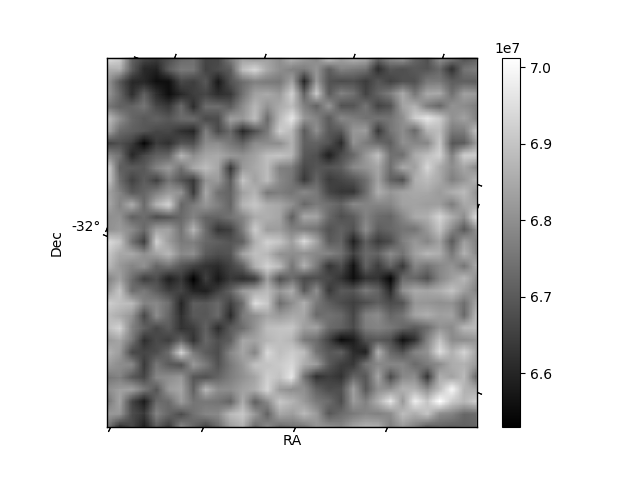
Histogram calculated using DETX and DETY for each event in the final _common_clean file
| Quadrant A | 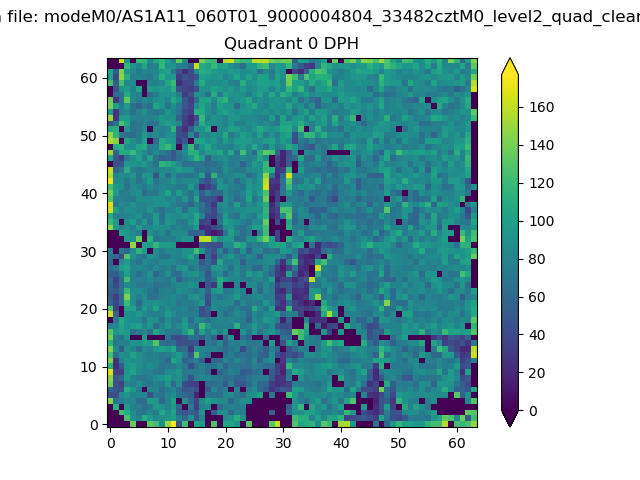 |
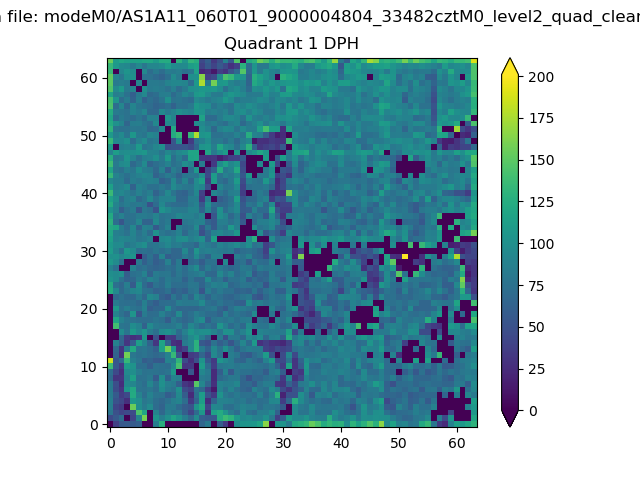 |
Quadrant B |
|---|---|---|---|
| Quadrant D | 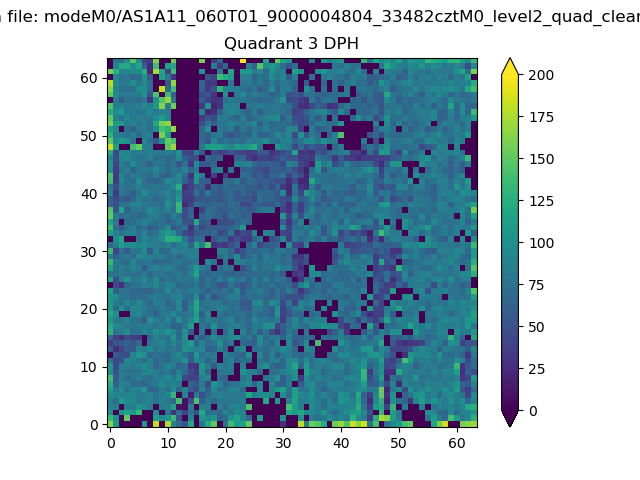 |
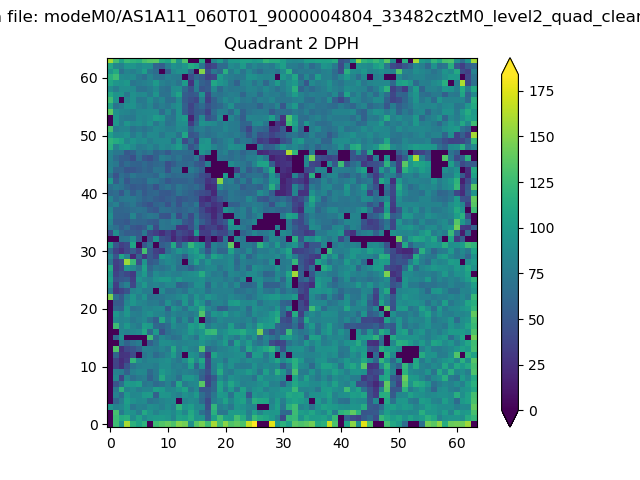 |
Quadrant C |
| Plot type | Count rate plots | Images |
|---|---|---|
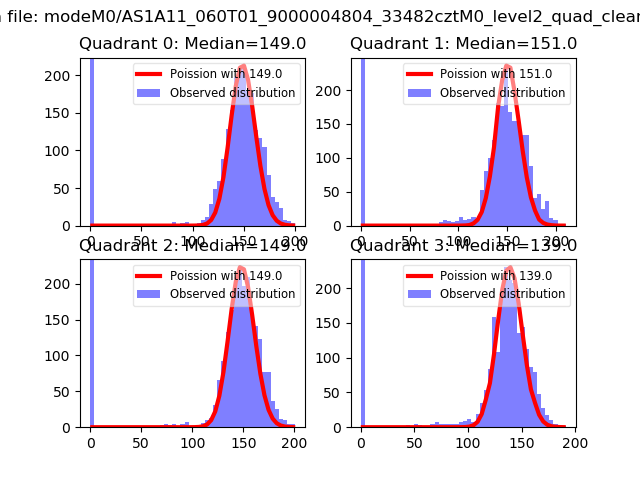
| Comparison with Poisson distribution Blue bars denote a histogram of data divided into 1 sec bins. Red curve is a Poisson curve with rate = median count rate of data. |
 |
 |
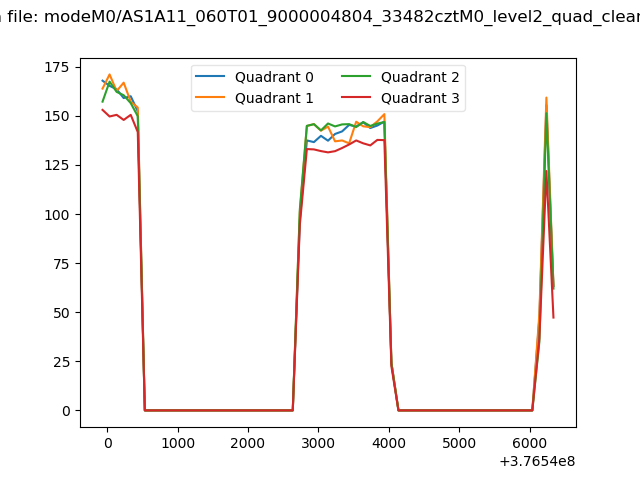
| Quadrant-wise count rates Data is divided into 100 sec bins |
 |
|
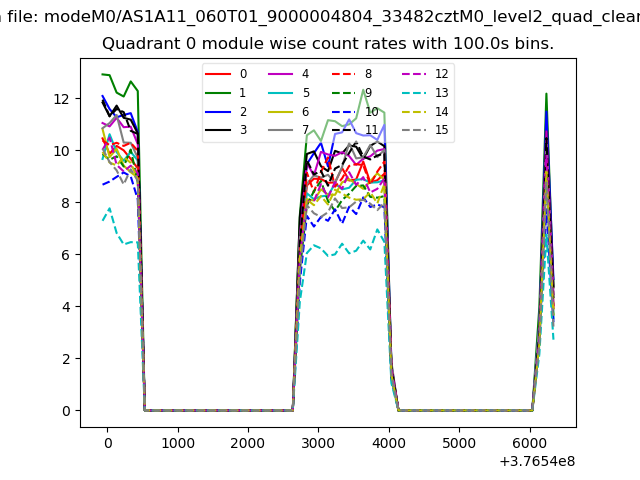
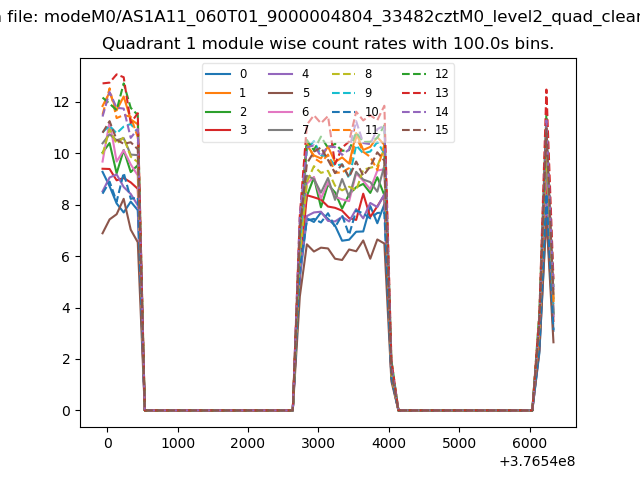
| Module-wise count rates for Quadrant A Data is divided into 100 sec bins |
 |
 |
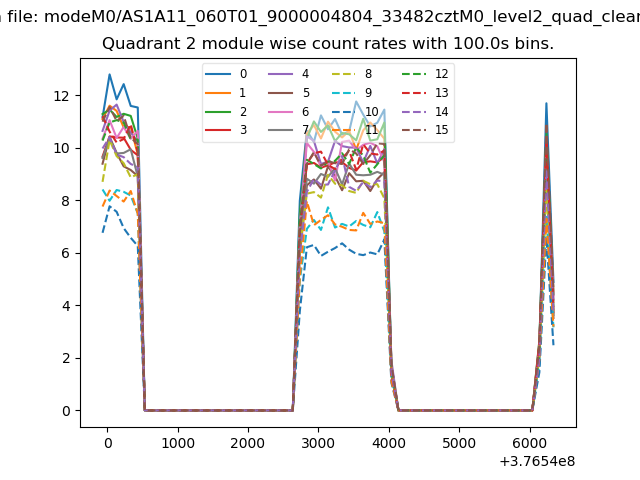
| Module-wise count rates for Quadrant B Data is divided into 100 sec bins |
 |
 |
| Module-wise count rates for Quadrant C Data is divided into 100 sec bins |
 |
 |
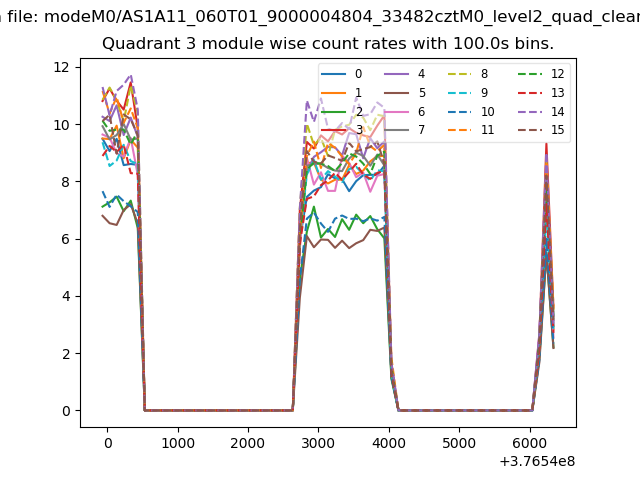
| Module-wise count rates for Quadrant D Data is divided into 100 sec bins |
 |
 |
| Parameter | Plot |
|---|---|
| CZT HV Monitor | 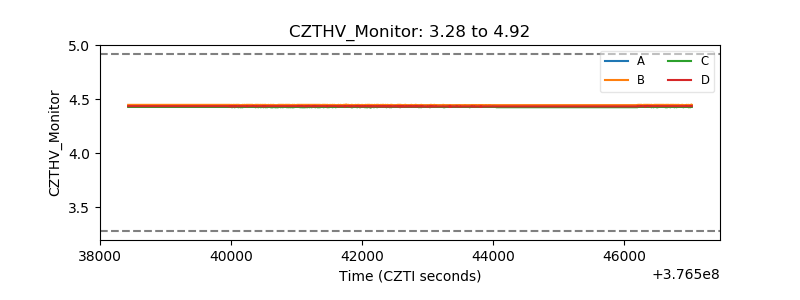 |
| D_VDD | 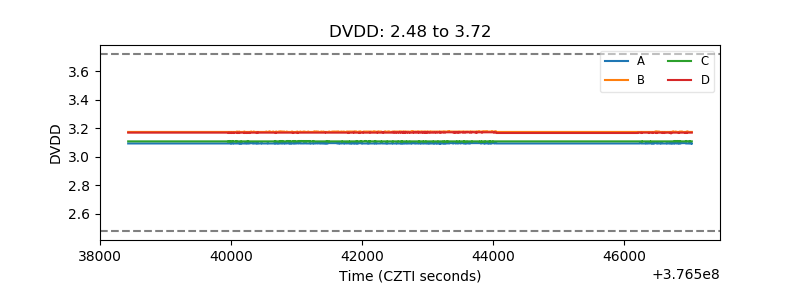 |
| Temperature 1 | 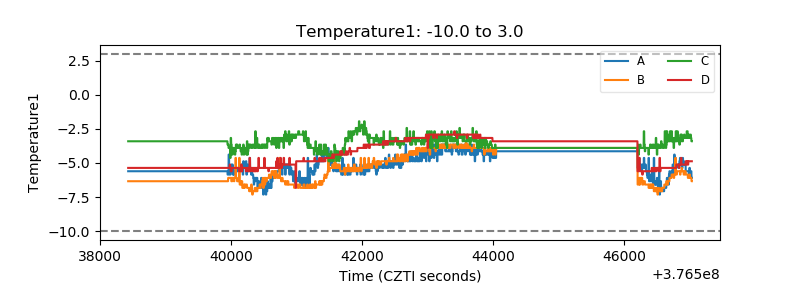 |
| Veto HV Monitor | 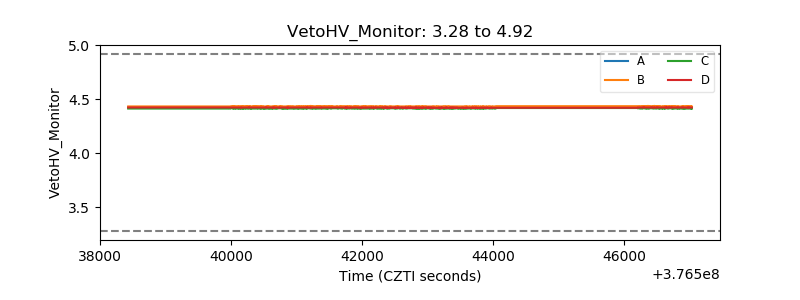 |
| Veto LLD | 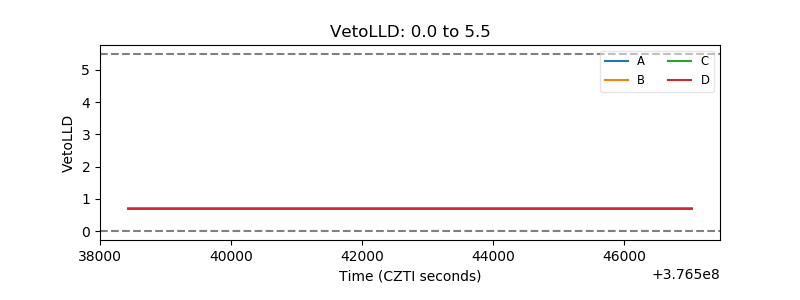 |
| Alpha Counter | 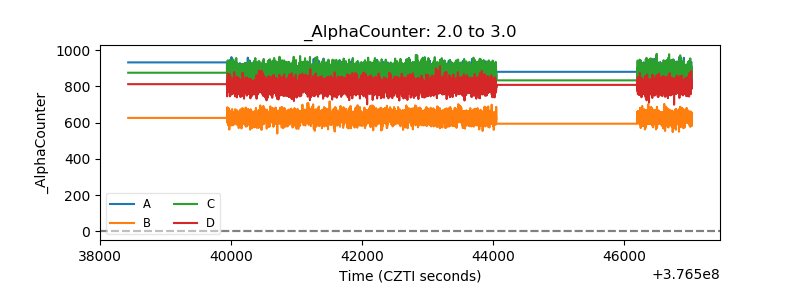 |
| _CPM_Rate | 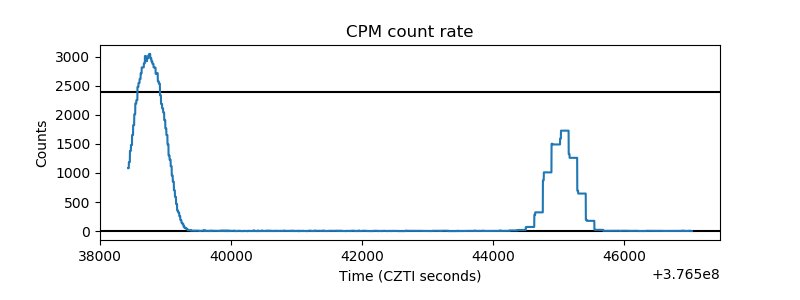 |
| CZT Counter | 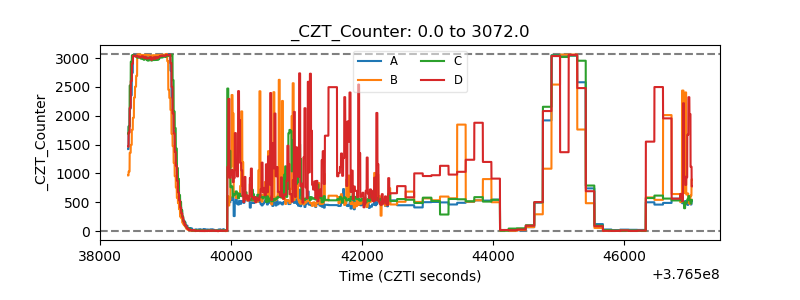 |
| +2.5 Volts monitor | 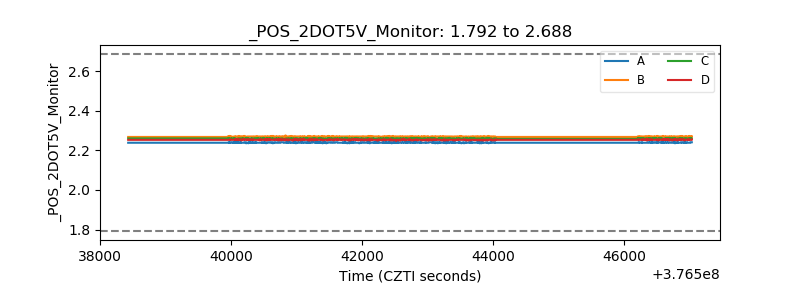 |
| +5 Volts monitor |  |
| _ROLL_ROT | 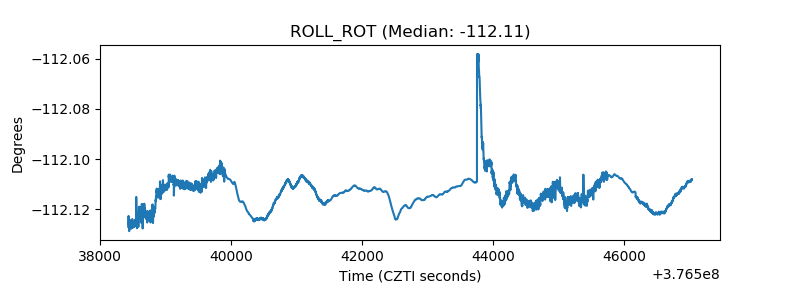 |
| _Roll_DEC | 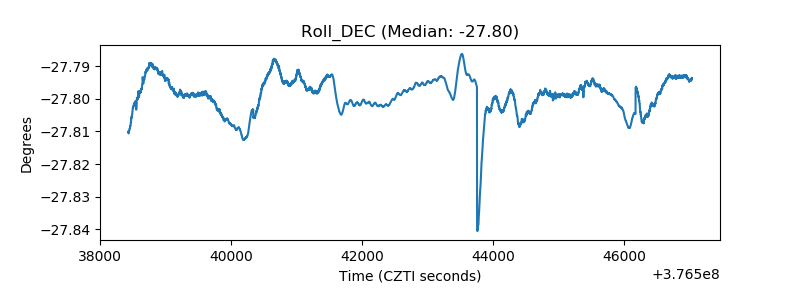 |
| _Roll_RA | 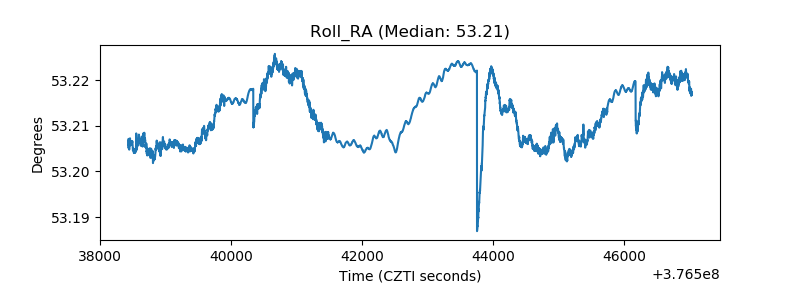 |
| Veto Counter | 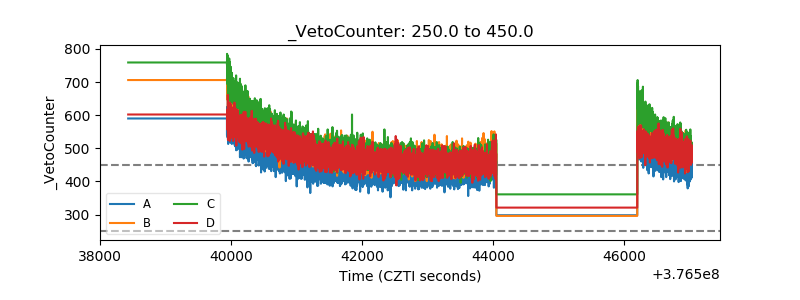 |