| Param | Original file | Final file |
|---|---|---|
| Filename | modeM0/AS1A11_060T01_9000004804_33484cztM0_level2.evt | modeM0/AS1A11_060T01_9000004804_33484cztM0_level2_quad_clean.evt |
| Size (bytes) | 512,683,200 | 57,078,720 |
| Size | 488.9 MB | 54.4 MB |
| Events in quadrant A | 2,492,459 | 358,847 |
| Events in quadrant B | 4,797,544 | 317,594 |
| Events in quadrant C | 2,986,970 | 358,564 |
| Events in quadrant D | 4,885,711 | 316,736 |
| Mode M9 | |||
|---|---|---|---|
| Quadrant | BADHDUFLAG | Total packets | Discarded packets |
| A | 0 | 40 | 0 |
| B | 0 | 40 | 0 |
| C | 0 | 40 | 0 |
| D | 0 | 40 | 0 |
| Mode M0 | |||
|---|---|---|---|
| Quadrant | BADHDUFLAG | Total packets | Discarded packets |
| A | 0 | 10774 | 3 |
| B | 0 | 17743 | 2 |
| C | 0 | 11894 | 2 |
| D | 0 | 18172 | 2 |
| Mode SS | |||
|---|---|---|---|
| Quadrant | BADHDUFLAG | Total packets | Discarded packets |
| A | 0 | 112 | 0 |
| B | 0 | 112 | 0 |
| C | 0 | 112 | 0 |
| D | 0 | 112 | 0 |
| Quadrant | Total seconds | Saturated seconds | Saturation percentage |
|---|---|---|---|
| A | 5365 | 6 | 0.111836% |
| B | 5365 | 763 | 14.221808% |
| C | 5365 | 44 | 0.820130% |
| D | 5365 | 488 | 9.095993% |
Noise dominated data is calculated using 1-second bins in cleaned event files. If a bin has >2000 counts, and if more than 50% of those come from <1% of pixels, then it is considered to be noise-dominated and hence unusable.
| Quadrant | # 1 sec bins | Bins with >0 counts | Bins with >2000 counts | High rate bins dominated by noise | Noise dominated (total time) | Noise dominated (detector-on time) | Marked lightcurve |
|---|---|---|---|---|---|---|---|
| A | 9341 | 5367 | 0 | 0 | 0.00% | 0.00% | 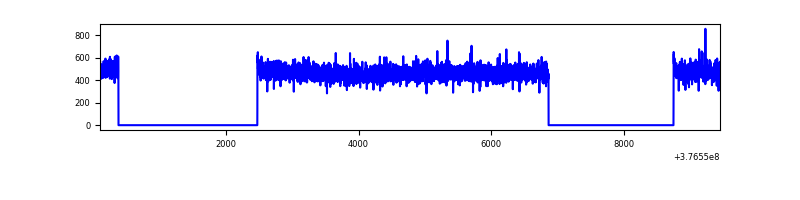 |
| B | 9341 | 5366 | 609 | 609 | 6.52% | 11.35% | 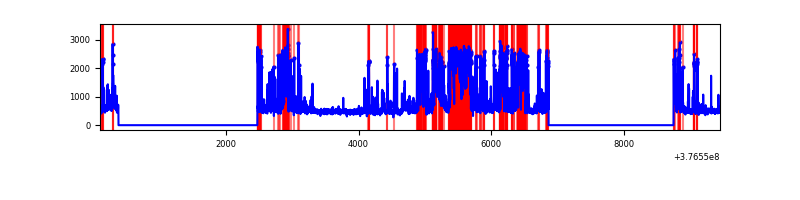 |
| C | 9341 | 5367 | 31 | 31 | 0.33% | 0.58% | 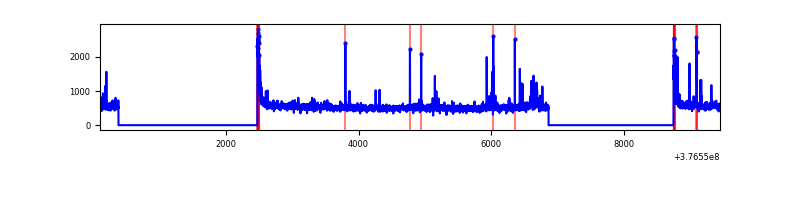 |
| D | 9341 | 5367 | 465 | 465 | 4.98% | 8.66% | 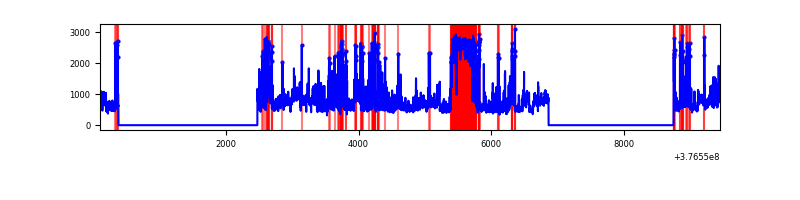 |
Top three noisy pixels from each quadrant. If the there are fewer than three noisy pixels in the level2.evt file, extra rows are filled as -1
| Pixel properties | Quadrant properties | ||||||
|---|---|---|---|---|---|---|---|
| Quadrant | DetID | PixID | Counts | Sigma | Mean | Median | Sigma |
| A | 13 | 254 | 8658 | 62.34 | 643 | 630 | 128.8 |
| A | 3 | 137 | 6416 | 44.93 | 643 | 630 | 128.8 |
| A | 10 | 83 | 5719 | 39.51 | 643 | 630 | 128.8 |
| B | 5 | 172 | 1760196 | 15184.94 | 605 | 589 | 115.9 |
| B | 0 | 213 | 398370 | 3432.74 | 605 | 589 | 115.9 |
| B | 5 | 255 | 206405 | 1776.14 | 605 | 589 | 115.9 |
| C | 15 | 214 | 234353 | 1606.68 | 629 | 635 | 145.5 |
| C | 0 | 10 | 131268 | 898.03 | 629 | 635 | 145.5 |
| C | 1 | 23 | 67764 | 461.47 | 629 | 635 | 145.5 |
| D | 2 | 250 | 1140311 | 7869.25 | 598 | 581 | 144.8 |
| D | 8 | 195 | 875141 | 6038.39 | 598 | 581 | 144.8 |
| D | 13 | 249 | 218324 | 1503.4 | 598 | 581 | 144.8 |
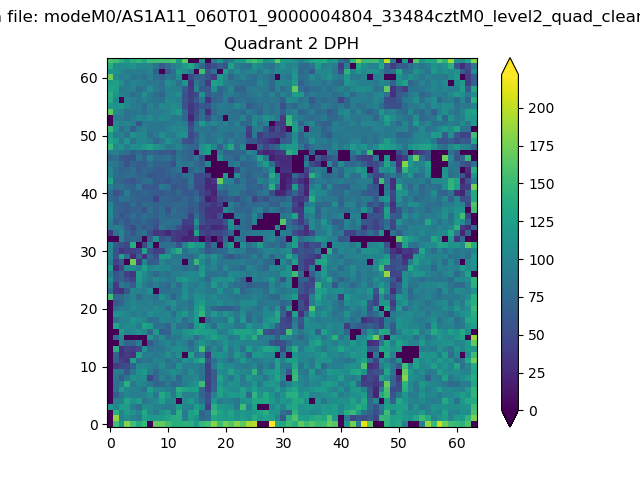
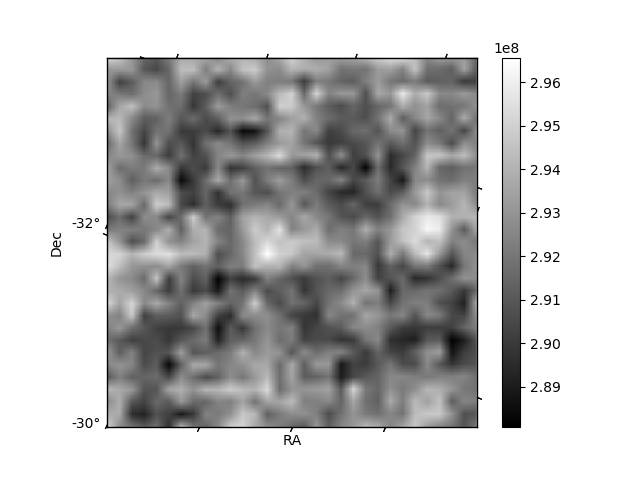
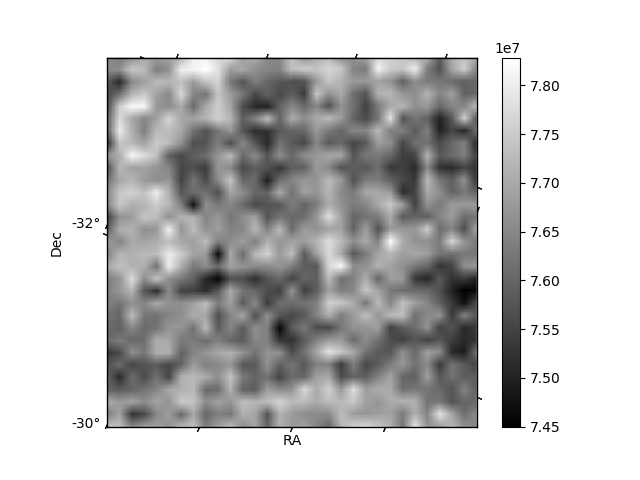
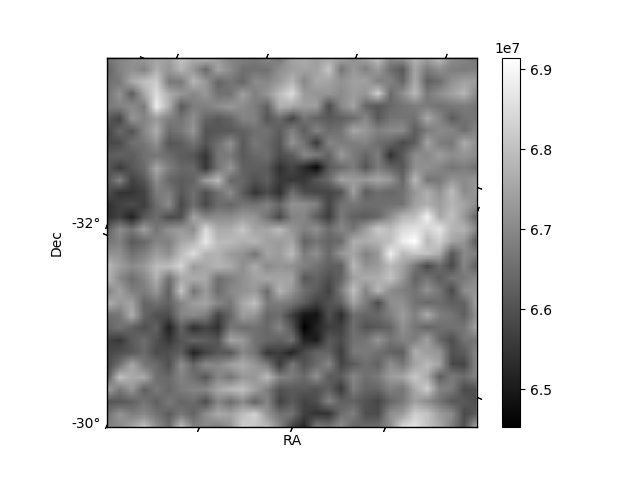
Histogram calculated using DETX and DETY for each event in the final _common_clean file
| Quadrant A | 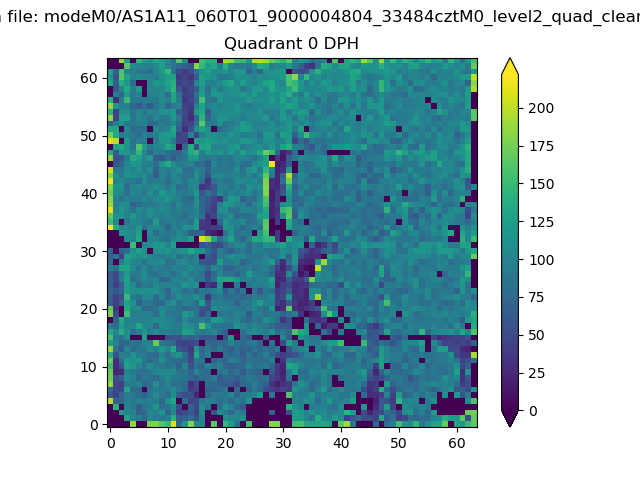 |
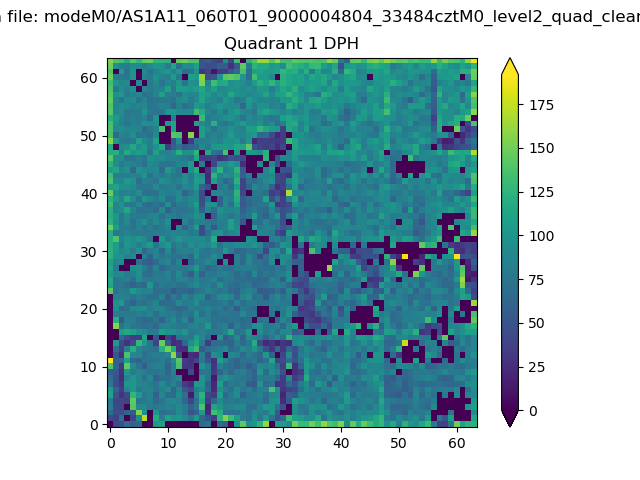 |
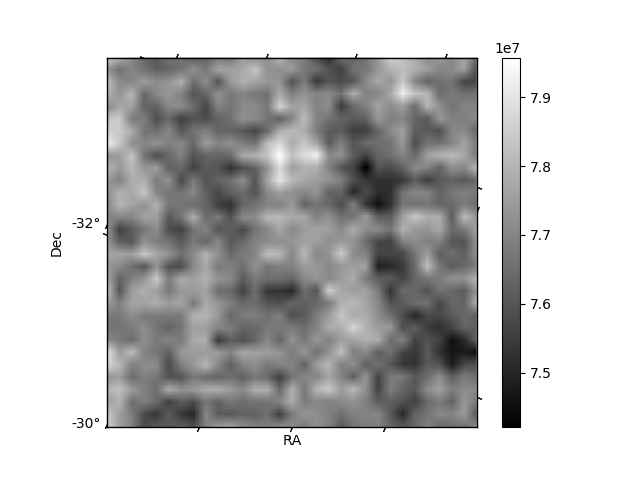
Quadrant B |
|---|---|---|---|
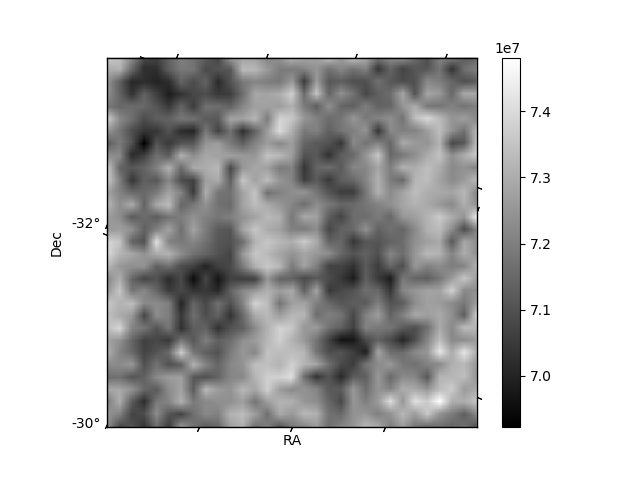
| Quadrant D | 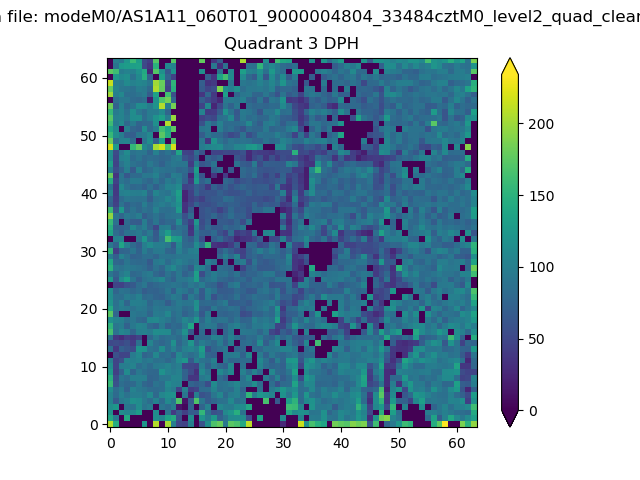 |
 |
Quadrant C |
| Plot type | Count rate plots | Images |
|---|---|---|
| Comparison with Poisson distribution Blue bars denote a histogram of data divided into 1 sec bins. Red curve is a Poisson curve with rate = median count rate of data. |
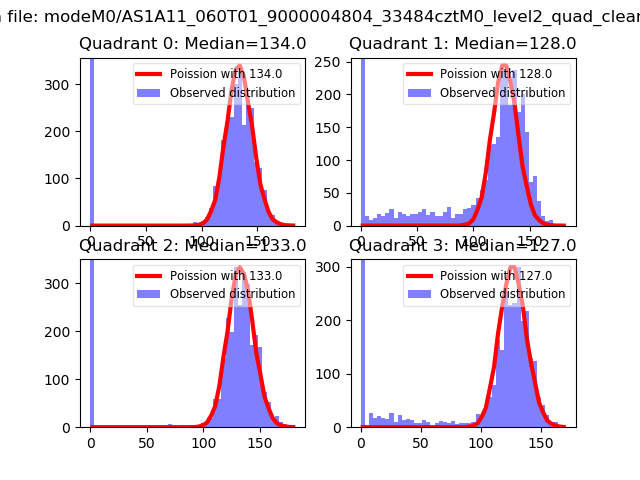 |
 |
| Quadrant-wise count rates Data is divided into 100 sec bins |
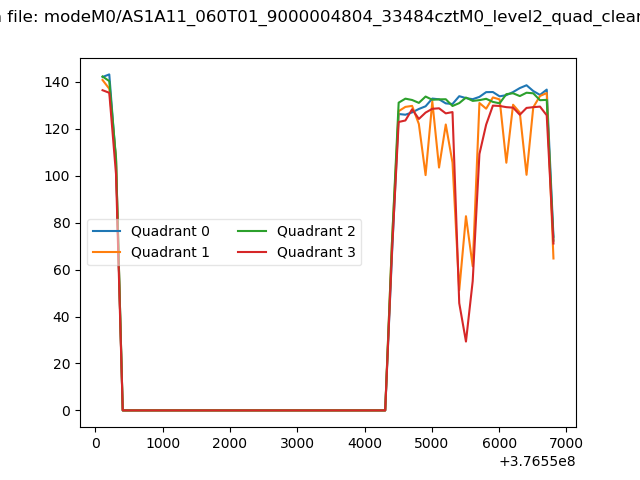 |
|
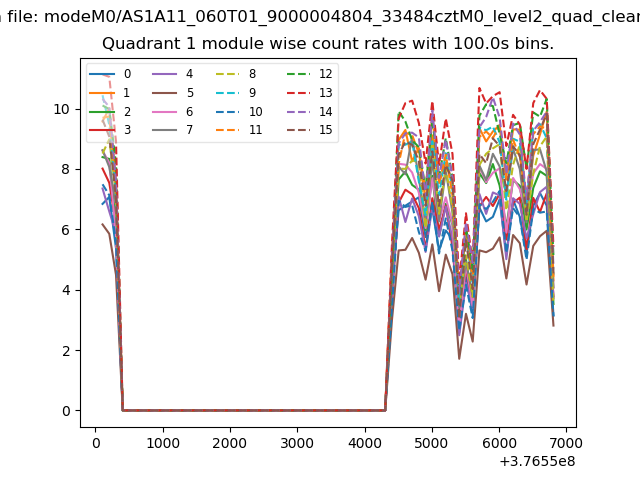
| Module-wise count rates for Quadrant A Data is divided into 100 sec bins |
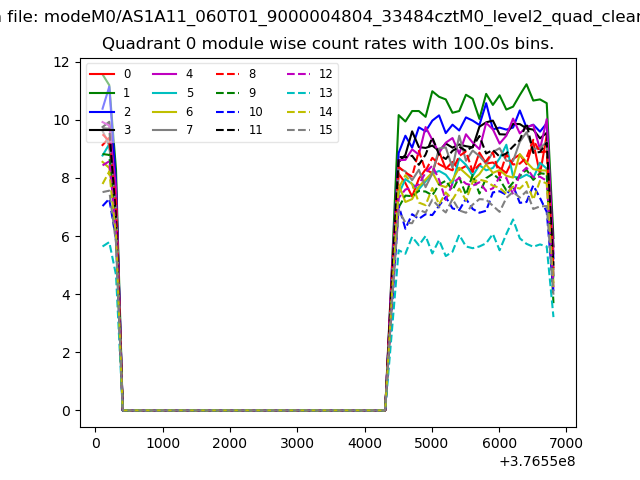 |
 |
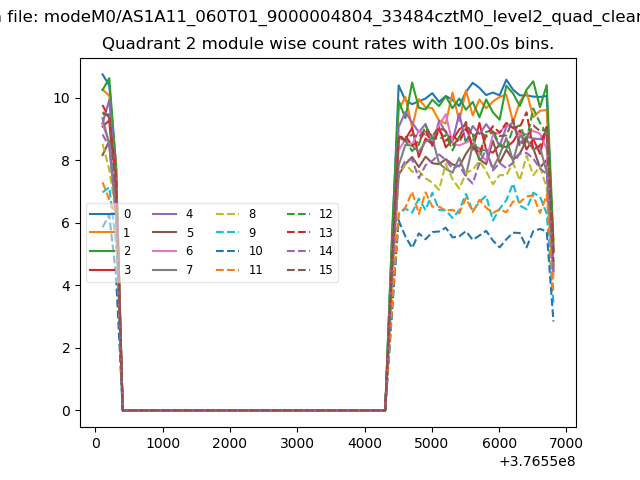
| Module-wise count rates for Quadrant B Data is divided into 100 sec bins |
 |
 |
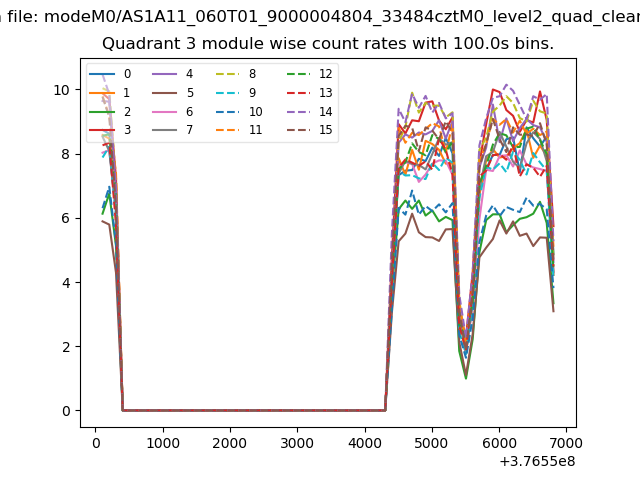
| Module-wise count rates for Quadrant C Data is divided into 100 sec bins |
 |
 |
| Module-wise count rates for Quadrant D Data is divided into 100 sec bins |
 |
 |
| Parameter | Plot |
|---|---|
| CZT HV Monitor | 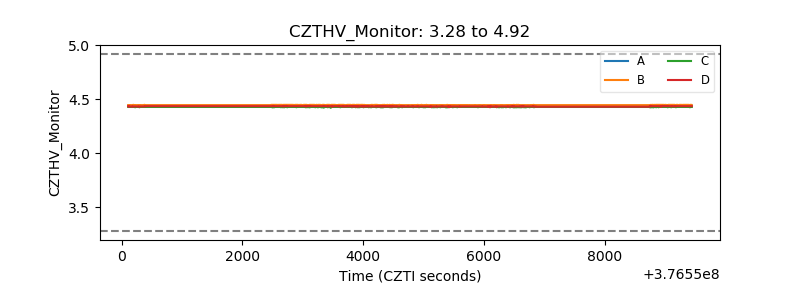 |
| D_VDD | 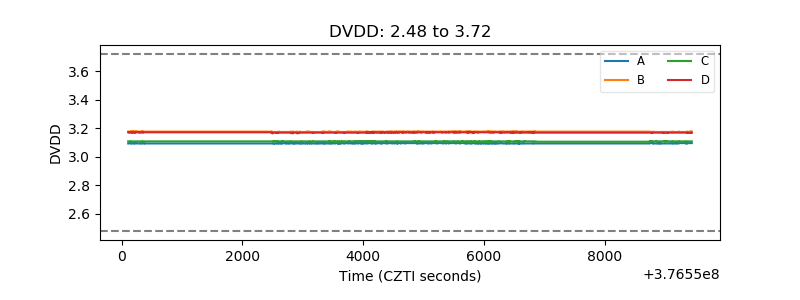 |
| Temperature 1 | 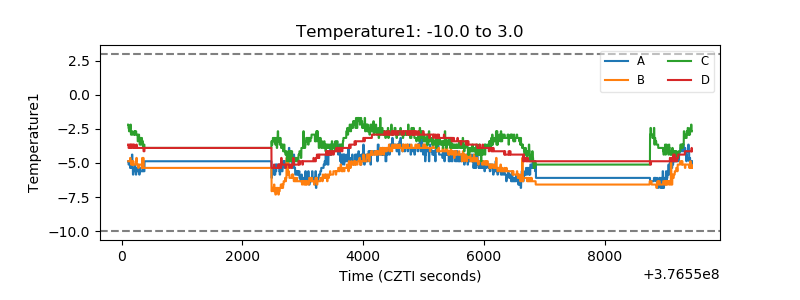 |
| Veto HV Monitor | 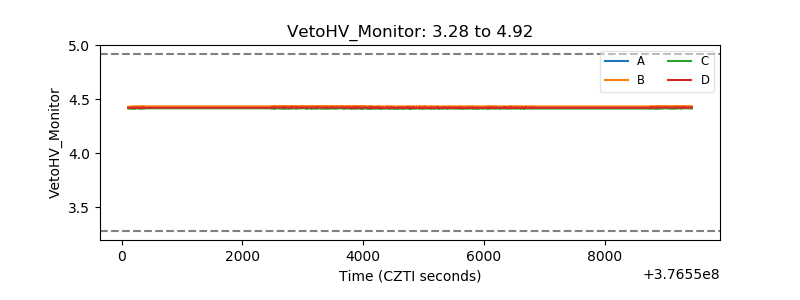 |
| Veto LLD | 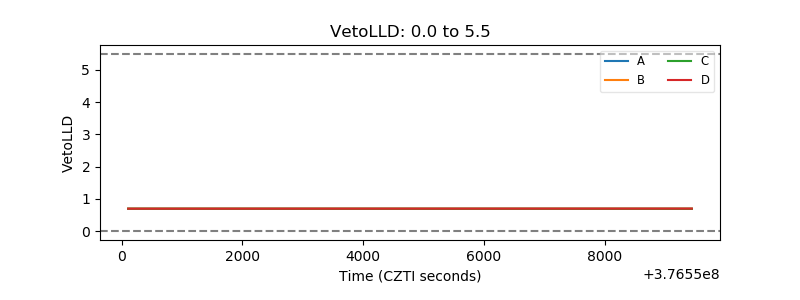 |
| Alpha Counter | 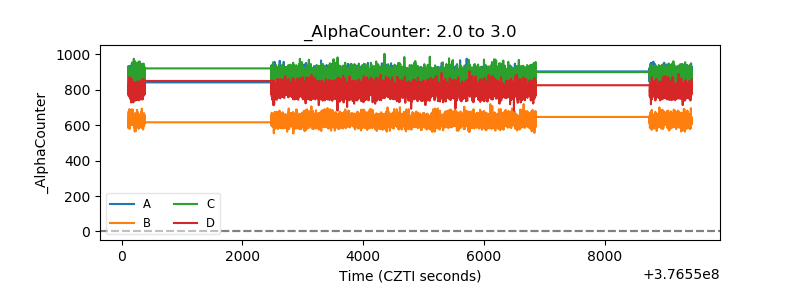 |
| _CPM_Rate |  |
| CZT Counter | 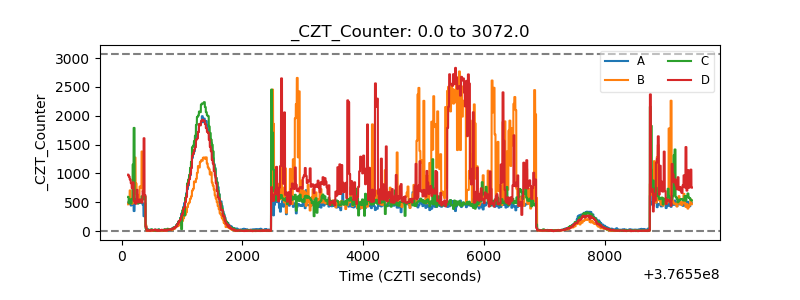 |
| +2.5 Volts monitor |  |
| +5 Volts monitor | 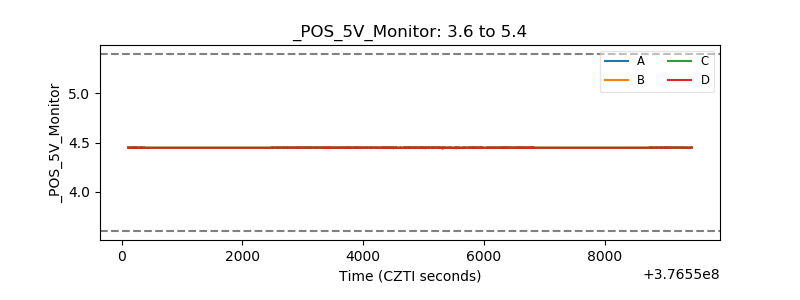 |
| _ROLL_ROT | 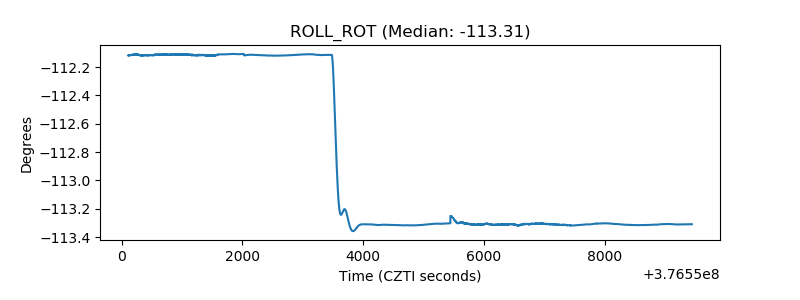 |
| _Roll_DEC | 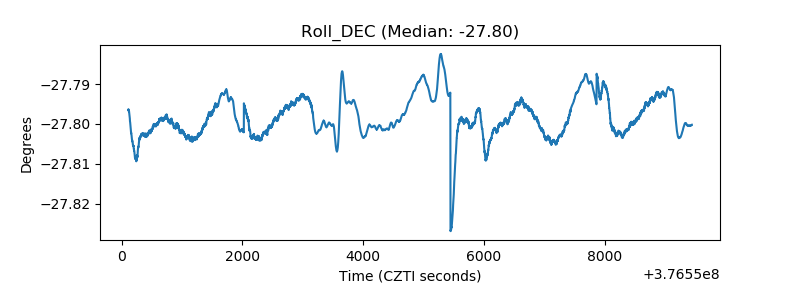 |
| _Roll_RA | 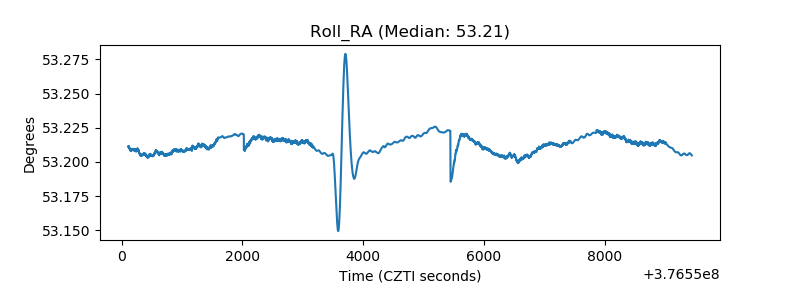 |
| Veto Counter | 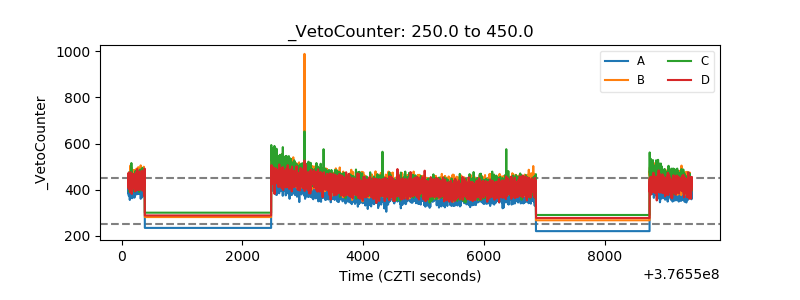 |