| Param | Original file | Final file |
|---|---|---|
| Filename | modeM0/AS1A11_060T01_9000004804_33486cztM0_level2.evt | modeM0/AS1A11_060T01_9000004804_33486cztM0_level2_quad_clean.evt |
| Size (bytes) | 588,778,560 | 82,915,200 |
| Size | 561.5 MB | 79.1 MB |
| Events in quadrant A | 2,881,246 | 541,688 |
| Events in quadrant B | 4,783,426 | 520,555 |
| Events in quadrant C | 3,511,042 | 534,780 |
| Events in quadrant D | 6,226,794 | 471,660 |
| Mode M9 | |||
|---|---|---|---|
| Quadrant | BADHDUFLAG | Total packets | Discarded packets |
| A | 0 | 28 | 0 |
| B | 0 | 28 | 0 |
| C | 0 | 28 | 0 |
| D | 0 | 28 | 0 |
| Mode M0 | |||
|---|---|---|---|
| Quadrant | BADHDUFLAG | Total packets | Discarded packets |
| A | 0 | 12693 | 3 |
| B | 0 | 18255 | 2 |
| C | 0 | 14208 | 2 |
| D | 0 | 22704 | 2 |
| Mode SS | |||
|---|---|---|---|
| Quadrant | BADHDUFLAG | Total packets | Discarded packets |
| A | 0 | 132 | 0 |
| B | 0 | 132 | 0 |
| C | 0 | 132 | 0 |
| D | 0 | 132 | 0 |
| Quadrant | Total seconds | Saturated seconds | Saturation percentage |
|---|---|---|---|
| A | 6325 | 6 | 0.094862% |
| B | 6325 | 567 | 8.964427% |
| C | 6325 | 63 | 0.996047% |
| D | 6325 | 638 | 10.086957% |
Noise dominated data is calculated using 1-second bins in cleaned event files. If a bin has >2000 counts, and if more than 50% of those come from <1% of pixels, then it is considered to be noise-dominated and hence unusable.
| Quadrant | # 1 sec bins | Bins with >0 counts | Bins with >2000 counts | High rate bins dominated by noise | Noise dominated (total time) | Noise dominated (detector-on time) | Marked lightcurve |
|---|---|---|---|---|---|---|---|
| A | 9161 | 6327 | 0 | 0 | 0.00% | 0.00% | 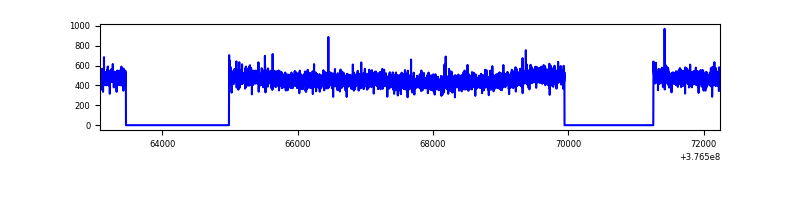 |
| B | 9161 | 6327 | 446 | 446 | 4.87% | 7.05% | 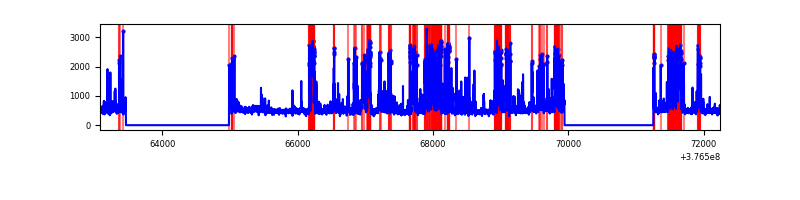 |
| C | 9161 | 6327 | 42 | 42 | 0.46% | 0.66% | 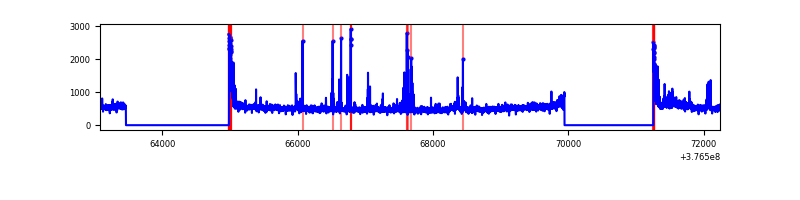 |
| D | 9161 | 6327 | 631 | 631 | 6.89% | 9.97% | 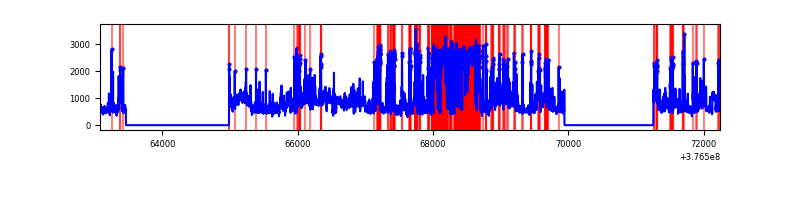 |
Top three noisy pixels from each quadrant. If the there are fewer than three noisy pixels in the level2.evt file, extra rows are filled as -1
| Pixel properties | Quadrant properties | ||||||
|---|---|---|---|---|---|---|---|
| Quadrant | DetID | PixID | Counts | Sigma | Mean | Median | Sigma |
| A | 13 | 254 | 10383 | 64.83 | 743 | 728 | 148.9 |
| A | 3 | 137 | 7418 | 44.92 | 743 | 728 | 148.9 |
| A | 13 | 6 | 6532 | 38.97 | 743 | 728 | 148.9 |
| B | 5 | 172 | 1497776 | 10873.5 | 714 | 695 | 137.7 |
| B | 0 | 213 | 254752 | 1845.25 | 714 | 695 | 137.7 |
| B | 5 | 255 | 83744 | 603.2 | 714 | 695 | 137.7 |
| C | 15 | 214 | 271829 | 1615.83 | 723 | 730 | 167.8 |
| C | 1 | 23 | 160699 | 953.46 | 723 | 730 | 167.8 |
| C | 0 | 10 | 143700 | 852.14 | 723 | 730 | 167.8 |
| D | 8 | 195 | 1419202 | 8373.43 | 691 | 672 | 169.4 |
| D | 12 | 6 | 908053 | 5356.17 | 691 | 672 | 169.4 |
| D | 2 | 250 | 874528 | 5158.28 | 691 | 672 | 169.4 |
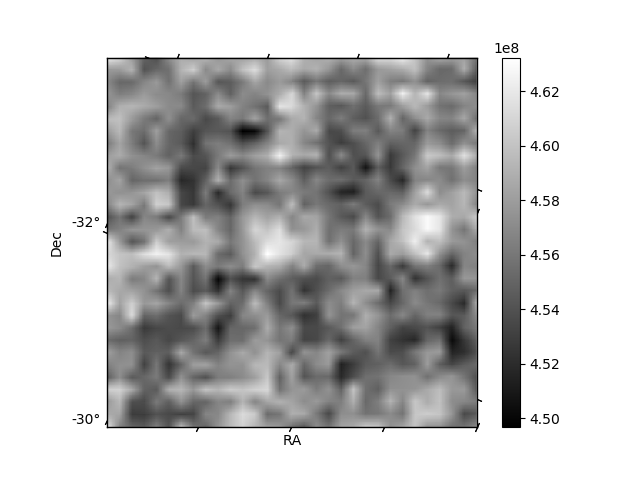
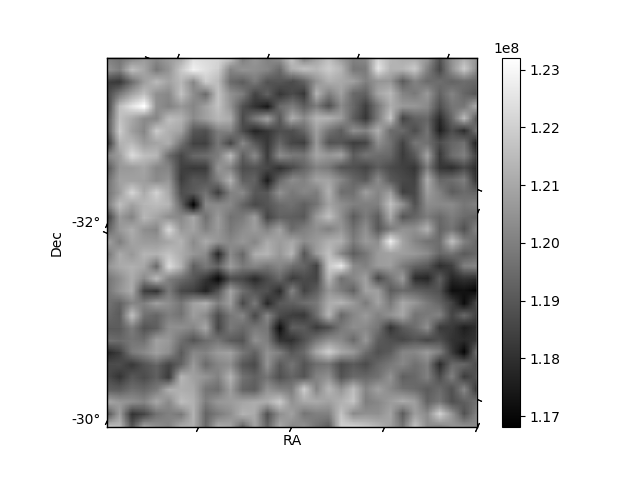
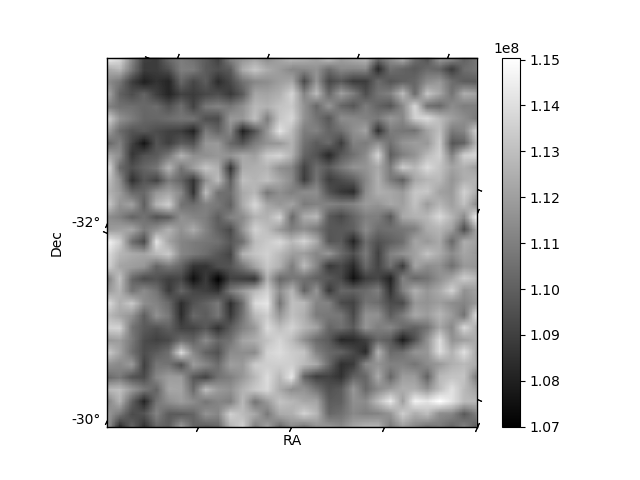
Histogram calculated using DETX and DETY for each event in the final _common_clean file
| Quadrant A | 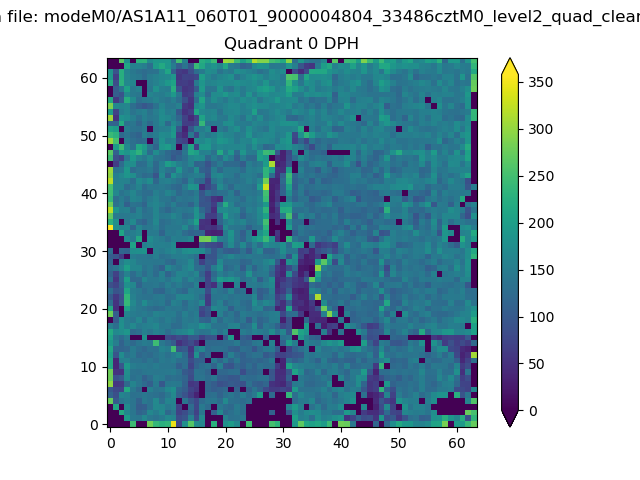 |
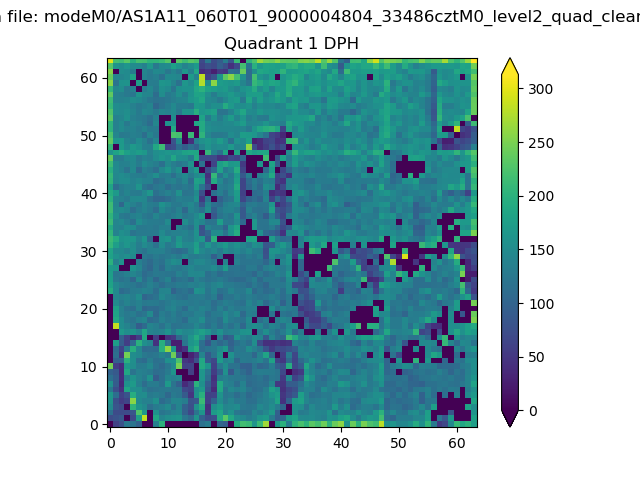 |
Quadrant B |
|---|---|---|---|
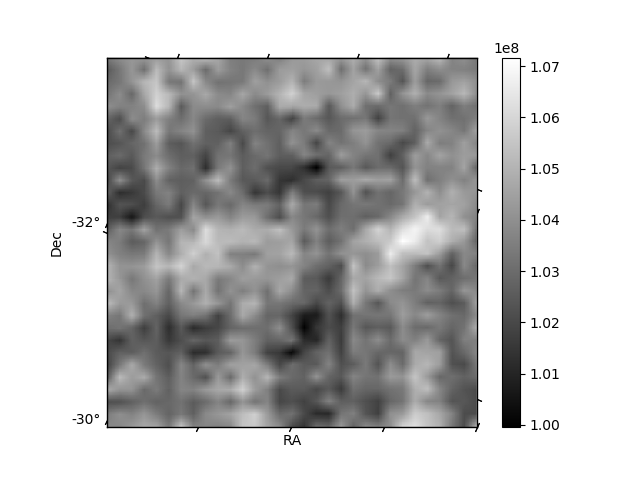
| Quadrant D | 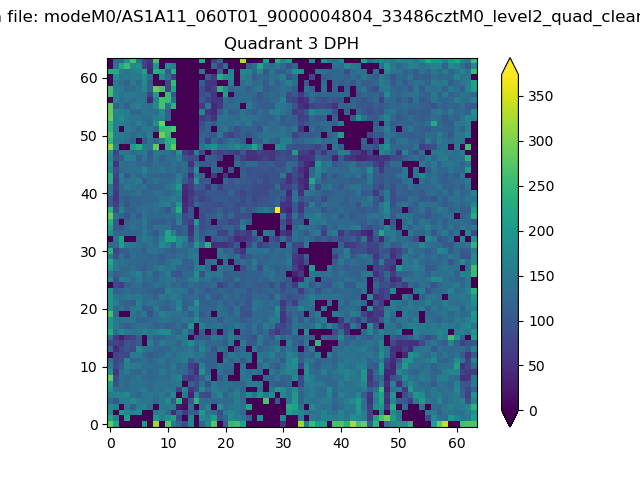 |
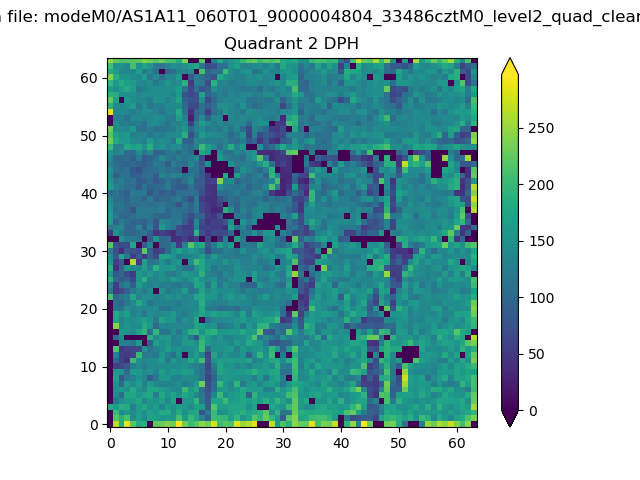 |
Quadrant C |
| Plot type | Count rate plots | Images |
|---|---|---|
| Comparison with Poisson distribution Blue bars denote a histogram of data divided into 1 sec bins. Red curve is a Poisson curve with rate = median count rate of data. |
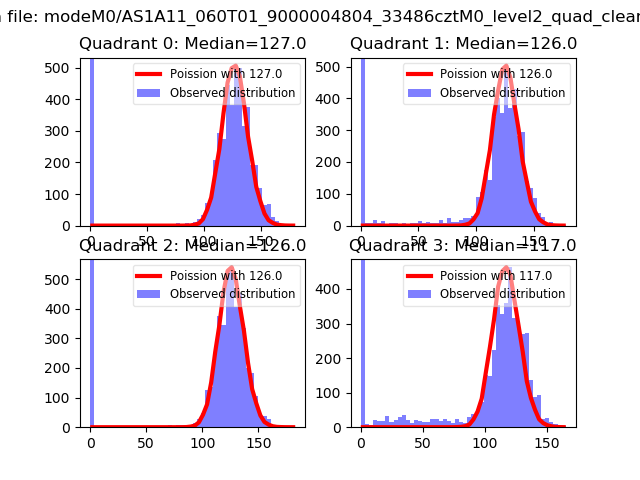 |
 |
| Quadrant-wise count rates Data is divided into 100 sec bins |
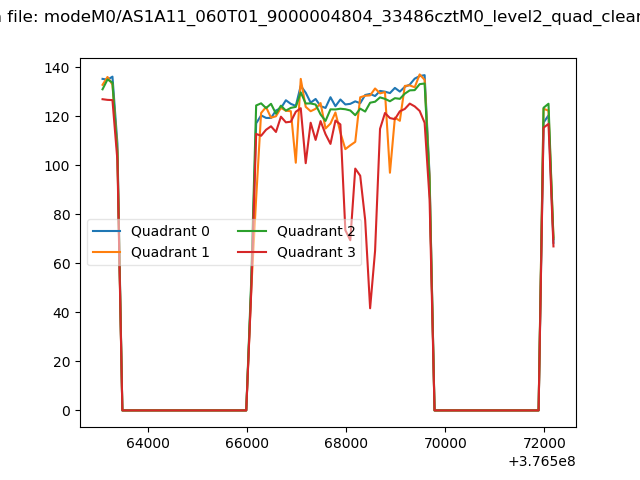 |
|
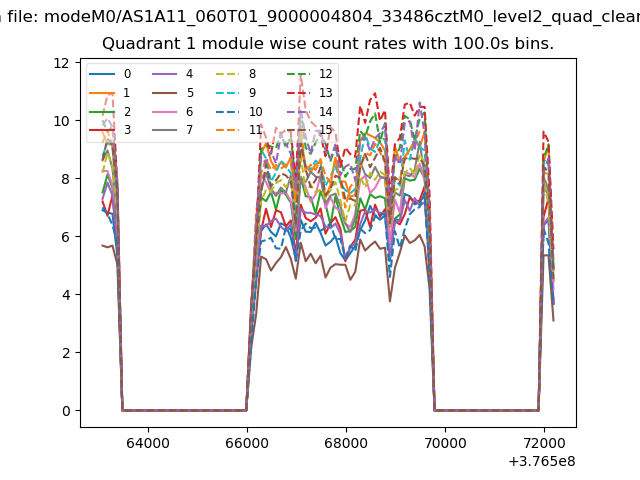
| Module-wise count rates for Quadrant A Data is divided into 100 sec bins |
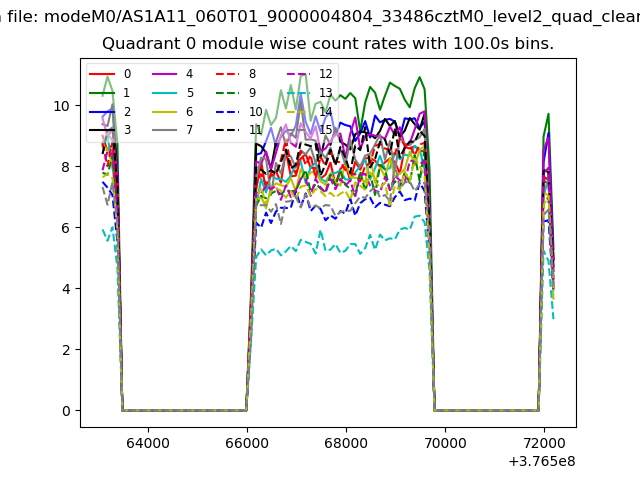 |
 |
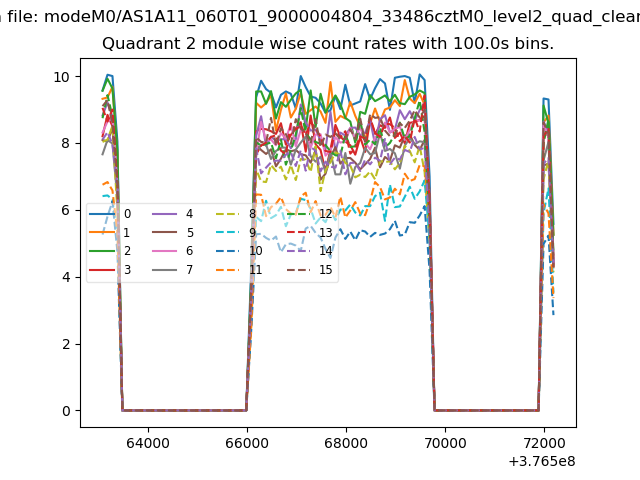
| Module-wise count rates for Quadrant B Data is divided into 100 sec bins |
 |
 |
| Module-wise count rates for Quadrant C Data is divided into 100 sec bins |
 |
 |
| Module-wise count rates for Quadrant D Data is divided into 100 sec bins |
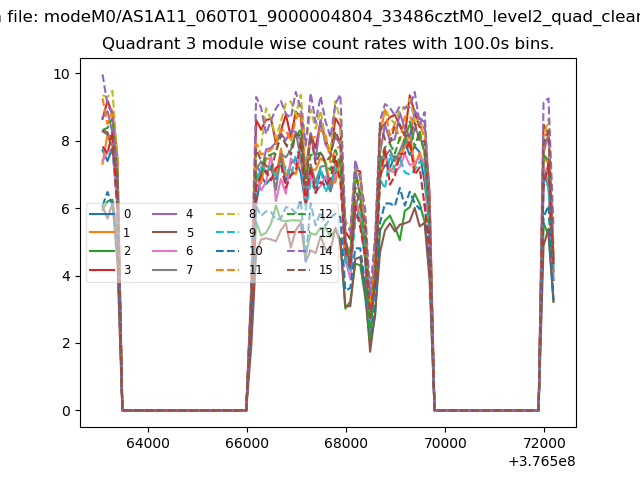 |
 |
| Parameter | Plot |
|---|---|
| CZT HV Monitor | 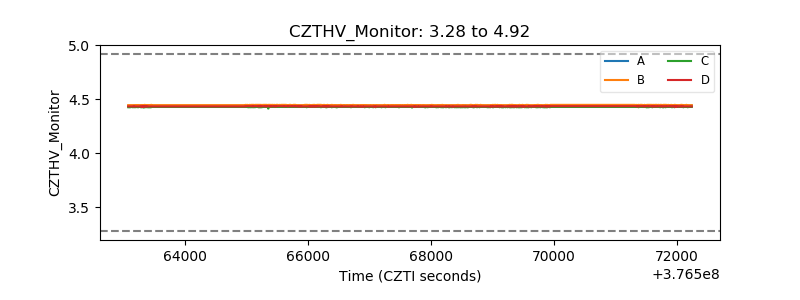 |
| D_VDD |  |
| Temperature 1 | 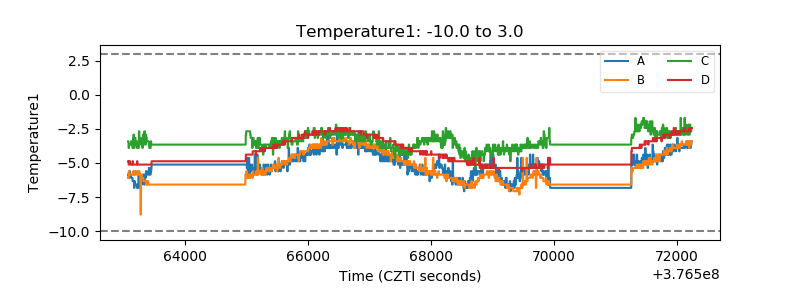 |
| Veto HV Monitor | 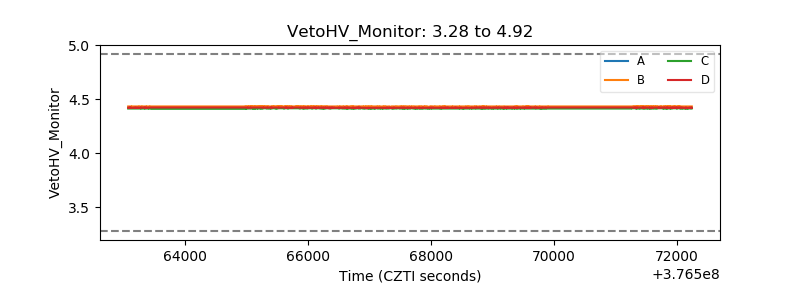 |
| Veto LLD | 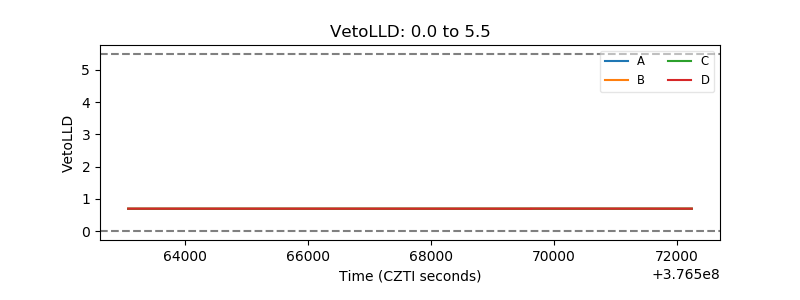 |
| Alpha Counter | 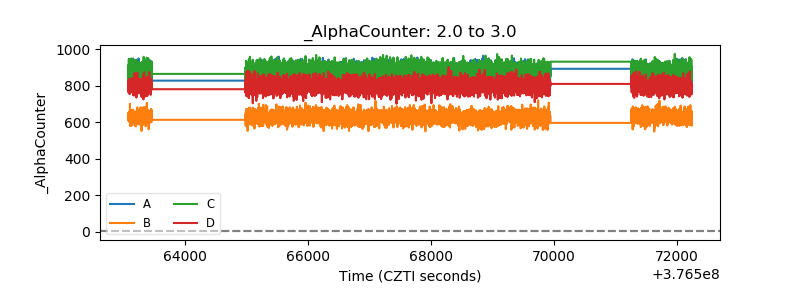 |
| _CPM_Rate | 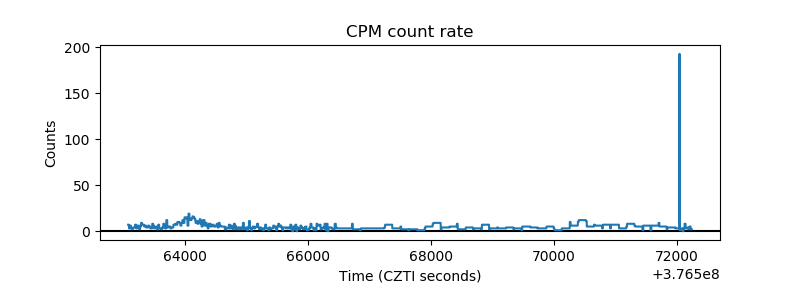 |
| CZT Counter | 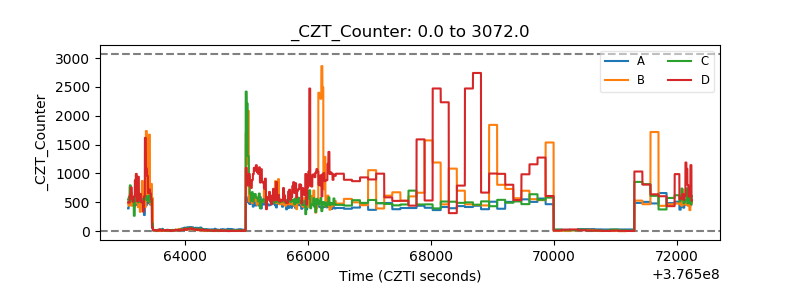 |
| +2.5 Volts monitor |  |
| +5 Volts monitor |  |
| _ROLL_ROT |  |
| _Roll_DEC |  |
| _Roll_RA | 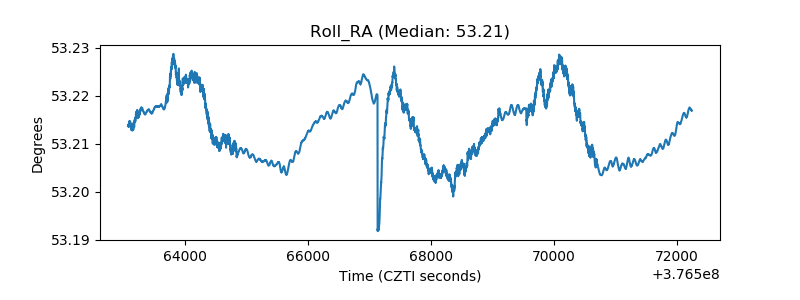 |
| Veto Counter | 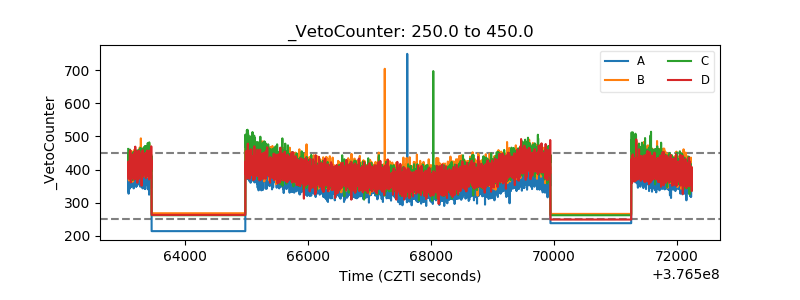 |