| Param | Original file | Final file |
|---|---|---|
| Filename | modeM0/AS1A11_060T01_9000004804_33490cztM0_level2.evt | modeM0/AS1A11_060T01_9000004804_33490cztM0_level2_quad_clean.evt |
| Size (bytes) | 472,754,880 | 75,741,120 |
| Size | 450.9 MB | 72.2 MB |
| Events in quadrant A | 2,552,533 | 496,870 |
| Events in quadrant B | 4,403,039 | 465,845 |
| Events in quadrant C | 3,137,604 | 478,144 |
| Events in quadrant D | 3,844,569 | 461,117 |
| Mode M9 | |||
|---|---|---|---|
| Quadrant | BADHDUFLAG | Total packets | Discarded packets |
| A | 0 | 17 | 0 |
| B | 0 | 17 | 0 |
| C | 0 | 17 | 0 |
| D | 0 | 18 | 0 |
| Mode M0 | |||
|---|---|---|---|
| Quadrant | BADHDUFLAG | Total packets | Discarded packets |
| A | 0 | 11307 | 3 |
| B | 0 | 16720 | 2 |
| C | 0 | 12791 | 2 |
| D | 0 | 15120 | 2 |
| Mode SS | |||
|---|---|---|---|
| Quadrant | BADHDUFLAG | Total packets | Discarded packets |
| A | 0 | 114 | 0 |
| B | 0 | 114 | 0 |
| C | 0 | 114 | 0 |
| D | 0 | 114 | 0 |
| Quadrant | Total seconds | Saturated seconds | Saturation percentage |
|---|---|---|---|
| A | 5595 | 11 | 0.196604% |
| B | 5595 | 534 | 9.544236% |
| C | 5595 | 46 | 0.822163% |
| D | 5595 | 101 | 1.805183% |
Noise dominated data is calculated using 1-second bins in cleaned event files. If a bin has >2000 counts, and if more than 50% of those come from <1% of pixels, then it is considered to be noise-dominated and hence unusable.
| Quadrant | # 1 sec bins | Bins with >0 counts | Bins with >2000 counts | High rate bins dominated by noise | Noise dominated (total time) | Noise dominated (detector-on time) | Marked lightcurve |
|---|---|---|---|---|---|---|---|
| A | 7177 | 5596 | 0 | 0 | 0.00% | 0.00% | 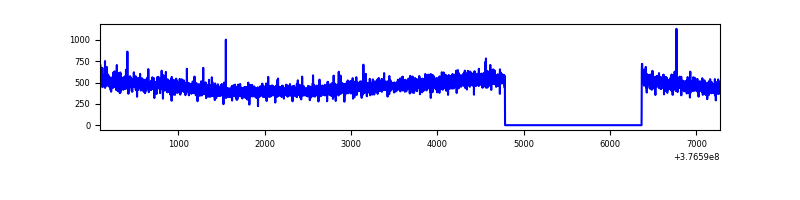 |
| B | 7177 | 5596 | 448 | 448 | 6.24% | 8.01% | 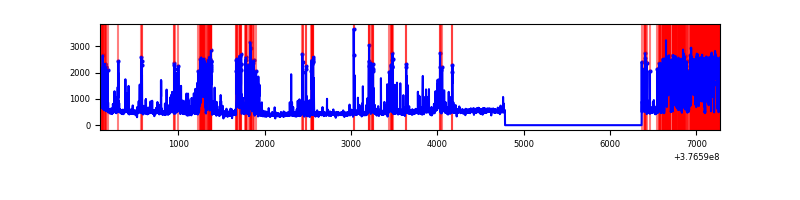 |
| C | 7177 | 5596 | 36 | 36 | 0.50% | 0.64% | 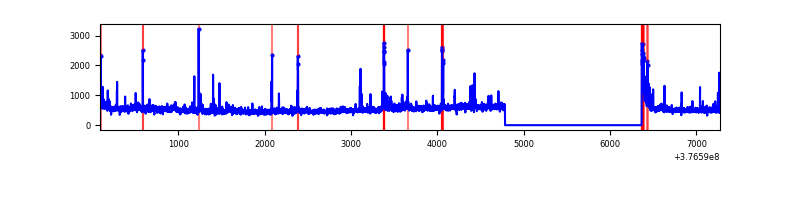 |
| D | 7177 | 5596 | 101 | 101 | 1.41% | 1.80% | 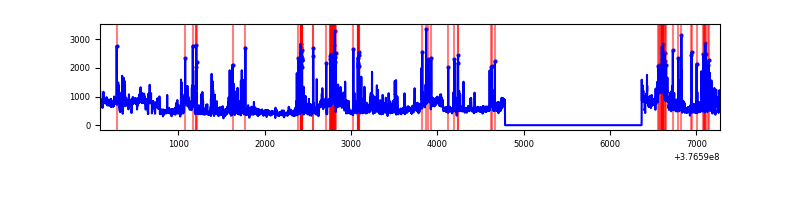 |
Top three noisy pixels from each quadrant. If the there are fewer than three noisy pixels in the level2.evt file, extra rows are filled as -1
| Pixel properties | Quadrant properties | ||||||
|---|---|---|---|---|---|---|---|
| Quadrant | DetID | PixID | Counts | Sigma | Mean | Median | Sigma |
| A | 13 | 6 | 11905 | 84.68 | 657 | 643 | 133.0 |
| A | 13 | 254 | 8860 | 61.79 | 657 | 643 | 133.0 |
| A | 3 | 137 | 6797 | 46.27 | 657 | 643 | 133.0 |
| B | 5 | 255 | 1458758 | 11764.29 | 631 | 616 | 123.9 |
| B | 5 | 172 | 341522 | 2750.43 | 631 | 616 | 123.9 |
| B | 4 | 171 | 47698 | 379.86 | 631 | 616 | 123.9 |
| C | 15 | 214 | 242400 | 1653.27 | 630 | 636 | 146.2 |
| C | 0 | 10 | 119830 | 815.09 | 630 | 636 | 146.2 |
| C | 3 | 233 | 114104 | 775.93 | 630 | 636 | 146.2 |
| D | 8 | 195 | 750798 | 4798.95 | 628 | 608 | 156.3 |
| D | 13 | 249 | 282855 | 1805.53 | 628 | 608 | 156.3 |
| D | 2 | 250 | 134453 | 856.2 | 628 | 608 | 156.3 |
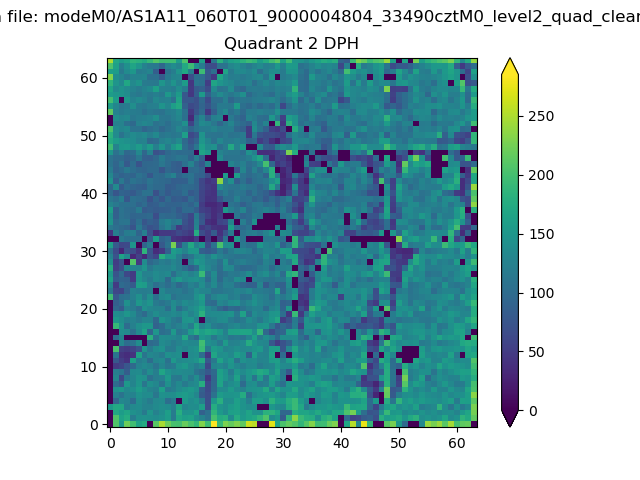
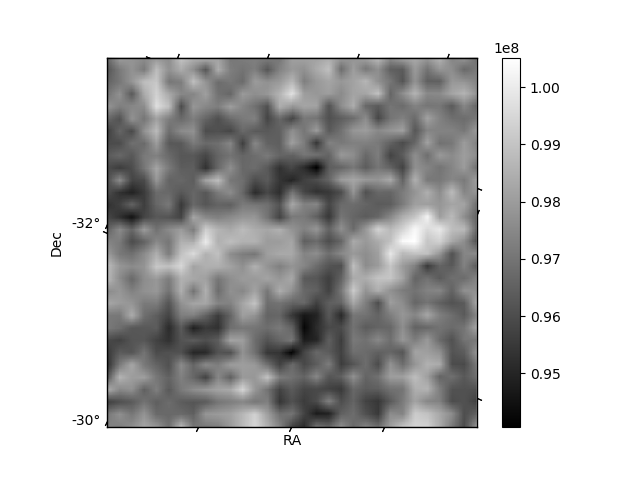
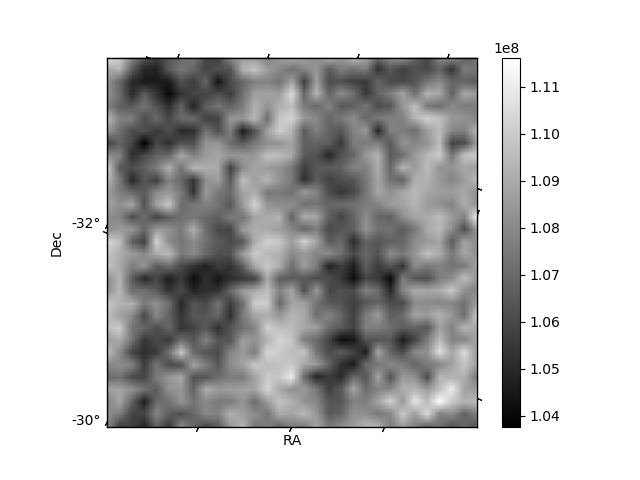
Histogram calculated using DETX and DETY for each event in the final _common_clean file
| Quadrant A | 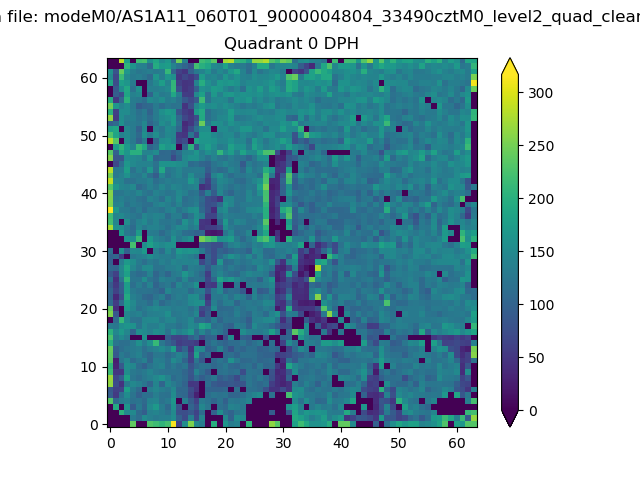 |
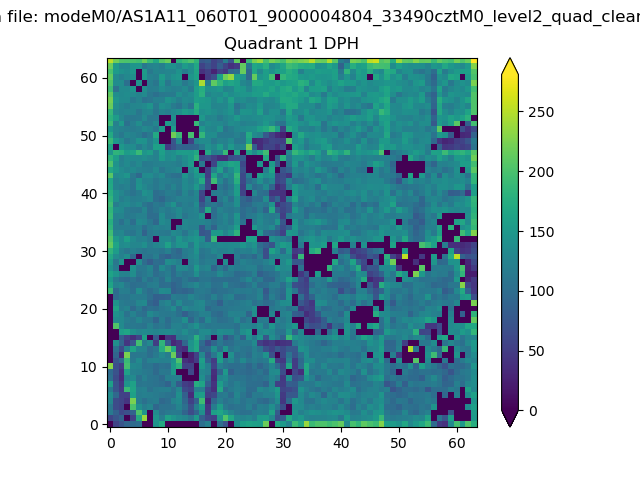 |
Quadrant B |
|---|---|---|---|
| Quadrant D | 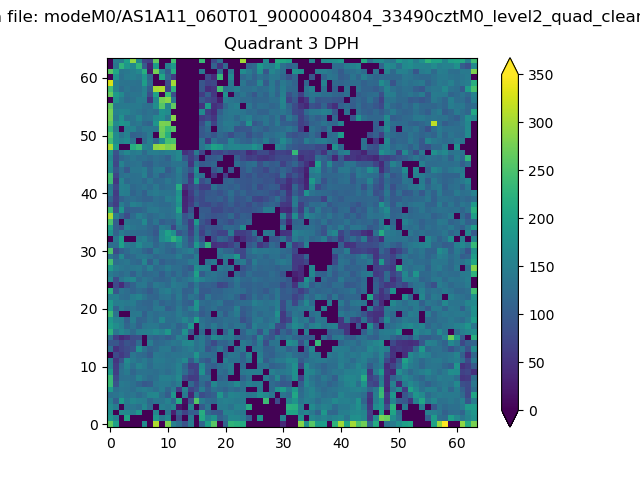 |
 |
Quadrant C |
| Plot type | Count rate plots | Images |
|---|---|---|
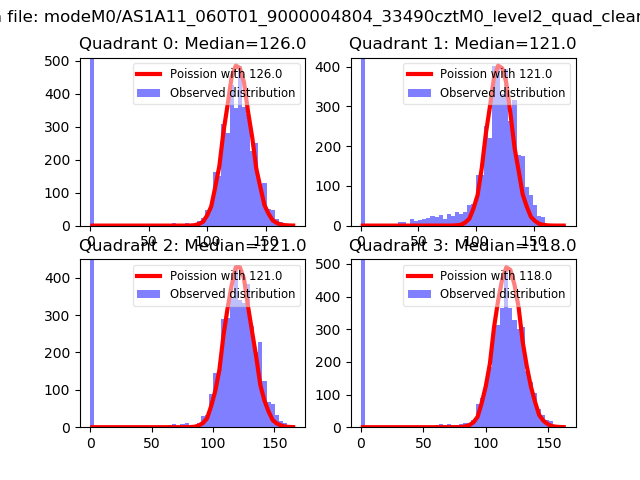
| Comparison with Poisson distribution Blue bars denote a histogram of data divided into 1 sec bins. Red curve is a Poisson curve with rate = median count rate of data. |
 |
 |
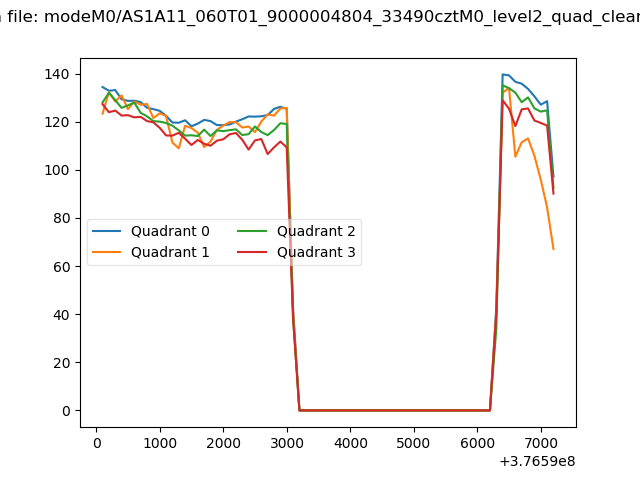
| Quadrant-wise count rates Data is divided into 100 sec bins |
 |
|
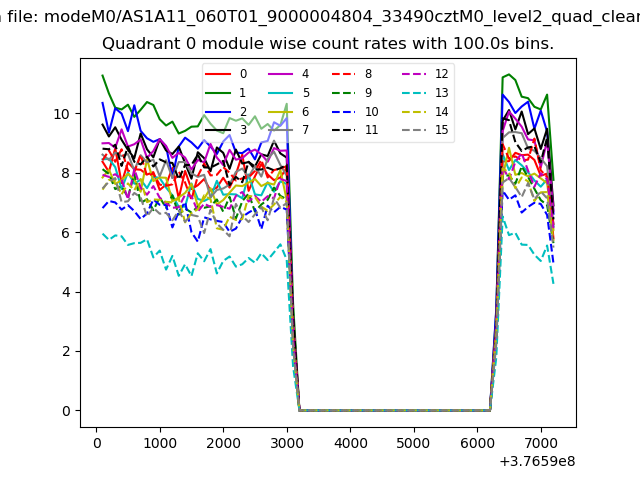
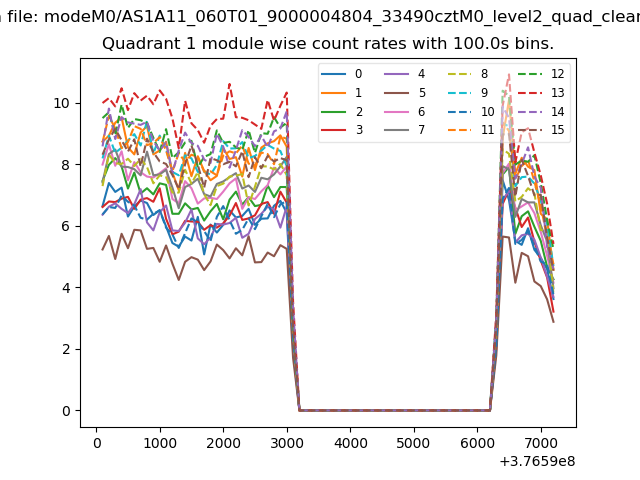
| Module-wise count rates for Quadrant A Data is divided into 100 sec bins |
 |
 |
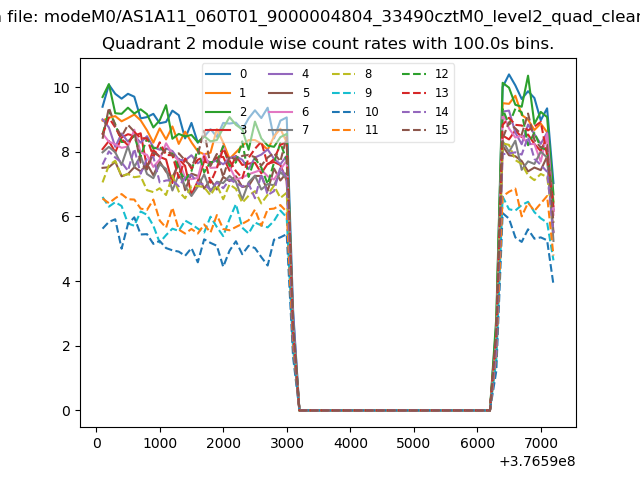
| Module-wise count rates for Quadrant B Data is divided into 100 sec bins |
 |
 |
| Module-wise count rates for Quadrant C Data is divided into 100 sec bins |
 |
 |
| Module-wise count rates for Quadrant D Data is divided into 100 sec bins |
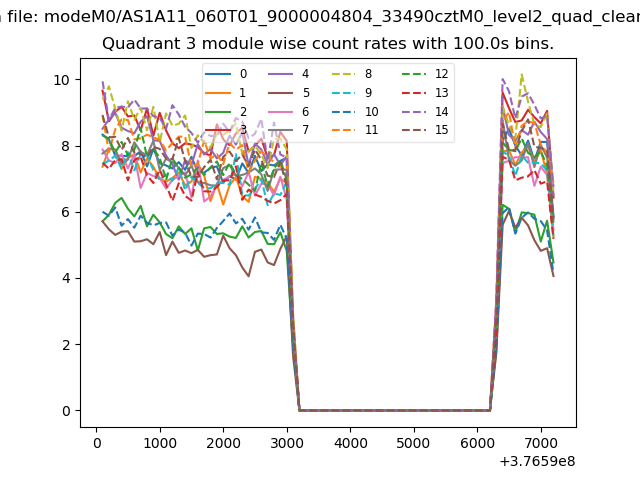 |
 |
| Parameter | Plot |
|---|---|
| CZT HV Monitor | 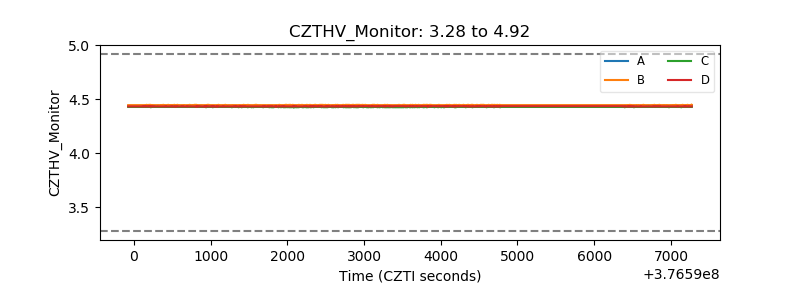 |
| D_VDD | 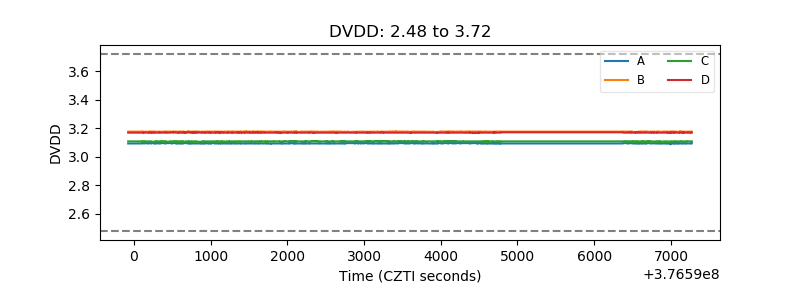 |
| Temperature 1 |  |
| Veto HV Monitor | 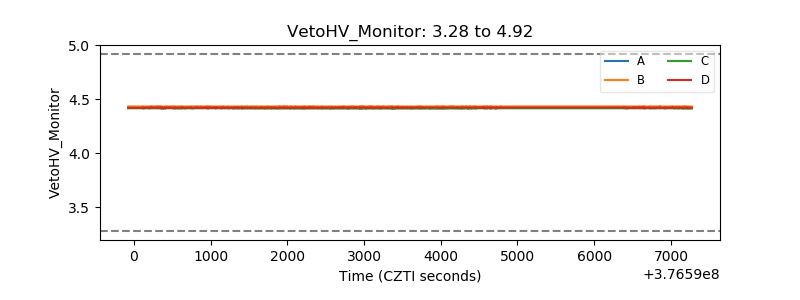 |
| Veto LLD | 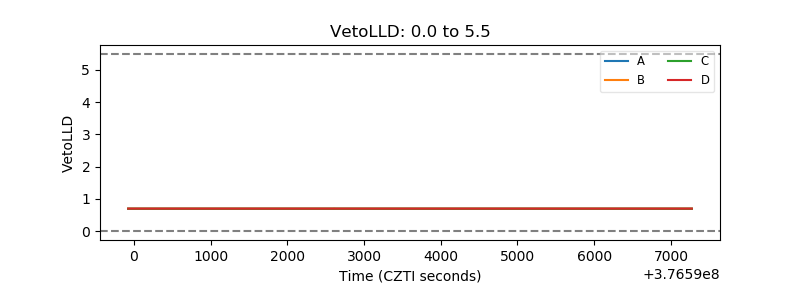 |
| Alpha Counter | 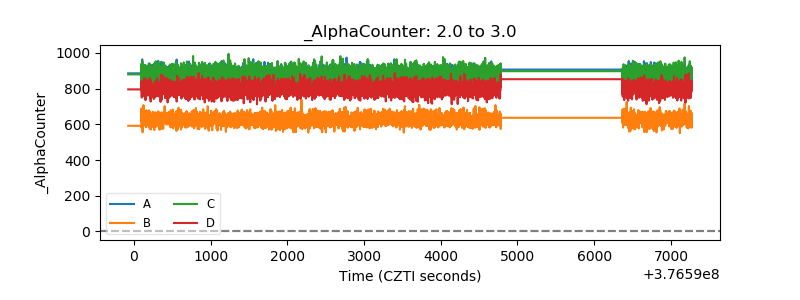 |
| _CPM_Rate | 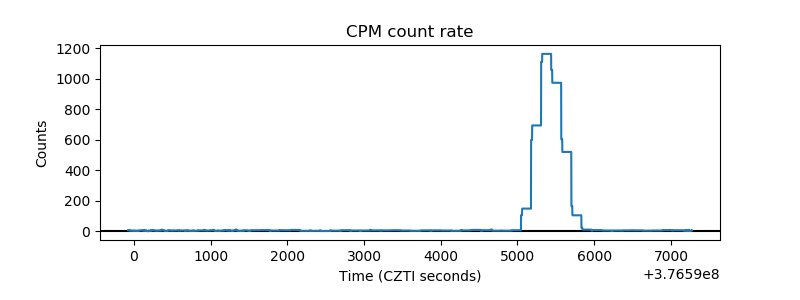 |
| CZT Counter | 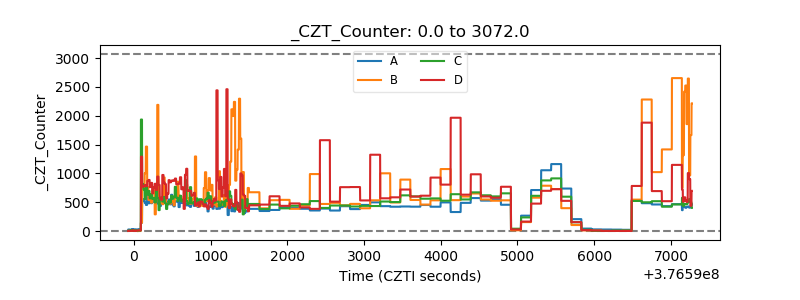 |
| +2.5 Volts monitor |  |
| +5 Volts monitor |  |
| _ROLL_ROT | 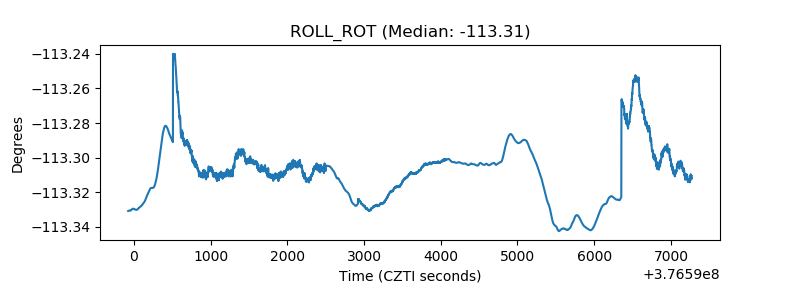 |
| _Roll_DEC |  |
| _Roll_RA | 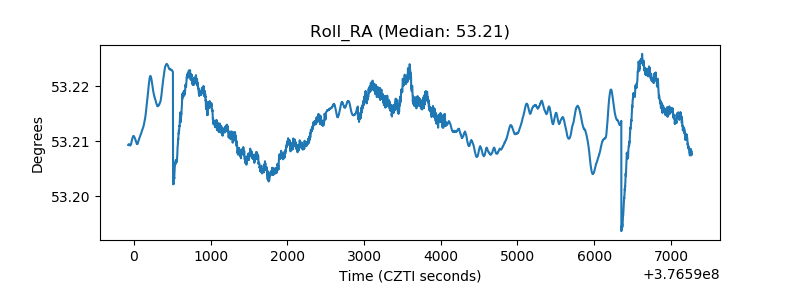 |
| Veto Counter | 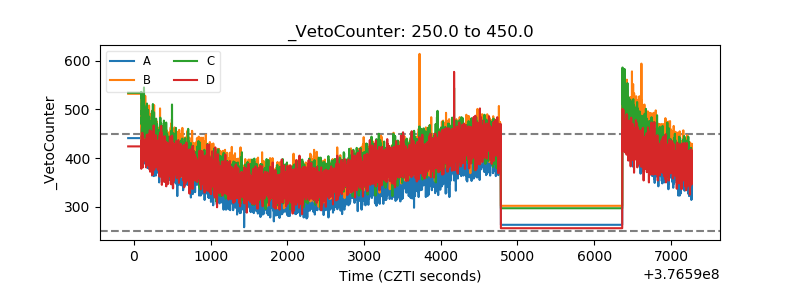 |