| Param | Original file | Final file |
|---|---|---|
| Filename | modeM0/AS1A11_060T01_9000004804_33491cztM0_level2.evt | modeM0/AS1A11_060T01_9000004804_33491cztM0_level2_quad_clean.evt |
| Size (bytes) | 499,178,880 | 71,735,040 |
| Size | 476.1 MB | 68.4 MB |
| Events in quadrant A | 2,541,231 | 471,244 |
| Events in quadrant B | 4,904,369 | 423,958 |
| Events in quadrant C | 3,144,398 | 453,140 |
| Events in quadrant D | 4,149,755 | 433,645 |
| Mode M9 | |||
|---|---|---|---|
| Quadrant | BADHDUFLAG | Total packets | Discarded packets |
| A | 0 | 23 | 0 |
| B | 0 | 23 | 0 |
| C | 0 | 23 | 0 |
| D | 0 | 24 | 0 |
| Mode M0 | |||
|---|---|---|---|
| Quadrant | BADHDUFLAG | Total packets | Discarded packets |
| A | 0 | 11234 | 3 |
| B | 0 | 18159 | 2 |
| C | 0 | 12882 | 2 |
| D | 0 | 16082 | 2 |
| Mode SS | |||
|---|---|---|---|
| Quadrant | BADHDUFLAG | Total packets | Discarded packets |
| A | 0 | 114 | 0 |
| B | 0 | 114 | 0 |
| C | 0 | 114 | 0 |
| D | 0 | 114 | 0 |
| Quadrant | Total seconds | Saturated seconds | Saturation percentage |
|---|---|---|---|
| A | 5570 | 6 | 0.107720% |
| B | 5570 | 824 | 14.793537% |
| C | 5570 | 29 | 0.520646% |
| D | 5570 | 114 | 2.046679% |
Noise dominated data is calculated using 1-second bins in cleaned event files. If a bin has >2000 counts, and if more than 50% of those come from <1% of pixels, then it is considered to be noise-dominated and hence unusable.
| Quadrant | # 1 sec bins | Bins with >0 counts | Bins with >2000 counts | High rate bins dominated by noise | Noise dominated (total time) | Noise dominated (detector-on time) | Marked lightcurve |
|---|---|---|---|---|---|---|---|
| A | 7243 | 5571 | 0 | 0 | 0.00% | 0.00% | 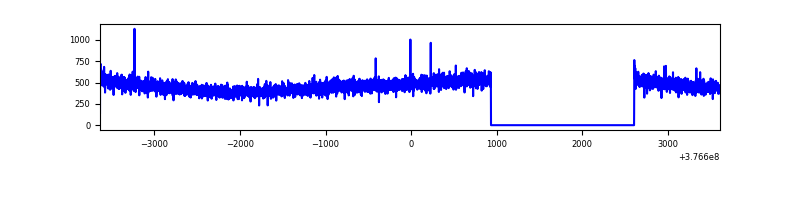 |
| B | 7243 | 5571 | 727 | 727 | 10.04% | 13.05% | 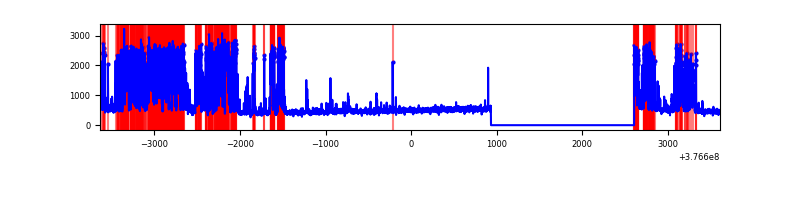 |
| C | 7243 | 5571 | 27 | 27 | 0.37% | 0.48% | 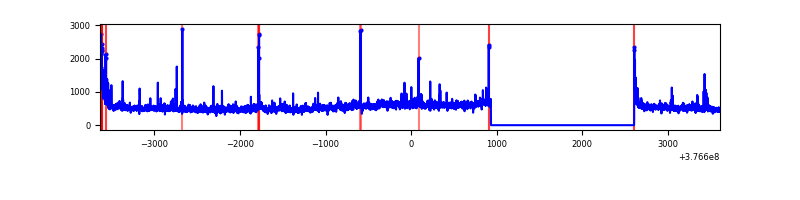 |
| D | 7243 | 5571 | 112 | 112 | 1.55% | 2.01% | 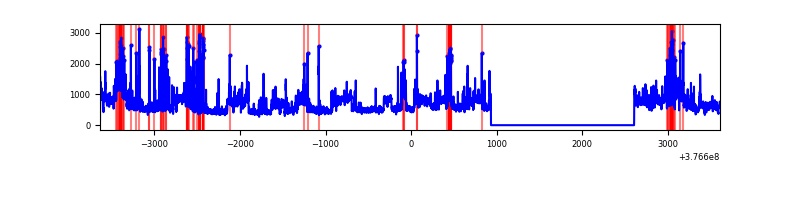 |
Top three noisy pixels from each quadrant. If the there are fewer than three noisy pixels in the level2.evt file, extra rows are filled as -1
| Pixel properties | Quadrant properties | ||||||
|---|---|---|---|---|---|---|---|
| Quadrant | DetID | PixID | Counts | Sigma | Mean | Median | Sigma |
| A | 13 | 6 | 9927 | 69.69 | 654 | 641 | 133.2 |
| A | 13 | 254 | 9344 | 65.32 | 654 | 641 | 133.2 |
| A | 3 | 137 | 6699 | 45.47 | 654 | 641 | 133.2 |
| B | 5 | 255 | 1958573 | 16159.12 | 621 | 605 | 121.2 |
| B | 5 | 172 | 453410 | 3737.0 | 621 | 605 | 121.2 |
| B | 12 | 111 | 14784 | 117.02 | 621 | 605 | 121.2 |
| C | 15 | 214 | 239824 | 1622.57 | 635 | 641 | 147.4 |
| C | 14 | 67 | 181129 | 1224.4 | 635 | 641 | 147.4 |
| C | 0 | 10 | 112069 | 755.91 | 635 | 641 | 147.4 |
| D | 8 | 195 | 938636 | 6125.89 | 626 | 608 | 153.1 |
| D | 2 | 250 | 213781 | 1392.14 | 626 | 608 | 153.1 |
| D | 13 | 249 | 189814 | 1235.63 | 626 | 608 | 153.1 |
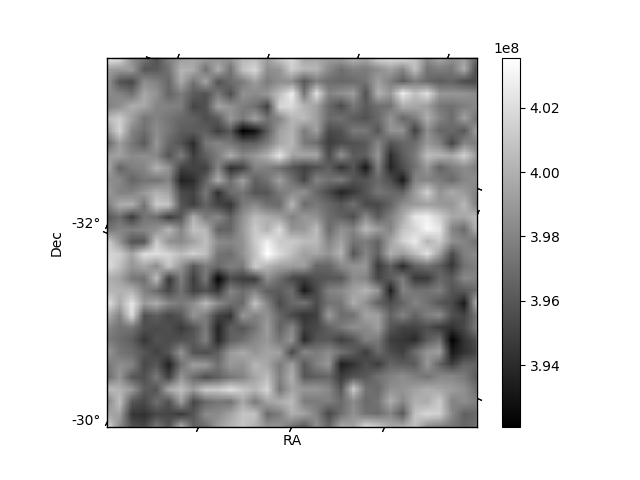
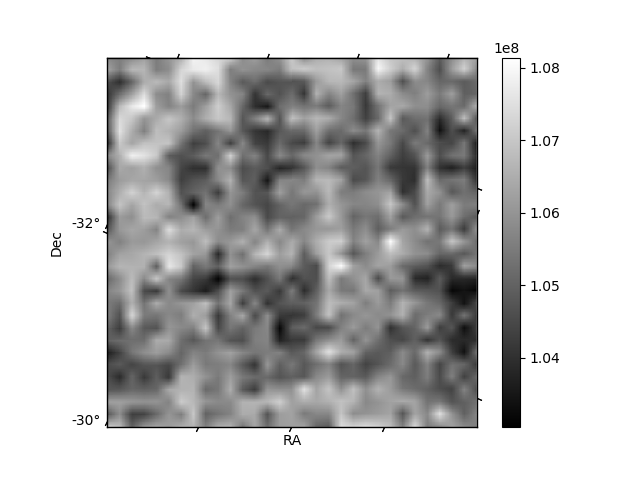
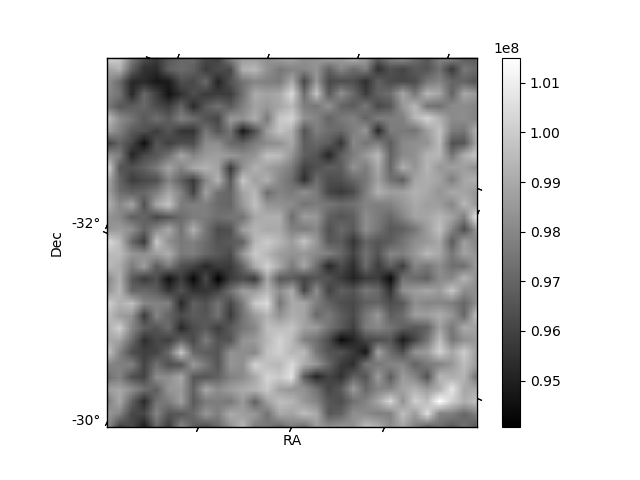
Histogram calculated using DETX and DETY for each event in the final _common_clean file
| Quadrant A | 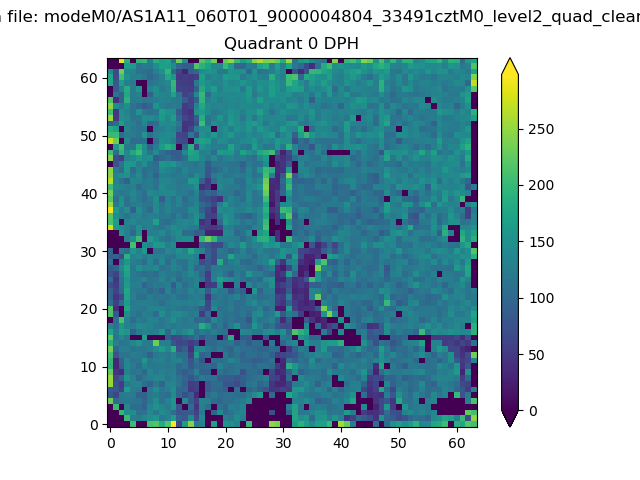 |
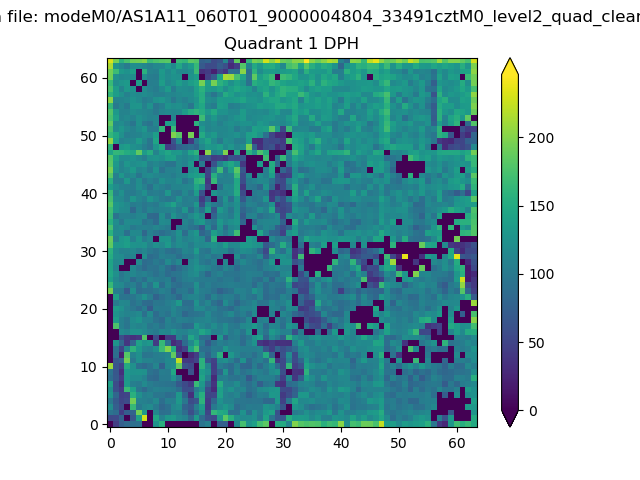 |
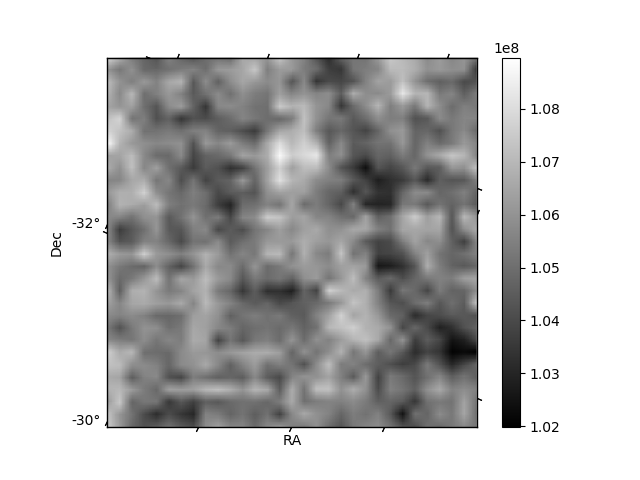
Quadrant B |
|---|---|---|---|
| Quadrant D | 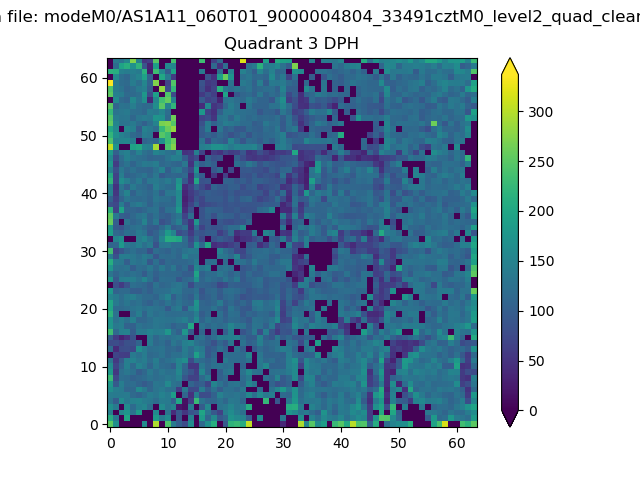 |
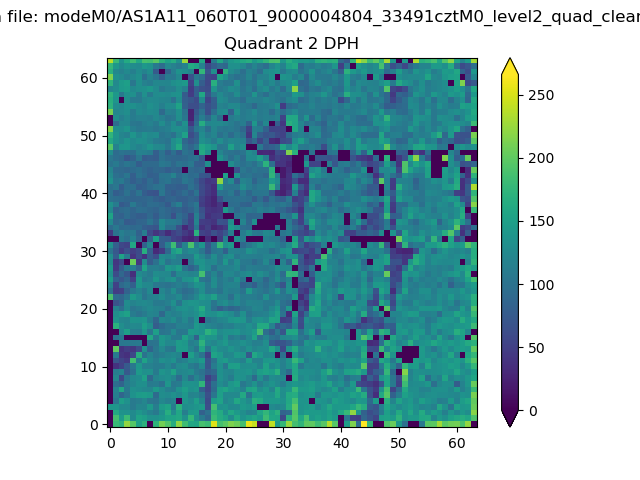 |
Quadrant C |
| Plot type | Count rate plots | Images |
|---|---|---|
| Comparison with Poisson distribution Blue bars denote a histogram of data divided into 1 sec bins. Red curve is a Poisson curve with rate = median count rate of data. |
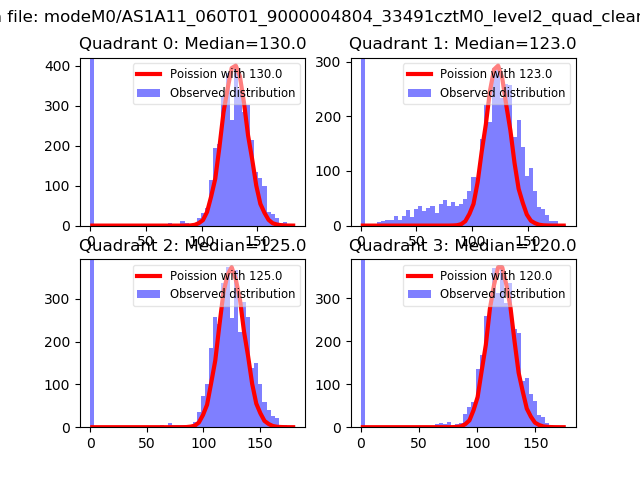 |
 |
| Quadrant-wise count rates Data is divided into 100 sec bins |
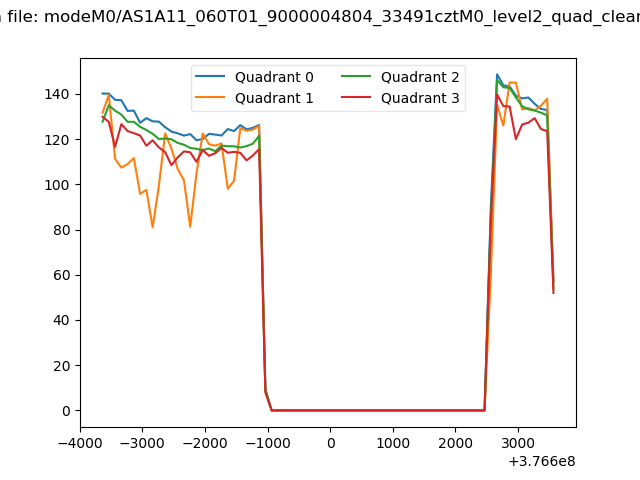 |
|
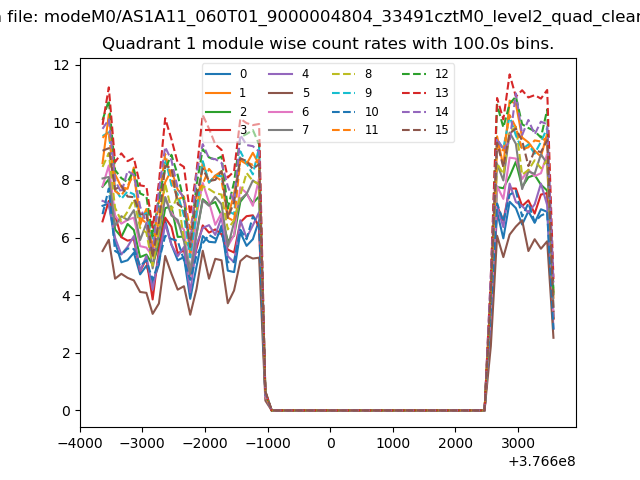
| Module-wise count rates for Quadrant A Data is divided into 100 sec bins |
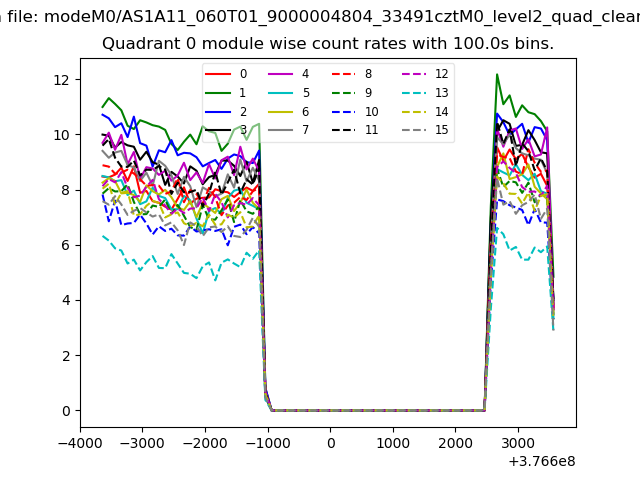 |
 |
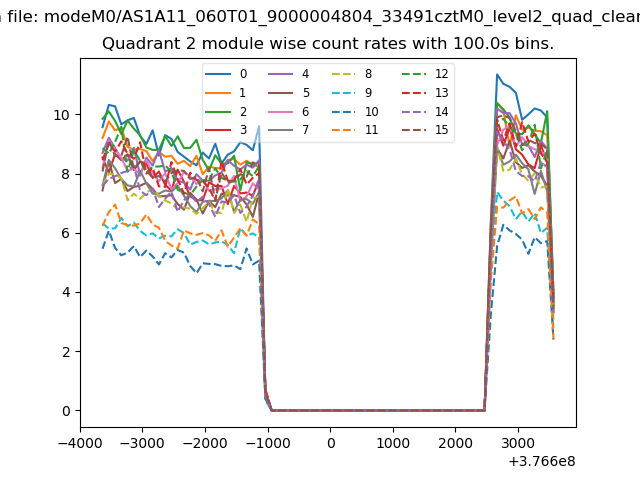
| Module-wise count rates for Quadrant B Data is divided into 100 sec bins |
 |
 |
| Module-wise count rates for Quadrant C Data is divided into 100 sec bins |
 |
 |
| Module-wise count rates for Quadrant D Data is divided into 100 sec bins |
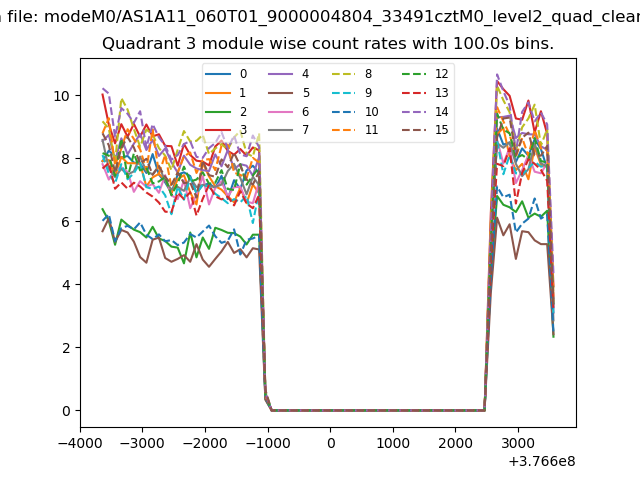 |
 |
| Parameter | Plot |
|---|---|
| CZT HV Monitor | 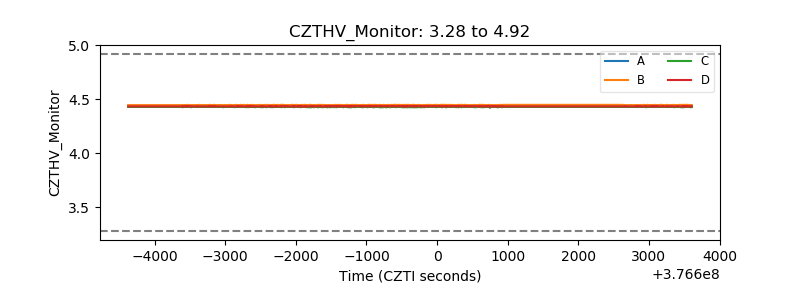 |
| D_VDD | 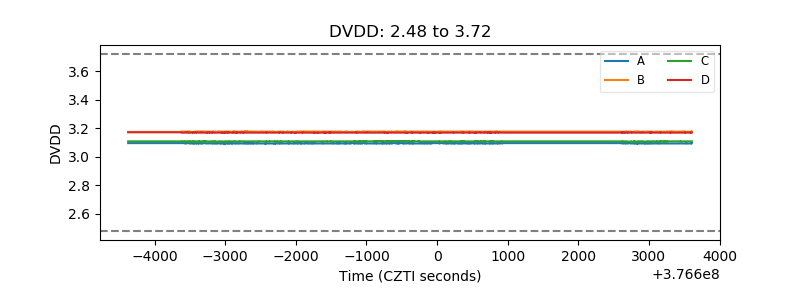 |
| Temperature 1 | 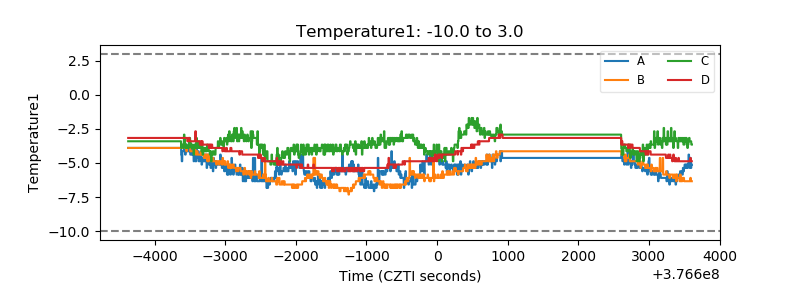 |
| Veto HV Monitor | 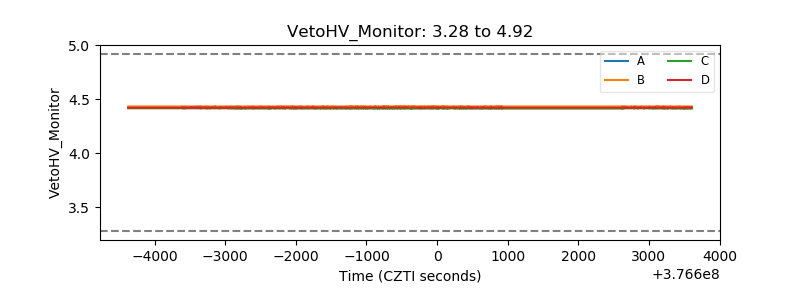 |
| Veto LLD | 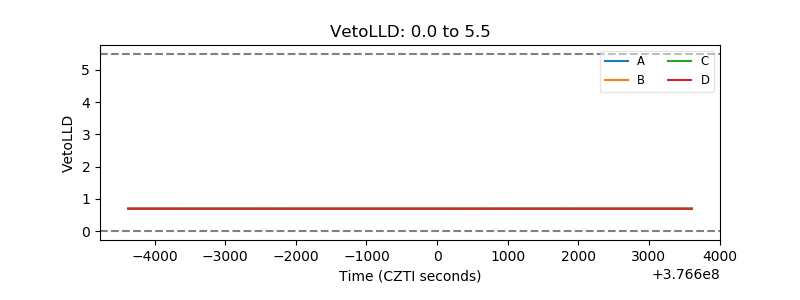 |
| Alpha Counter | 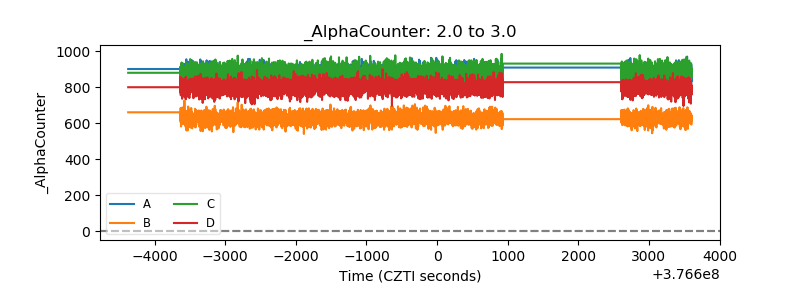 |
| _CPM_Rate | 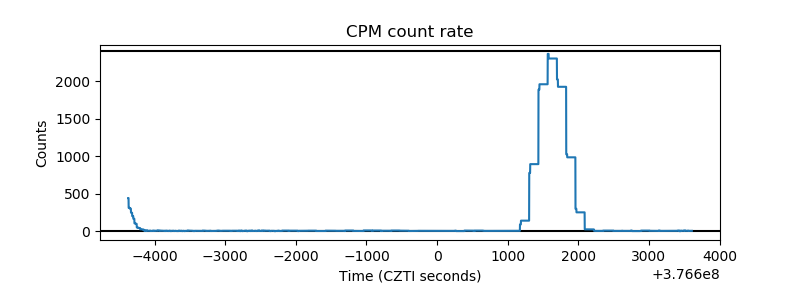 |
| CZT Counter | 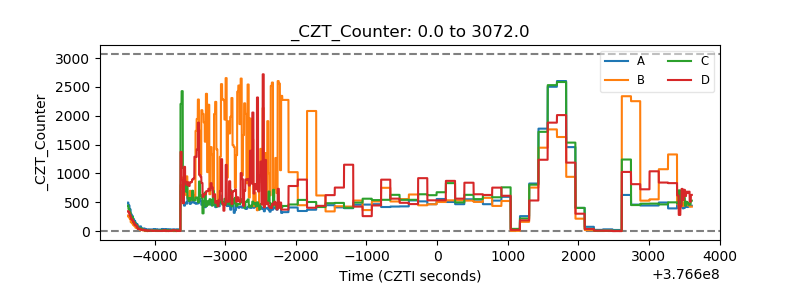 |
| +2.5 Volts monitor |  |
| +5 Volts monitor |  |
| _ROLL_ROT |  |
| _Roll_DEC | 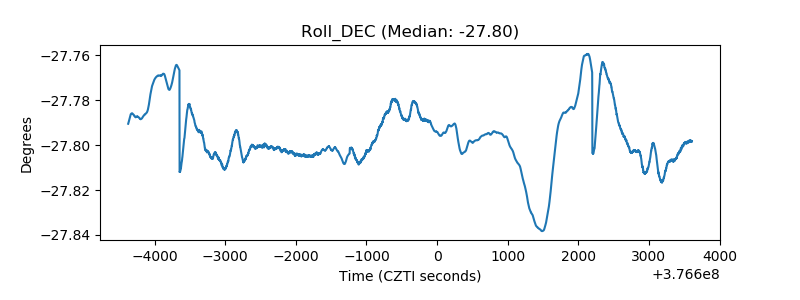 |
| _Roll_RA | 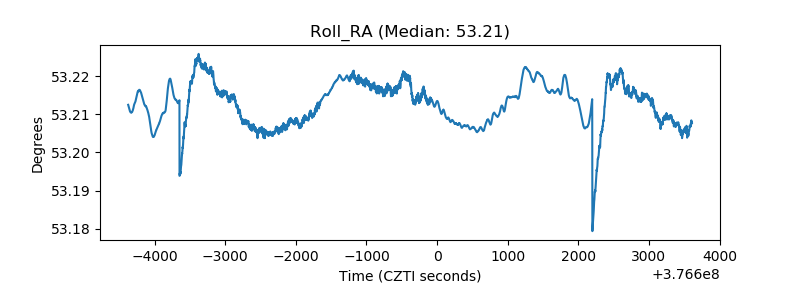 |
| Veto Counter |  |