| Param | Original file | Final file |
|---|---|---|
| Filename | modeM0/AS1A11_060T01_9000004804_33493cztM0_level2.evt | modeM0/AS1A11_060T01_9000004804_33493cztM0_level2_quad_clean.evt |
| Size (bytes) | 468,734,400 | 65,672,640 |
| Size | 447.0 MB | 62.6 MB |
| Events in quadrant A | 2,466,497 | 424,732 |
| Events in quadrant B | 4,102,967 | 402,372 |
| Events in quadrant C | 3,237,513 | 408,067 |
| Events in quadrant D | 4,029,236 | 382,152 |
| Mode M9 | |||
|---|---|---|---|
| Quadrant | BADHDUFLAG | Total packets | Discarded packets |
| A | 0 | 31 | 0 |
| B | 0 | 31 | 0 |
| C | 0 | 31 | 0 |
| D | 0 | 32 | 0 |
| Mode M0 | |||
|---|---|---|---|
| Quadrant | BADHDUFLAG | Total packets | Discarded packets |
| A | 0 | 10695 | 3 |
| B | 0 | 15602 | 2 |
| C | 0 | 13035 | 2 |
| D | 0 | 15590 | 2 |
| Mode SS | |||
|---|---|---|---|
| Quadrant | BADHDUFLAG | Total packets | Discarded packets |
| A | 0 | 108 | 0 |
| B | 0 | 108 | 0 |
| C | 0 | 108 | 0 |
| D | 0 | 108 | 0 |
| Quadrant | Total seconds | Saturated seconds | Saturation percentage |
|---|---|---|---|
| A | 5296 | 11 | 0.207704% |
| B | 5296 | 513 | 9.686556% |
| C | 5296 | 78 | 1.472810% |
| D | 5296 | 194 | 3.663142% |
Noise dominated data is calculated using 1-second bins in cleaned event files. If a bin has >2000 counts, and if more than 50% of those come from <1% of pixels, then it is considered to be noise-dominated and hence unusable.
| Quadrant | # 1 sec bins | Bins with >0 counts | Bins with >2000 counts | High rate bins dominated by noise | Noise dominated (total time) | Noise dominated (detector-on time) | Marked lightcurve |
|---|---|---|---|---|---|---|---|
| A | 7119 | 5297 | 0 | 0 | 0.00% | 0.00% | 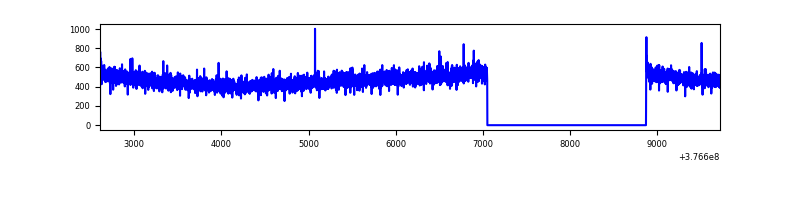 |
| B | 7119 | 5296 | 405 | 405 | 5.69% | 7.65% | 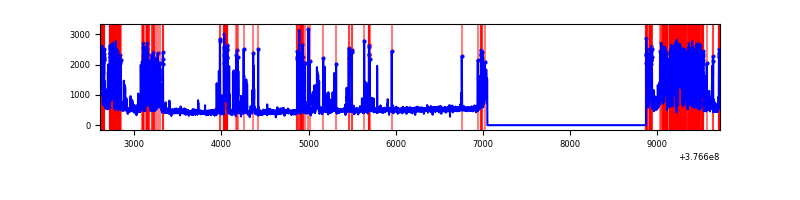 |
| C | 7119 | 5297 | 71 | 71 | 1.00% | 1.34% | 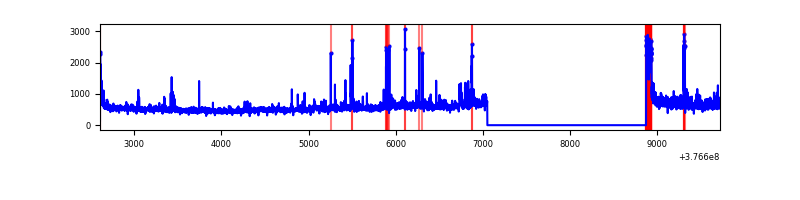 |
| D | 7119 | 5297 | 176 | 176 | 2.47% | 3.32% | 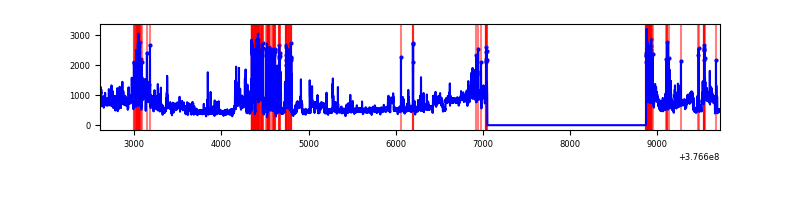 |
Top three noisy pixels from each quadrant. If the there are fewer than three noisy pixels in the level2.evt file, extra rows are filled as -1
| Pixel properties | Quadrant properties | ||||||
|---|---|---|---|---|---|---|---|
| Quadrant | DetID | PixID | Counts | Sigma | Mean | Median | Sigma |
| A | 13 | 254 | 9031 | 65.54 | 636 | 625 | 128.3 |
| A | 3 | 137 | 6216 | 43.59 | 636 | 625 | 128.3 |
| A | 10 | 83 | 5527 | 38.22 | 636 | 625 | 128.3 |
| B | 5 | 255 | 1112635 | 9366.47 | 617 | 602 | 118.7 |
| B | 5 | 172 | 531466 | 4471.38 | 617 | 602 | 118.7 |
| B | 12 | 111 | 14527 | 117.29 | 617 | 602 | 118.7 |
| C | 15 | 214 | 226442 | 1566.42 | 620 | 626 | 144.2 |
| C | 3 | 233 | 160312 | 1107.7 | 620 | 626 | 144.2 |
| C | 7 | 221 | 139179 | 961.1 | 620 | 626 | 144.2 |
| D | 8 | 195 | 828162 | 5597.71 | 609 | 593 | 147.8 |
| D | 13 | 249 | 408334 | 2757.98 | 609 | 593 | 147.8 |
| D | 2 | 250 | 120793 | 813.04 | 609 | 593 | 147.8 |
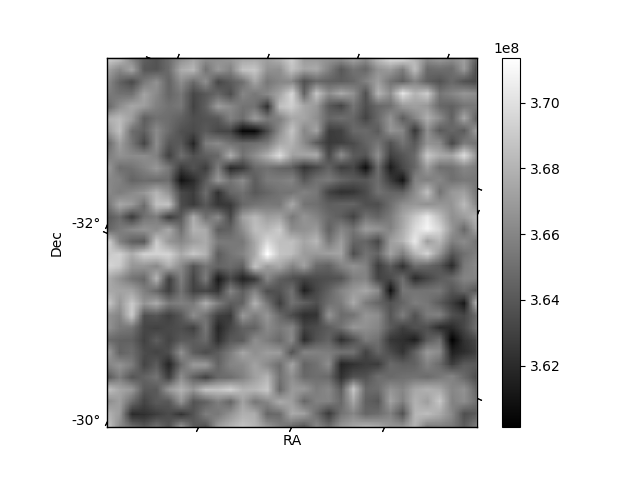
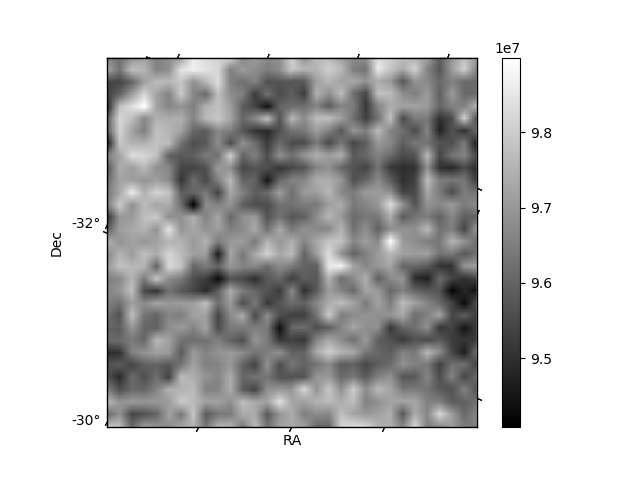
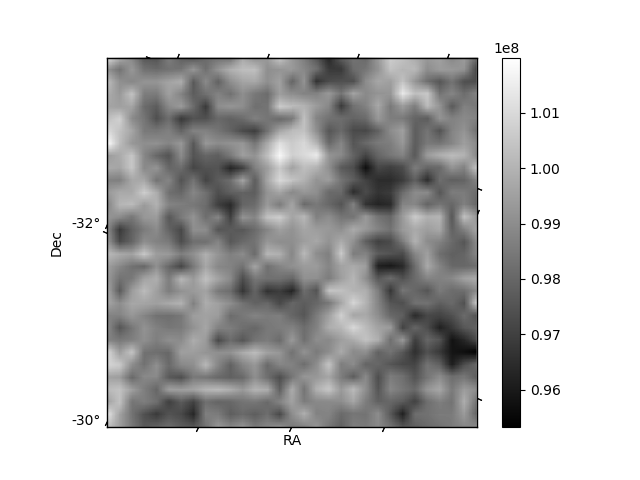
Histogram calculated using DETX and DETY for each event in the final _common_clean file
| Quadrant A | 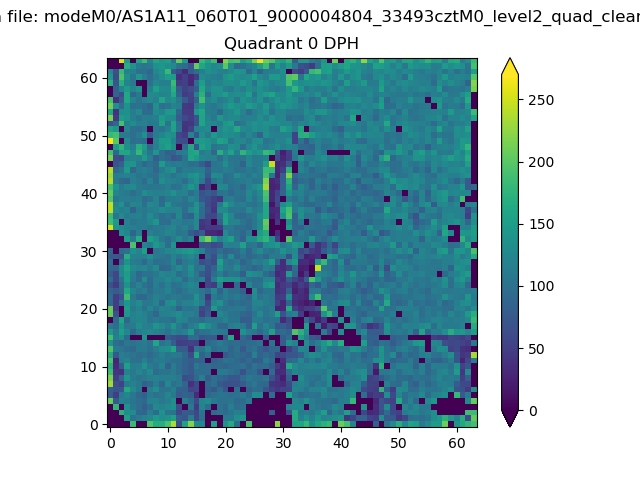 |
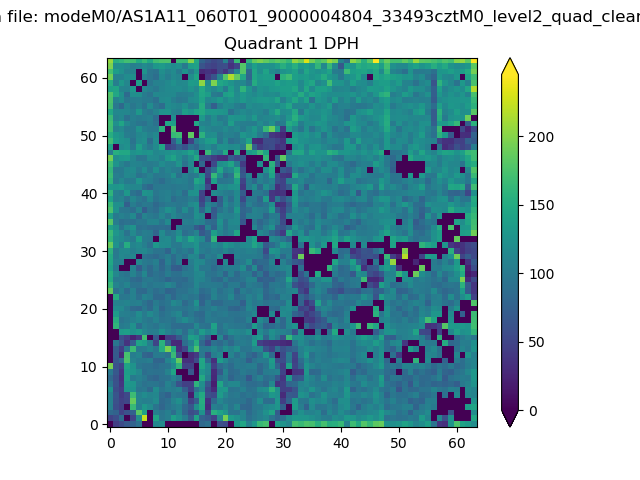 |
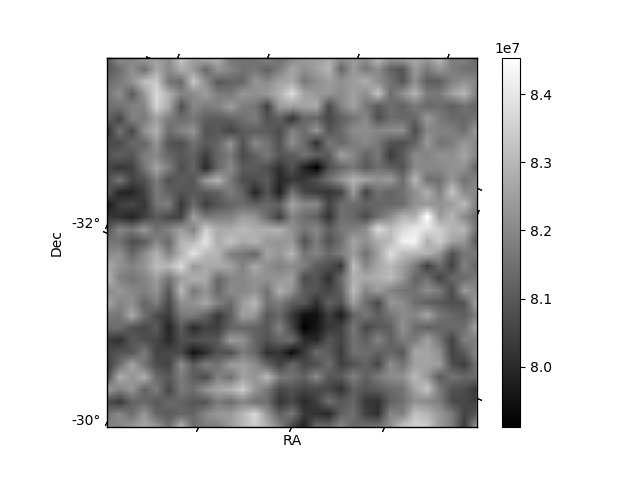
Quadrant B |
|---|---|---|---|
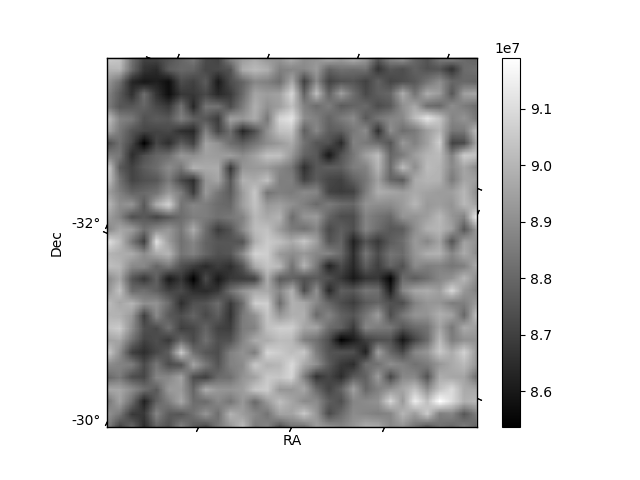
| Quadrant D | 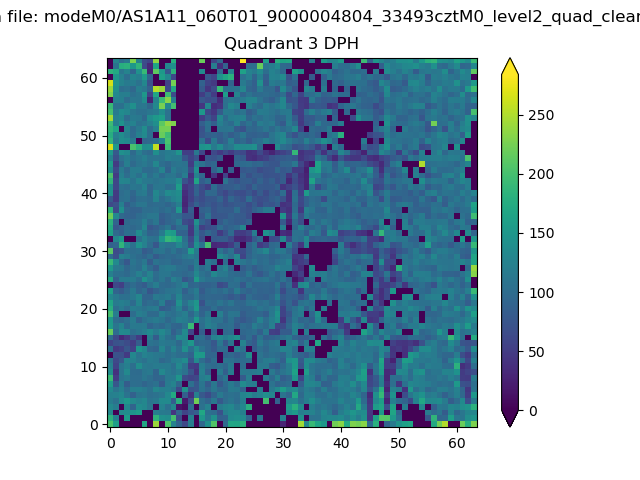 |
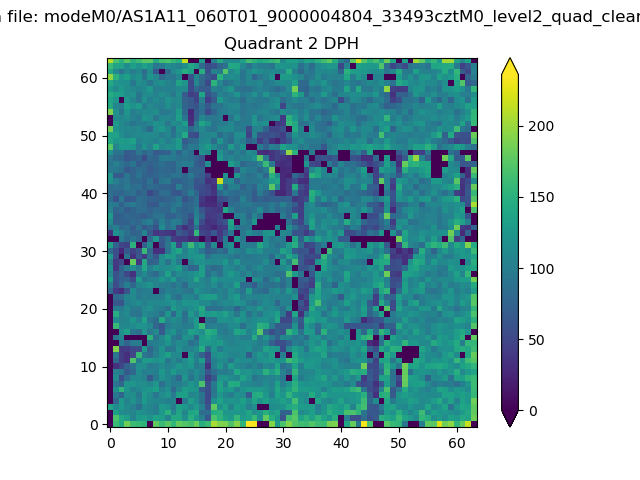 |
Quadrant C |
| Plot type | Count rate plots | Images |
|---|---|---|
| Comparison with Poisson distribution Blue bars denote a histogram of data divided into 1 sec bins. Red curve is a Poisson curve with rate = median count rate of data. |
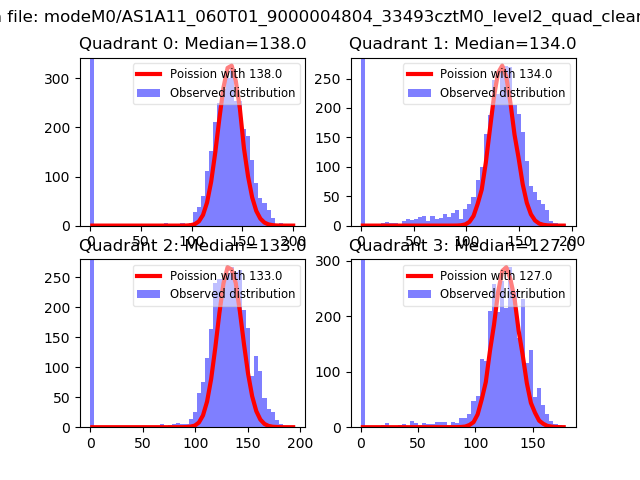 |
 |
| Quadrant-wise count rates Data is divided into 100 sec bins |
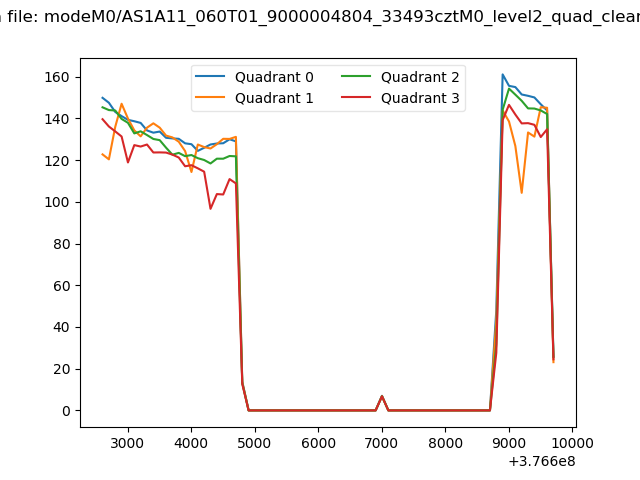 |
|
| Module-wise count rates for Quadrant A Data is divided into 100 sec bins |
 |
 |
| Module-wise count rates for Quadrant B Data is divided into 100 sec bins |
 |
 |
| Module-wise count rates for Quadrant C Data is divided into 100 sec bins |
 |
 |
| Module-wise count rates for Quadrant D Data is divided into 100 sec bins |
 |
 |
| Parameter | Plot |
|---|---|
| CZT HV Monitor |  |
| D_VDD | 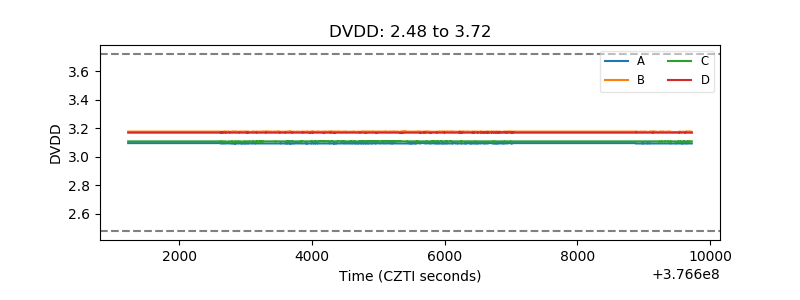 |
| Temperature 1 | 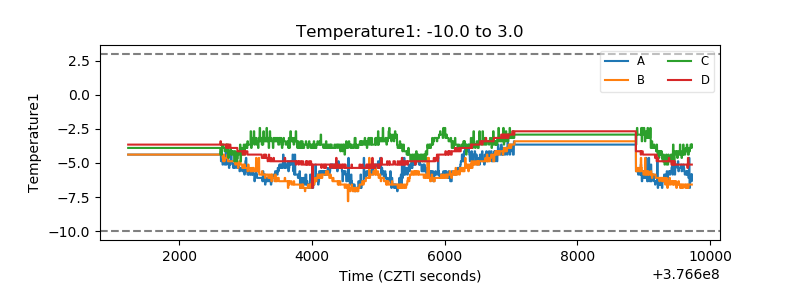 |
| Veto HV Monitor | 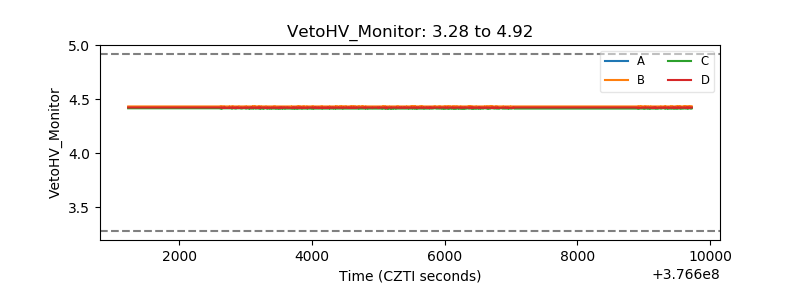 |
| Veto LLD |  |
| Alpha Counter | 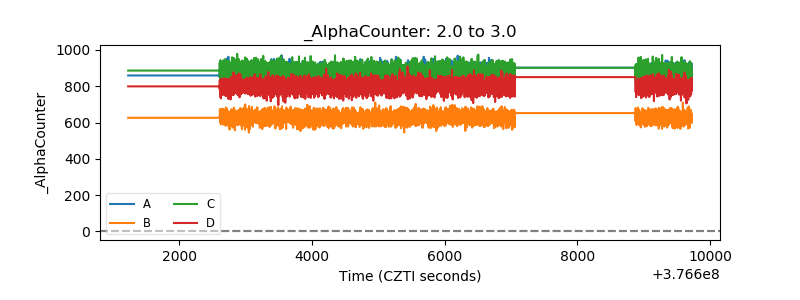 |
| _CPM_Rate | 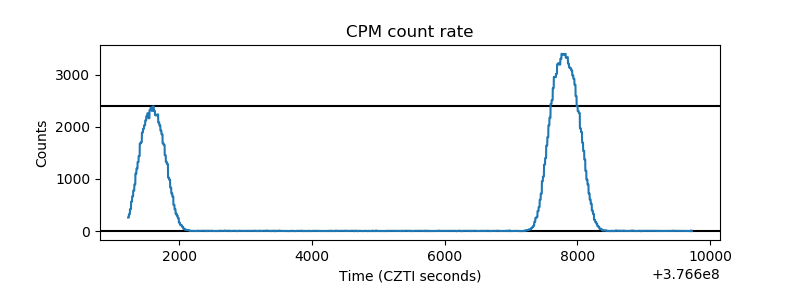 |
| CZT Counter | 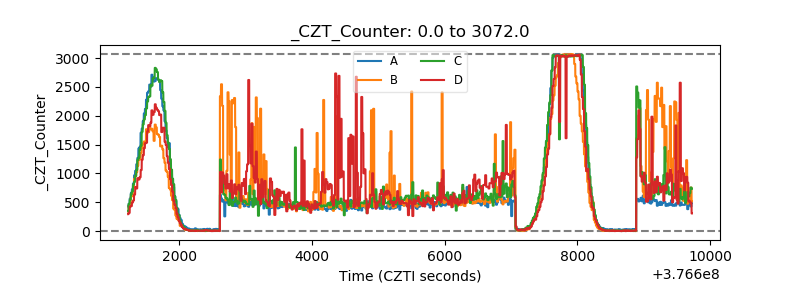 |
| +2.5 Volts monitor |  |
| +5 Volts monitor | 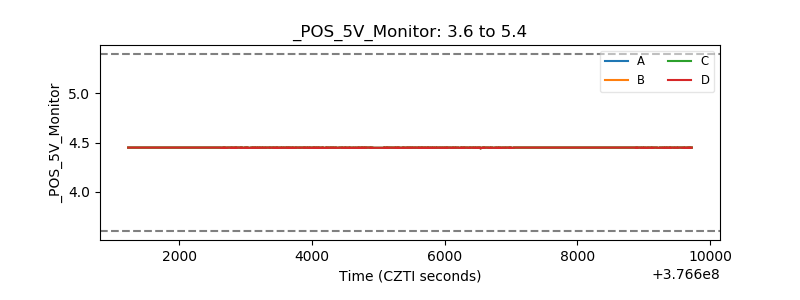 |
| _ROLL_ROT |  |
| _Roll_DEC | 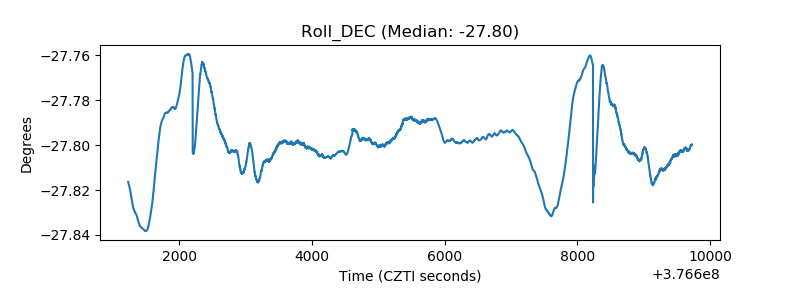 |
| _Roll_RA | 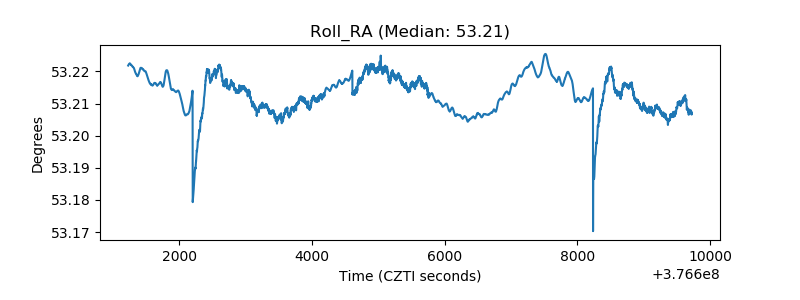 |
| Veto Counter |  |