| Param | Original file | Final file |
|---|---|---|
| Filename | modeM0/AS1A11_060T01_9000004804_33495cztM0_level2.evt | modeM0/AS1A11_060T01_9000004804_33495cztM0_level2_quad_clean.evt |
| Size (bytes) | 534,729,600 | 69,923,520 |
| Size | 510.0 MB | 66.7 MB |
| Events in quadrant A | 2,564,260 | 453,820 |
| Events in quadrant B | 5,512,966 | 432,319 |
| Events in quadrant C | 3,361,038 | 446,420 |
| Events in quadrant D | 4,405,599 | 421,446 |
| Mode M9 | |||
|---|---|---|---|
| Quadrant | BADHDUFLAG | Total packets | Discarded packets |
| A | 0 | 27 | 0 |
| B | 0 | 27 | 0 |
| C | 0 | 27 | 0 |
| D | 0 | 28 | 0 |
| Mode M0 | |||
|---|---|---|---|
| Quadrant | BADHDUFLAG | Total packets | Discarded packets |
| A | 0 | 10520 | 3 |
| B | 0 | 19875 | 2 |
| C | 0 | 13284 | 2 |
| D | 0 | 16522 | 2 |
| Mode SS | |||
|---|---|---|---|
| Quadrant | BADHDUFLAG | Total packets | Discarded packets |
| A | 0 | 106 | 0 |
| B | 0 | 106 | 0 |
| C | 0 | 106 | 0 |
| D | 0 | 106 | 0 |
| Quadrant | Total seconds | Saturated seconds | Saturation percentage |
|---|---|---|---|
| A | 5179 | 6 | 0.115852% |
| B | 5179 | 805 | 15.543541% |
| C | 5179 | 89 | 1.718478% |
| D | 5179 | 145 | 2.799768% |
Noise dominated data is calculated using 1-second bins in cleaned event files. If a bin has >2000 counts, and if more than 50% of those come from <1% of pixels, then it is considered to be noise-dominated and hence unusable.
| Quadrant | # 1 sec bins | Bins with >0 counts | Bins with >2000 counts | High rate bins dominated by noise | Noise dominated (total time) | Noise dominated (detector-on time) | Marked lightcurve |
|---|---|---|---|---|---|---|---|
| A | 7213 | 5180 | 0 | 0 | 0.00% | 0.00% | 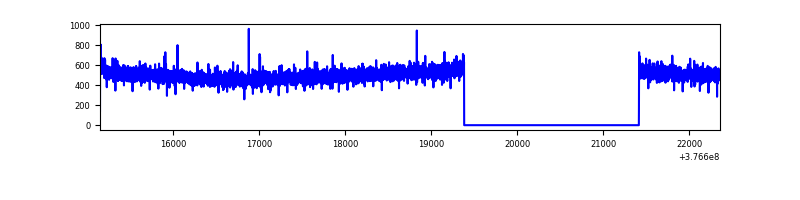 |
| B | 7213 | 5179 | 670 | 670 | 9.29% | 12.94% | 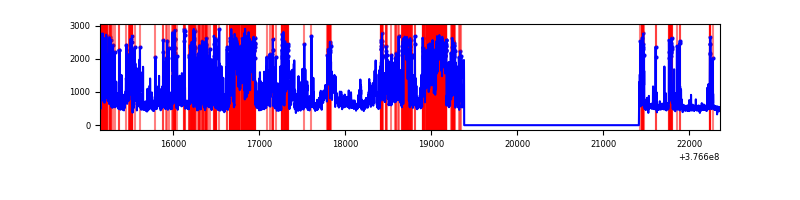 |
| C | 7213 | 5180 | 80 | 80 | 1.11% | 1.54% | 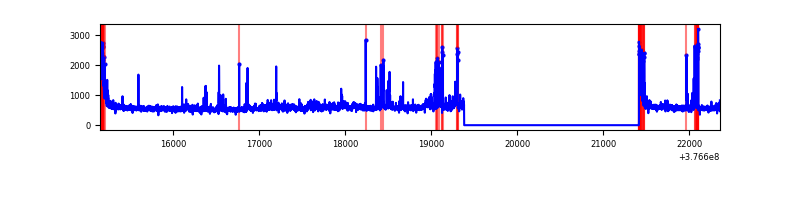 |
| D | 7213 | 5180 | 142 | 142 | 1.97% | 2.74% | 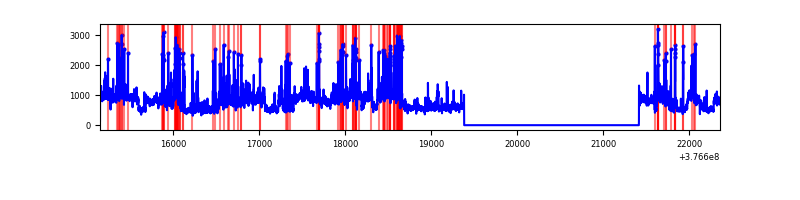 |
Top three noisy pixels from each quadrant. If the there are fewer than three noisy pixels in the level2.evt file, extra rows are filled as -1
| Pixel properties | Quadrant properties | ||||||
|---|---|---|---|---|---|---|---|
| Quadrant | DetID | PixID | Counts | Sigma | Mean | Median | Sigma |
| A | 13 | 254 | 8269 | 57.51 | 662 | 649 | 132.5 |
| A | 3 | 137 | 6103 | 41.17 | 662 | 649 | 132.5 |
| A | 10 | 83 | 5474 | 36.42 | 662 | 649 | 132.5 |
| B | 5 | 255 | 2233316 | 18834.96 | 630 | 615 | 118.5 |
| B | 5 | 172 | 772430 | 6511.0 | 630 | 615 | 118.5 |
| B | 4 | 251 | 18746 | 152.95 | 630 | 615 | 118.5 |
| C | 15 | 214 | 222486 | 1462.49 | 656 | 665 | 151.7 |
| C | 1 | 23 | 210878 | 1385.96 | 656 | 665 | 151.7 |
| C | 0 | 10 | 171514 | 1126.43 | 656 | 665 | 151.7 |
| D | 8 | 195 | 1172246 | 7454.5 | 643 | 626 | 157.2 |
| D | 13 | 249 | 277056 | 1758.8 | 643 | 626 | 157.2 |
| D | 2 | 249 | 213130 | 1352.07 | 643 | 626 | 157.2 |
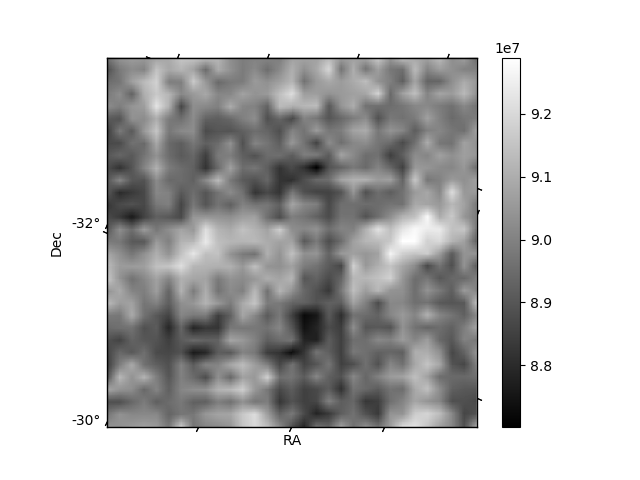
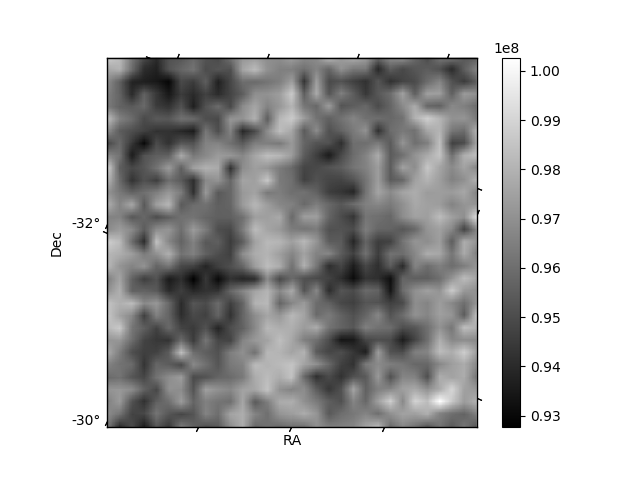
Histogram calculated using DETX and DETY for each event in the final _common_clean file
| Quadrant A | 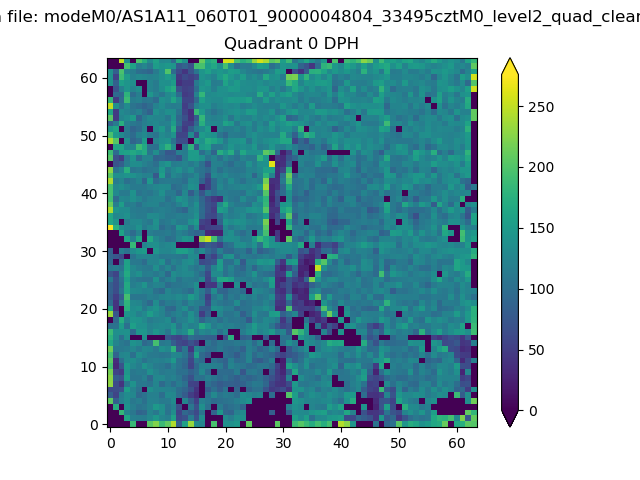 |
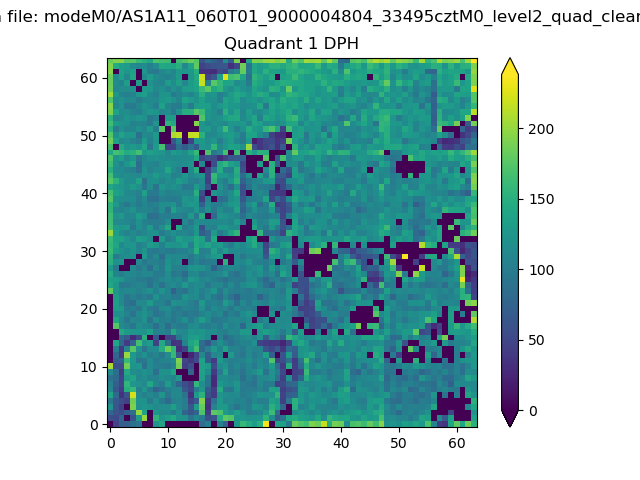 |
Quadrant B |
|---|---|---|---|
| Quadrant D | 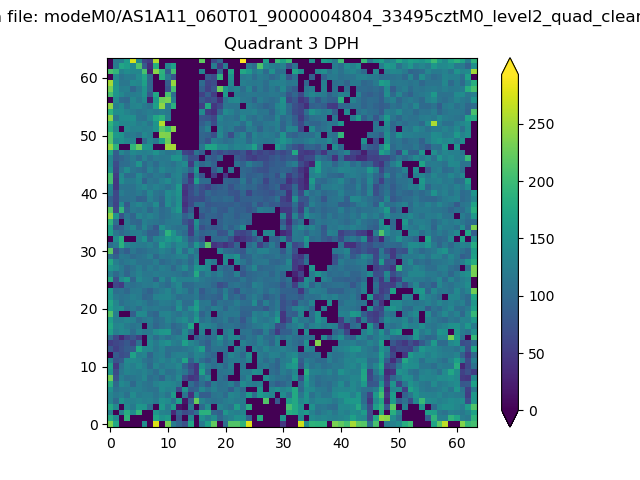 |
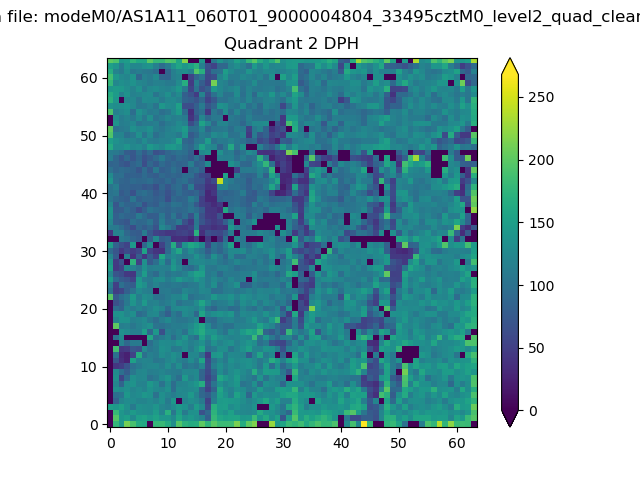 |
Quadrant C |
| Plot type | Count rate plots | Images |
|---|---|---|
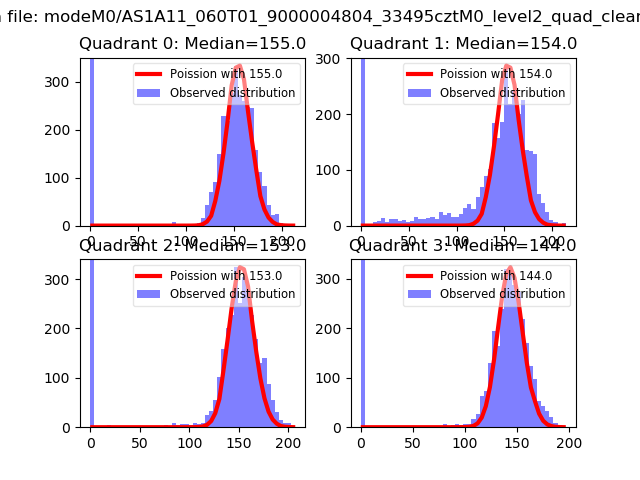
| Comparison with Poisson distribution Blue bars denote a histogram of data divided into 1 sec bins. Red curve is a Poisson curve with rate = median count rate of data. |
 |
 |
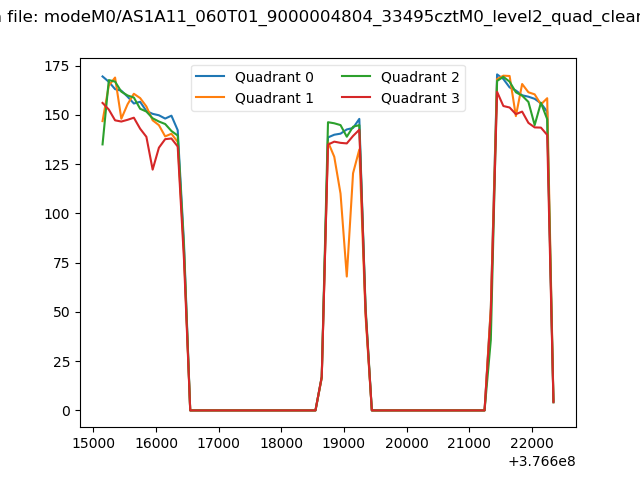
| Quadrant-wise count rates Data is divided into 100 sec bins |
 |
|
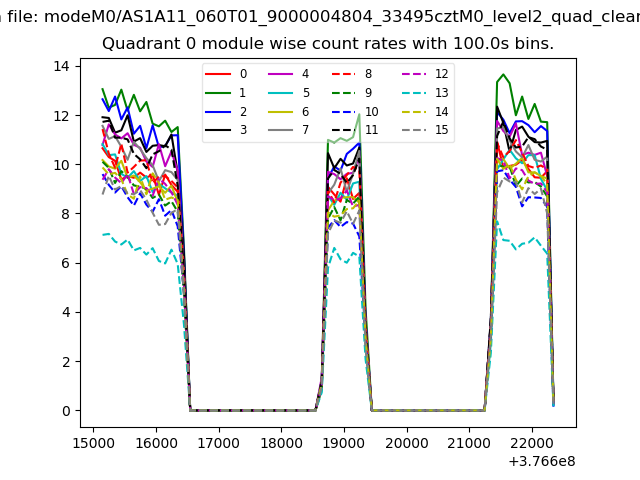
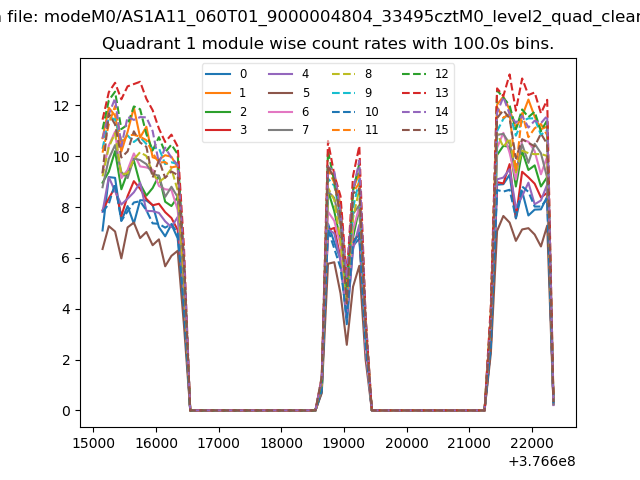
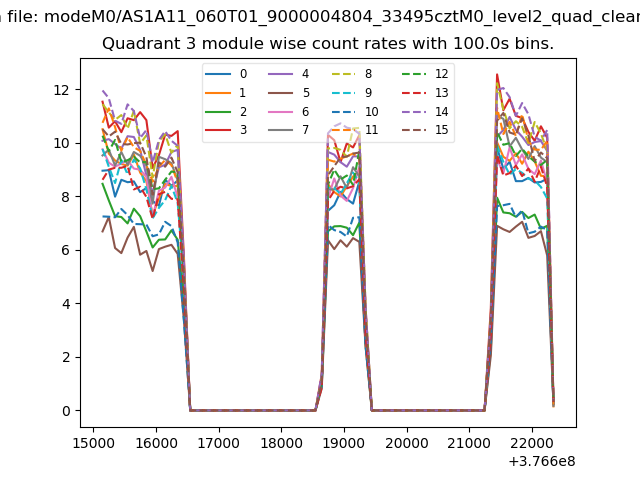
| Module-wise count rates for Quadrant A Data is divided into 100 sec bins |
 |
 |
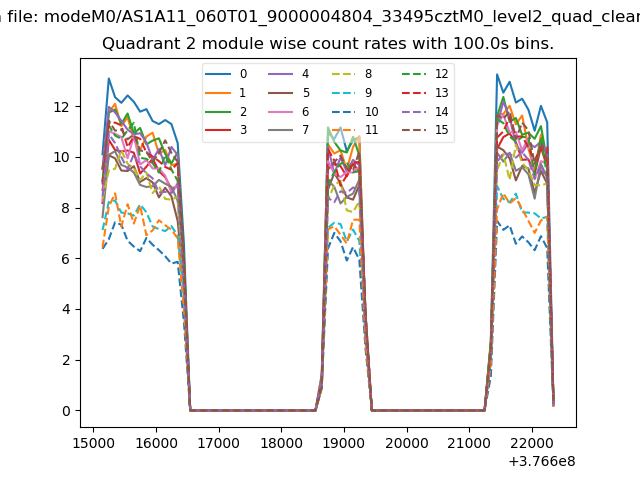
| Module-wise count rates for Quadrant B Data is divided into 100 sec bins |
 |
 |
| Module-wise count rates for Quadrant C Data is divided into 100 sec bins |
 |
 |
| Module-wise count rates for Quadrant D Data is divided into 100 sec bins |
 |
 |
| Parameter | Plot |
|---|---|
| CZT HV Monitor |  |
| D_VDD | 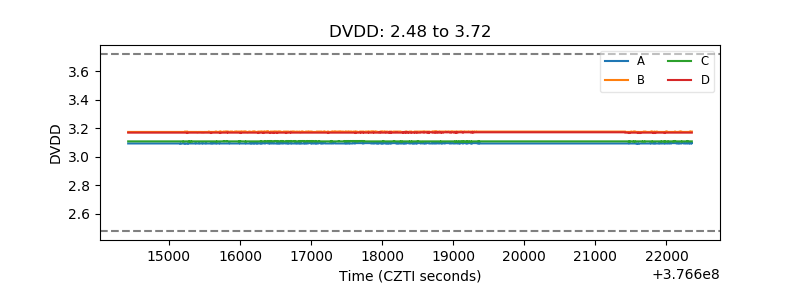 |
| Temperature 1 | 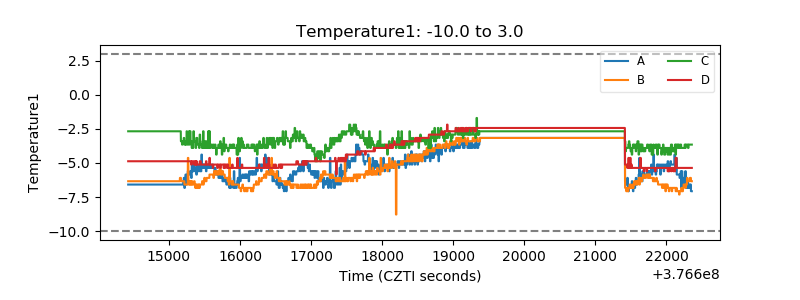 |
| Veto HV Monitor | 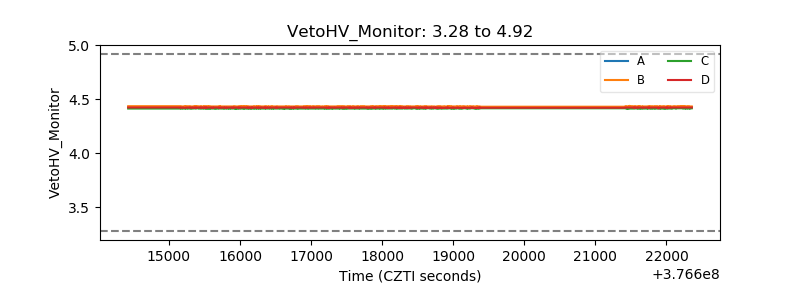 |
| Veto LLD | 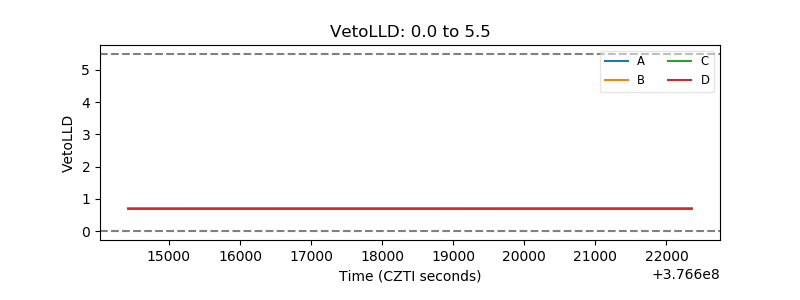 |
| Alpha Counter | 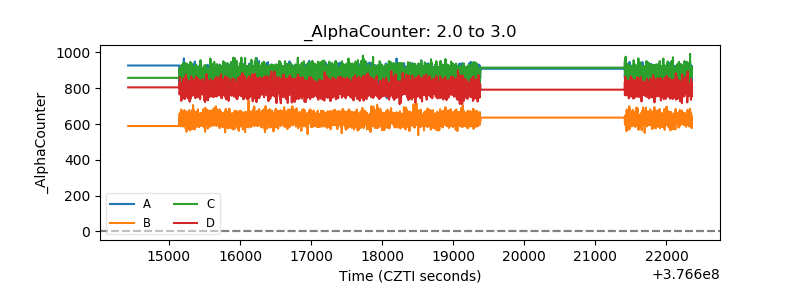 |
| _CPM_Rate | 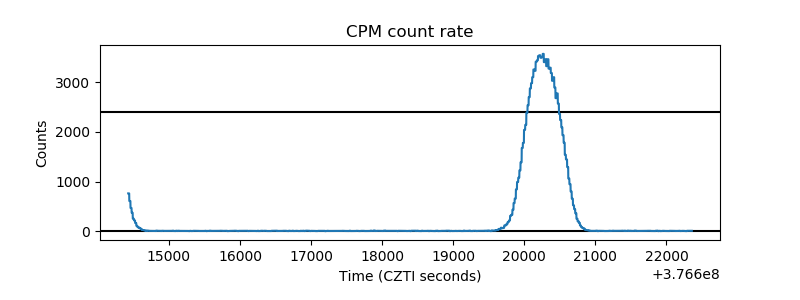 |
| CZT Counter | 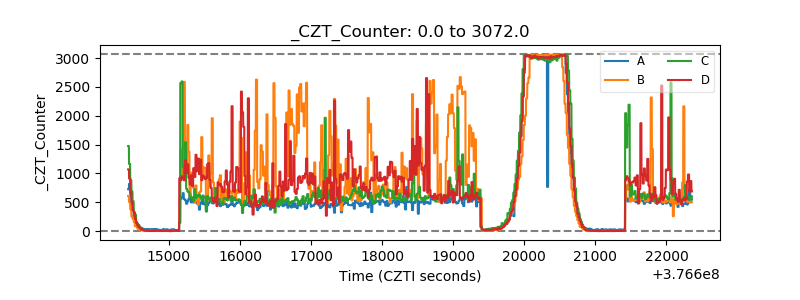 |
| +2.5 Volts monitor |  |
| +5 Volts monitor |  |
| _ROLL_ROT | 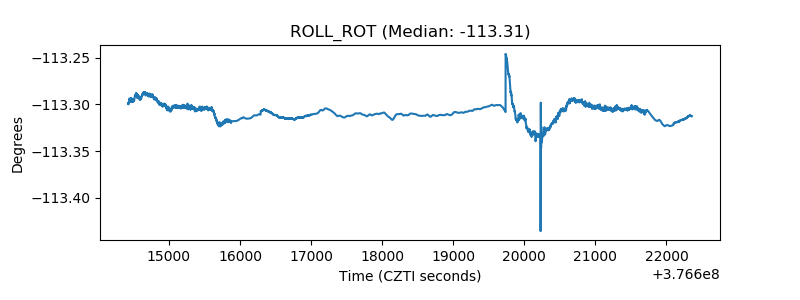 |
| _Roll_DEC | 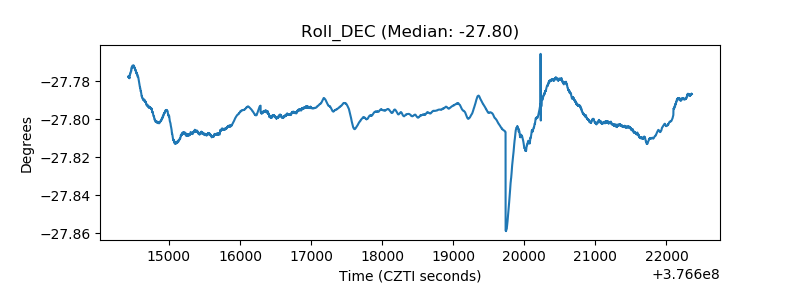 |
| _Roll_RA | 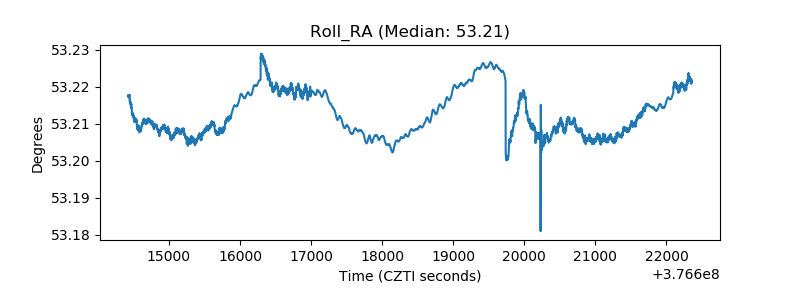 |
| Veto Counter |  |