| Param | Original file | Final file |
|---|---|---|
| Filename | modeM0/AS1A11_060T01_9000004804_33496cztM0_level2.evt | modeM0/AS1A11_060T01_9000004804_33496cztM0_level2_quad_clean.evt |
| Size (bytes) | 429,739,200 | 59,716,800 |
| Size | 409.8 MB | 57.0 MB |
| Events in quadrant A | 2,455,575 | 371,304 |
| Events in quadrant B | 2,948,648 | 379,757 |
| Events in quadrant C | 3,181,552 | 367,211 |
| Events in quadrant D | 4,093,470 | 343,014 |
| Mode M9 | |||
|---|---|---|---|
| Quadrant | BADHDUFLAG | Total packets | Discarded packets |
| A | 0 | 27 | 0 |
| B | 0 | 27 | 0 |
| C | 0 | 27 | 0 |
| D | 0 | 28 | 0 |
| Mode M0 | |||
|---|---|---|---|
| Quadrant | BADHDUFLAG | Total packets | Discarded packets |
| A | 0 | 10005 | 3 |
| B | 0 | 11516 | 2 |
| C | 0 | 12575 | 2 |
| D | 0 | 15260 | 2 |
| Mode SS | |||
|---|---|---|---|
| Quadrant | BADHDUFLAG | Total packets | Discarded packets |
| A | 0 | 102 | 0 |
| B | 0 | 102 | 0 |
| C | 0 | 102 | 0 |
| D | 0 | 102 | 0 |
| Quadrant | Total seconds | Saturated seconds | Saturation percentage |
|---|---|---|---|
| A | 4938 | 8 | 0.162009% |
| B | 4938 | 113 | 2.288376% |
| C | 4938 | 88 | 1.782098% |
| D | 4938 | 157 | 3.179425% |
Noise dominated data is calculated using 1-second bins in cleaned event files. If a bin has >2000 counts, and if more than 50% of those come from <1% of pixels, then it is considered to be noise-dominated and hence unusable.
| Quadrant | # 1 sec bins | Bins with >0 counts | Bins with >2000 counts | High rate bins dominated by noise | Noise dominated (total time) | Noise dominated (detector-on time) | Marked lightcurve |
|---|---|---|---|---|---|---|---|
| A | 7060 | 4939 | 0 | 0 | 0.00% | 0.00% | 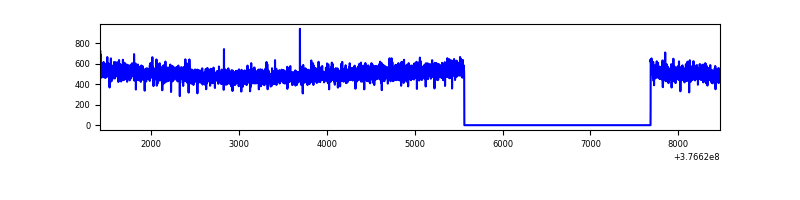 |
| B | 7060 | 4939 | 87 | 87 | 1.23% | 1.76% | 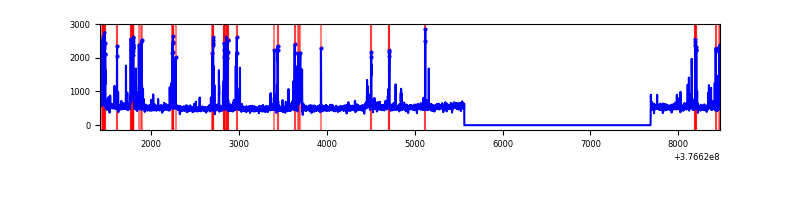 |
| C | 7060 | 4939 | 84 | 84 | 1.19% | 1.70% | 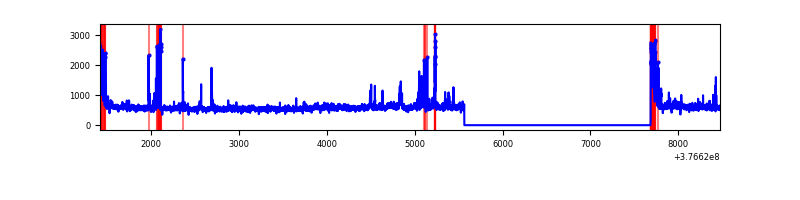 |
| D | 7060 | 4939 | 167 | 167 | 2.37% | 3.38% | 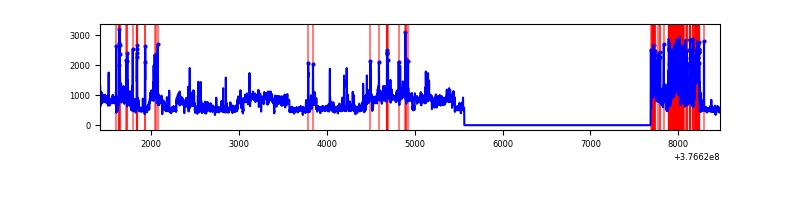 |
Top three noisy pixels from each quadrant. If the there are fewer than three noisy pixels in the level2.evt file, extra rows are filled as -1
| Pixel properties | Quadrant properties | ||||||
|---|---|---|---|---|---|---|---|
| Quadrant | DetID | PixID | Counts | Sigma | Mean | Median | Sigma |
| A | 13 | 254 | 7271 | 52.56 | 634 | 623 | 126.5 |
| A | 13 | 6 | 6905 | 49.66 | 634 | 623 | 126.5 |
| A | 3 | 137 | 5788 | 40.83 | 634 | 623 | 126.5 |
| B | 5 | 172 | 383938 | 3195.3 | 635 | 621 | 120.0 |
| B | 5 | 255 | 54155 | 446.25 | 635 | 621 | 120.0 |
| B | 12 | 111 | 14236 | 113.49 | 635 | 621 | 120.0 |
| C | 0 | 10 | 213756 | 1469.89 | 630 | 638 | 145.0 |
| C | 15 | 214 | 212917 | 1464.1 | 630 | 638 | 145.0 |
| C | 1 | 23 | 162373 | 1115.5 | 630 | 638 | 145.0 |
| D | 8 | 195 | 985894 | 6596.25 | 619 | 605 | 149.4 |
| D | 2 | 250 | 338377 | 2261.3 | 619 | 605 | 149.4 |
| D | 13 | 249 | 253866 | 1695.52 | 619 | 605 | 149.4 |
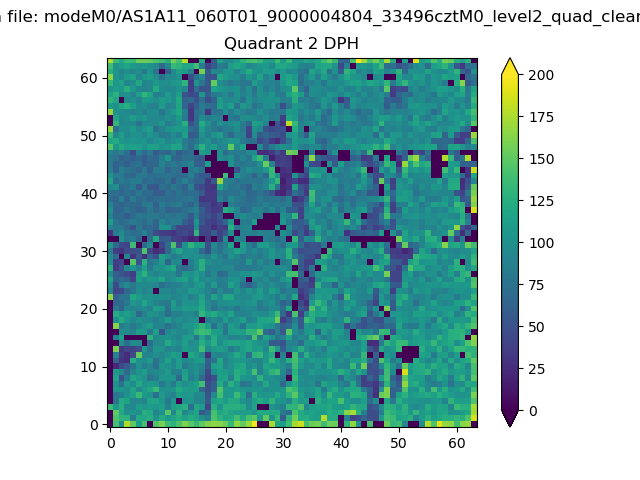
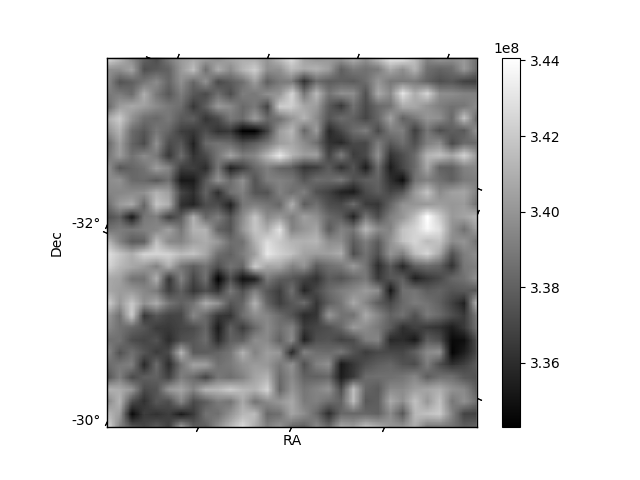
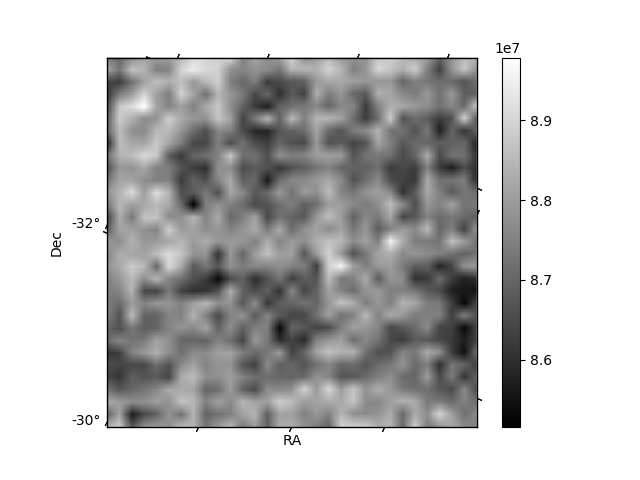
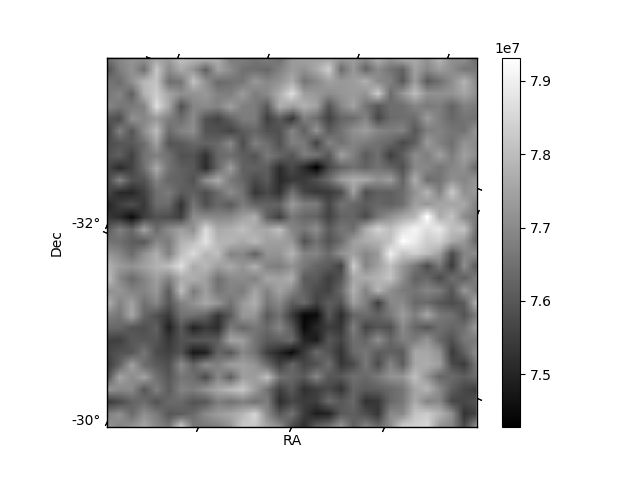
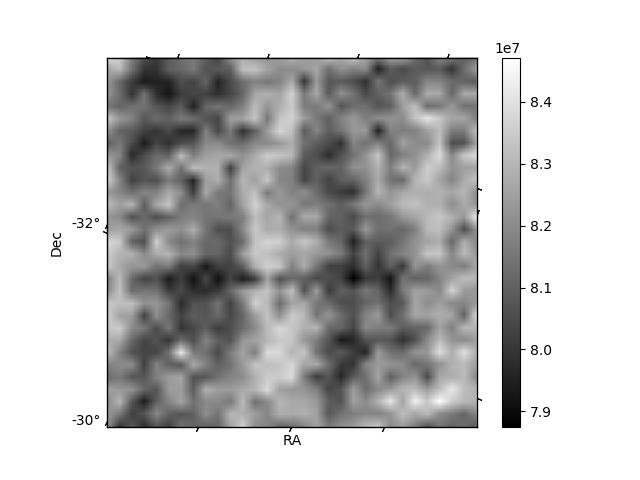
Histogram calculated using DETX and DETY for each event in the final _common_clean file
| Quadrant A | 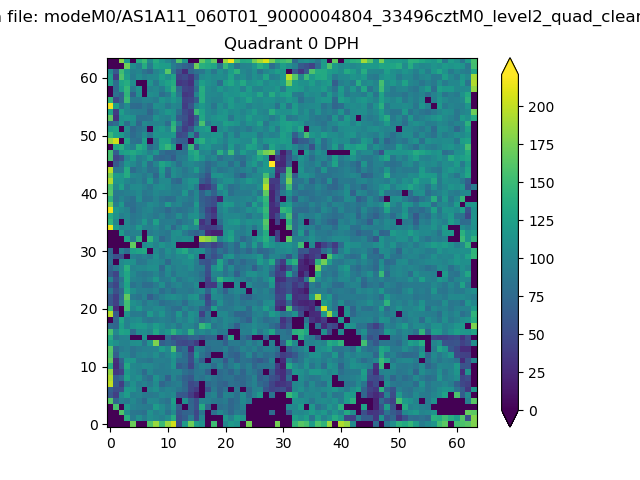 |
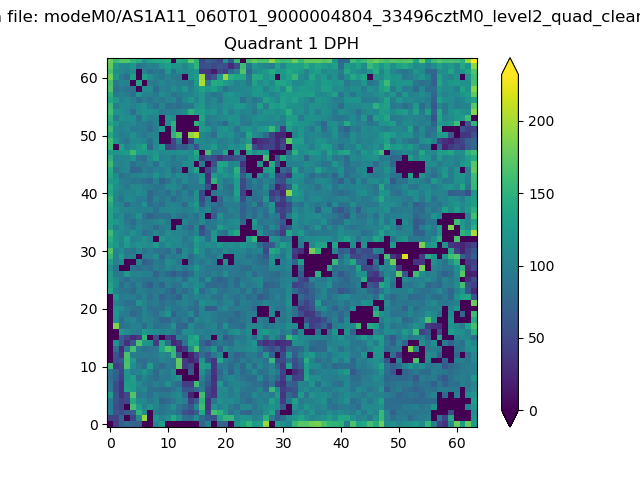 |
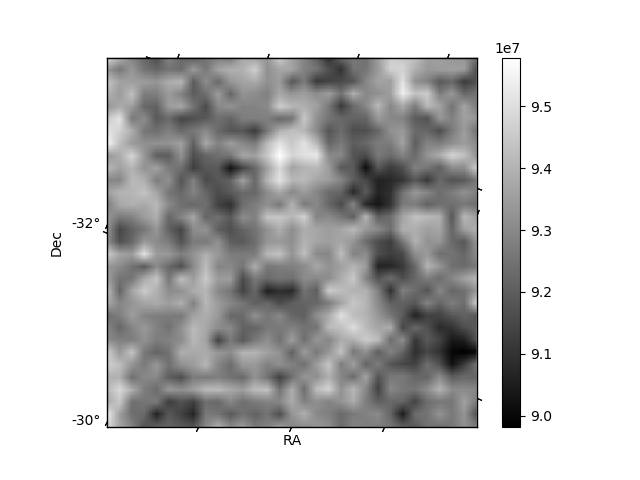
Quadrant B |
|---|---|---|---|
| Quadrant D | 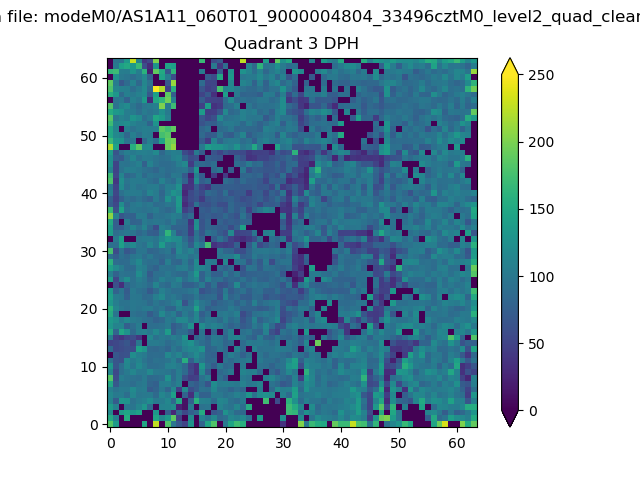 |
 |
Quadrant C |
| Plot type | Count rate plots | Images |
|---|---|---|
| Comparison with Poisson distribution Blue bars denote a histogram of data divided into 1 sec bins. Red curve is a Poisson curve with rate = median count rate of data. |
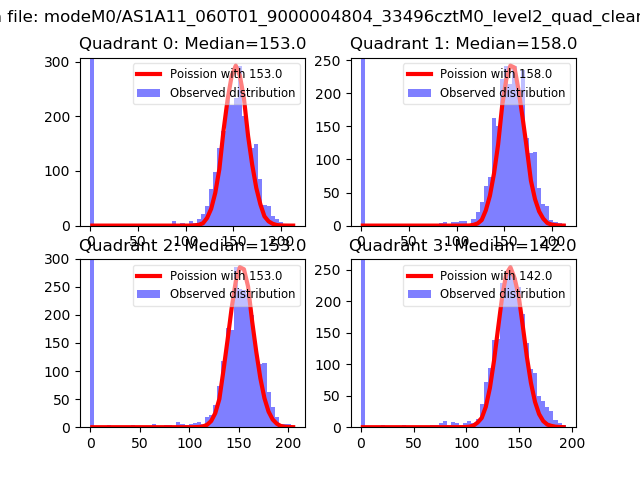 |
 |
| Quadrant-wise count rates Data is divided into 100 sec bins |
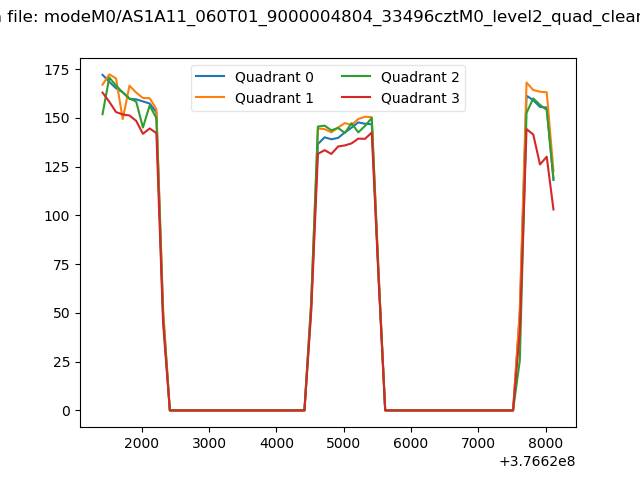 |
|
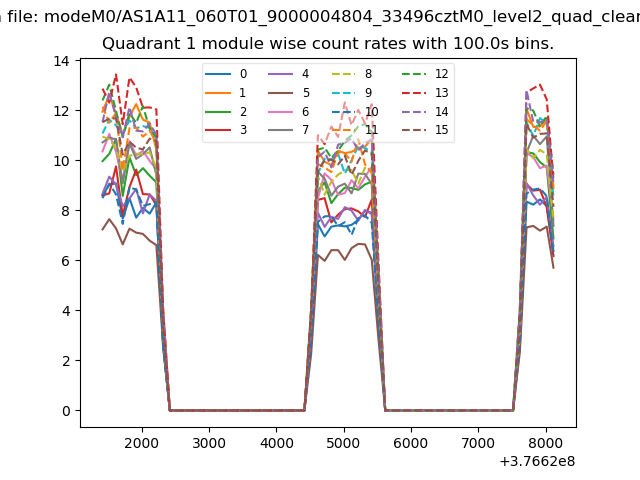
| Module-wise count rates for Quadrant A Data is divided into 100 sec bins |
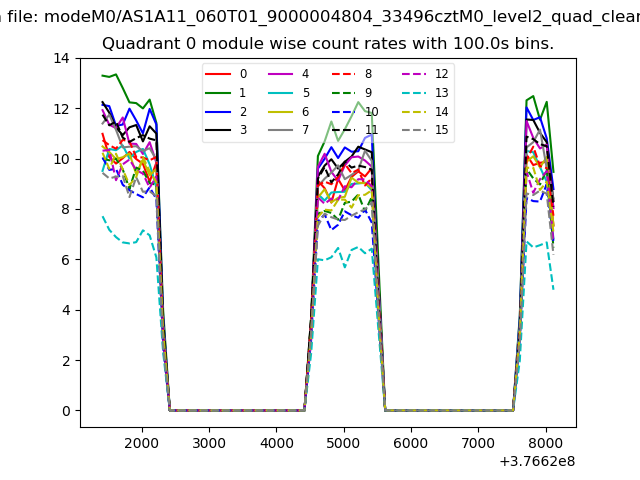 |
 |
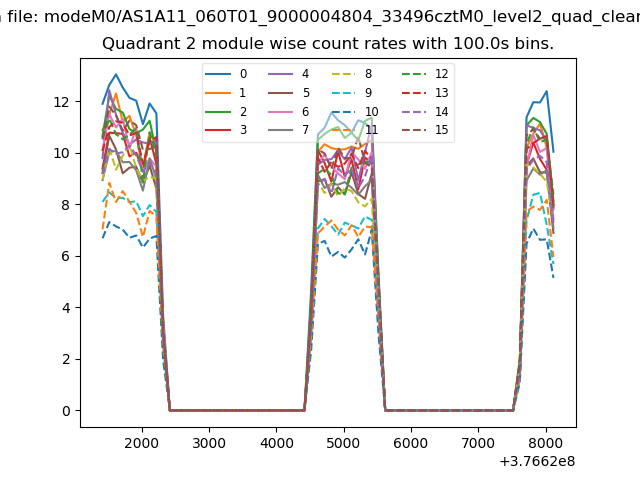
| Module-wise count rates for Quadrant B Data is divided into 100 sec bins |
 |
 |
| Module-wise count rates for Quadrant C Data is divided into 100 sec bins |
 |
 |
| Module-wise count rates for Quadrant D Data is divided into 100 sec bins |
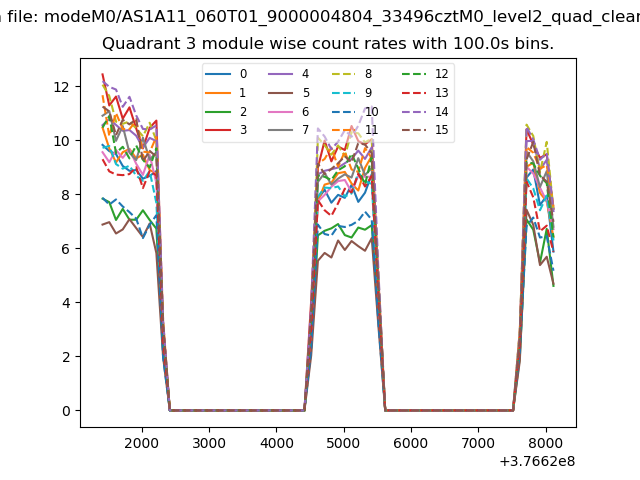 |
 |
| Parameter | Plot |
|---|---|
| CZT HV Monitor | 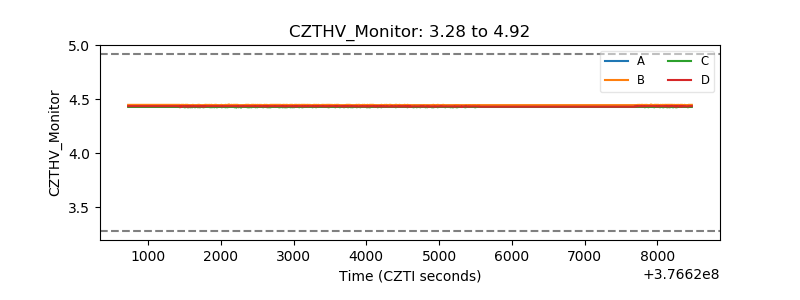 |
| D_VDD | 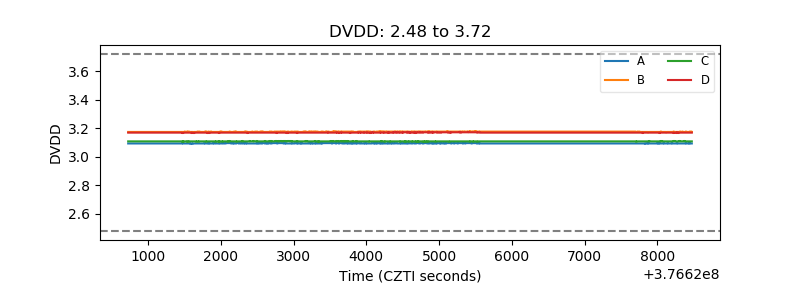 |
| Temperature 1 | 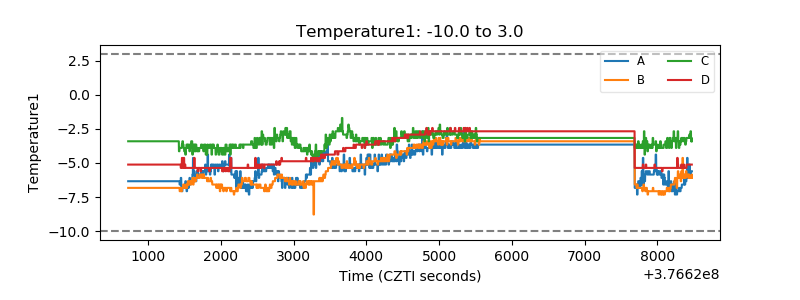 |
| Veto HV Monitor | 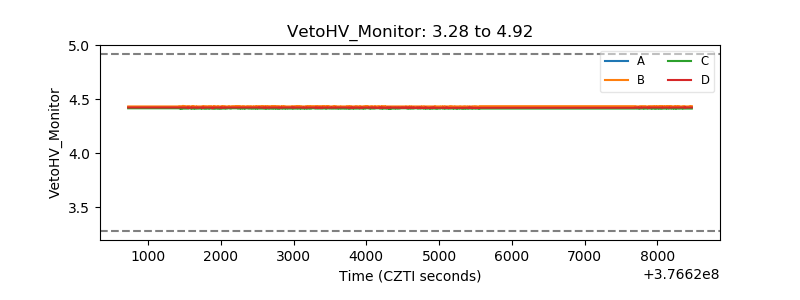 |
| Veto LLD | 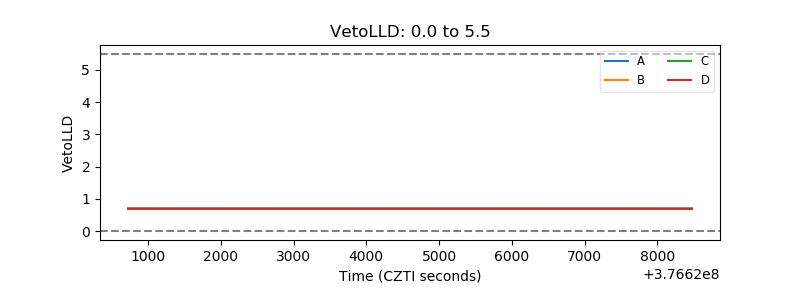 |
| Alpha Counter | 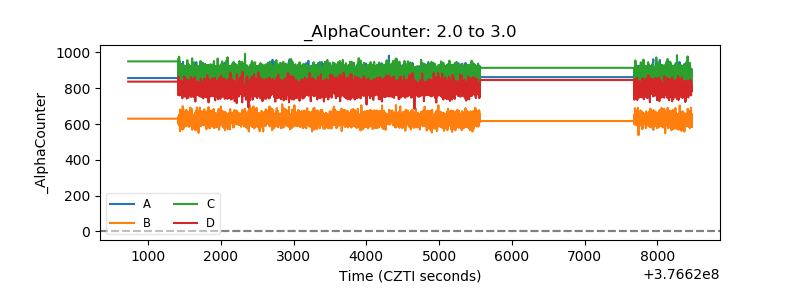 |
| _CPM_Rate | 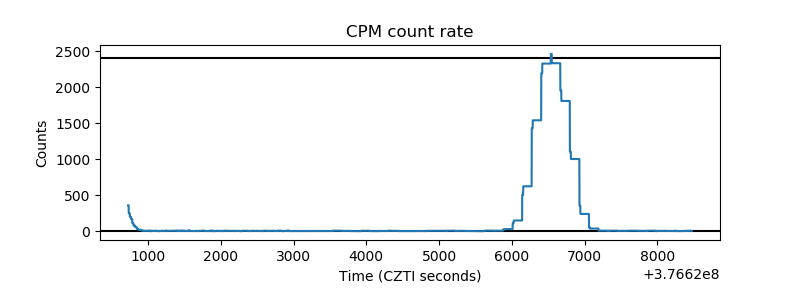 |
| CZT Counter | 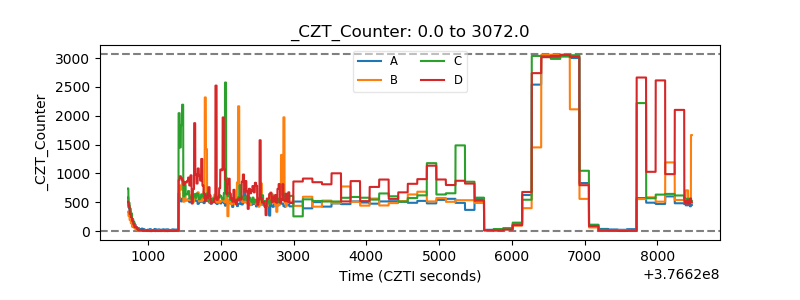 |
| +2.5 Volts monitor | 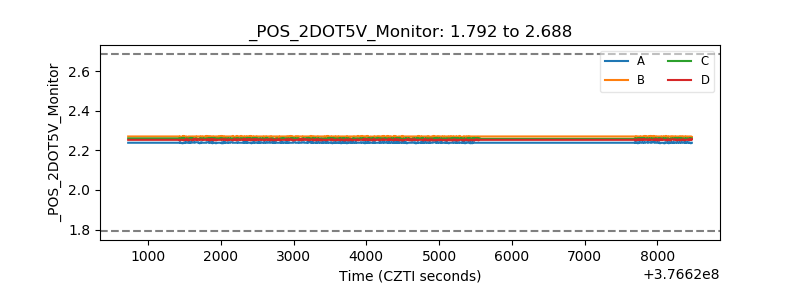 |
| +5 Volts monitor | 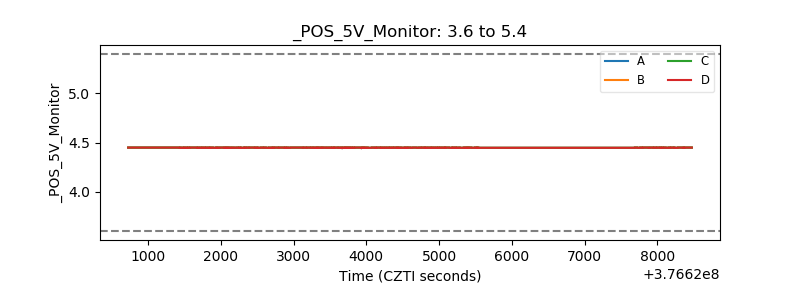 |
| _ROLL_ROT | 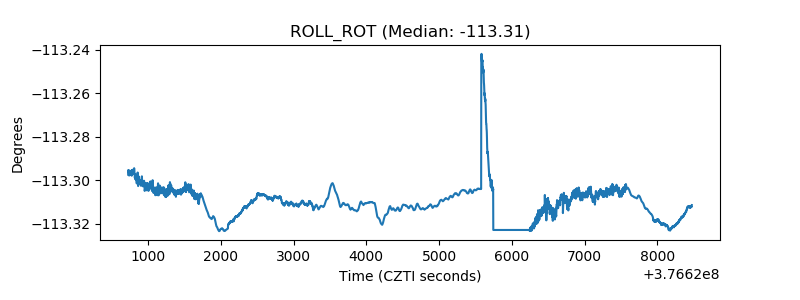 |
| _Roll_DEC | 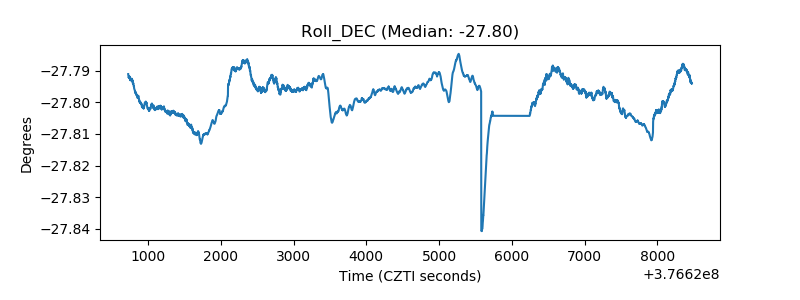 |
| _Roll_RA | 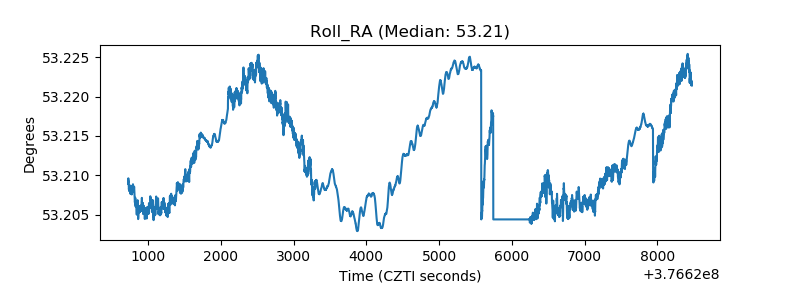 |
| Veto Counter | 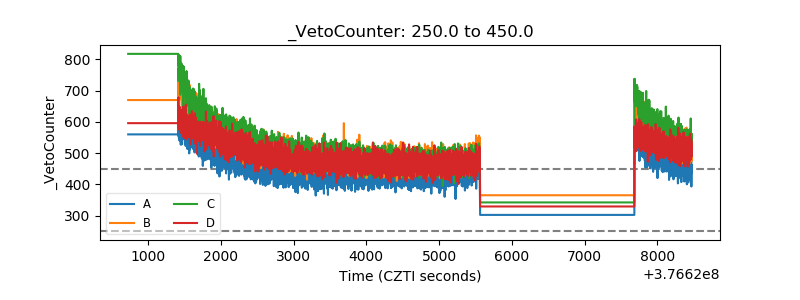 |