| Param | Original file | Final file |
|---|---|---|
| Filename | modeM0/AS1A11_060T01_9000004804_33498cztM0_level2.evt | modeM0/AS1A11_060T01_9000004804_33498cztM0_level2_quad_clean.evt |
| Size (bytes) | 457,413,120 | 58,112,640 |
| Size | 436.2 MB | 55.4 MB |
| Events in quadrant A | 2,633,099 | 346,937 |
| Events in quadrant B | 3,376,199 | 348,028 |
| Events in quadrant C | 3,333,925 | 345,447 |
| Events in quadrant D | 4,133,498 | 331,092 |
| Mode M9 | |||
|---|---|---|---|
| Quadrant | BADHDUFLAG | Total packets | Discarded packets |
| A | 0 | 42 | 0 |
| B | 0 | 42 | 0 |
| C | 0 | 42 | 0 |
| D | 0 | 42 | 0 |
| Mode M0 | |||
|---|---|---|---|
| Quadrant | BADHDUFLAG | Total packets | Discarded packets |
| A | 0 | 11157 | 2 |
| B | 0 | 13338 | 1 |
| C | 0 | 13027 | 1 |
| D | 0 | 16016 | 1 |
| Mode SS | |||
|---|---|---|---|
| Quadrant | BADHDUFLAG | Total packets | Discarded packets |
| A | 0 | 112 | 0 |
| B | 0 | 112 | 0 |
| C | 0 | 112 | 0 |
| D | 0 | 112 | 0 |
| Quadrant | Total seconds | Saturated seconds | Saturation percentage |
|---|---|---|---|
| A | 5552 | 7 | 0.126081% |
| B | 5552 | 128 | 2.305476% |
| C | 5552 | 97 | 1.747118% |
| D | 5552 | 105 | 1.891210% |
Noise dominated data is calculated using 1-second bins in cleaned event files. If a bin has >2000 counts, and if more than 50% of those come from <1% of pixels, then it is considered to be noise-dominated and hence unusable.
| Quadrant | # 1 sec bins | Bins with >0 counts | Bins with >2000 counts | High rate bins dominated by noise | Noise dominated (total time) | Noise dominated (detector-on time) | Marked lightcurve |
|---|---|---|---|---|---|---|---|
| A | 9679 | 5554 | 0 | 0 | 0.00% | 0.00% | 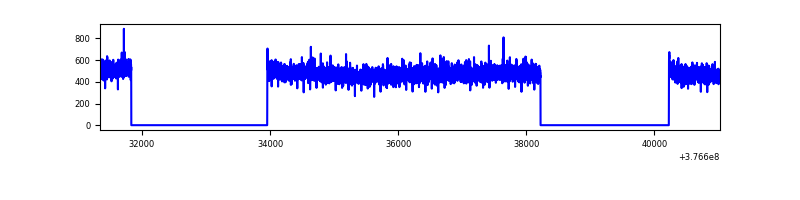 |
| B | 9679 | 5554 | 84 | 84 | 0.87% | 1.51% | 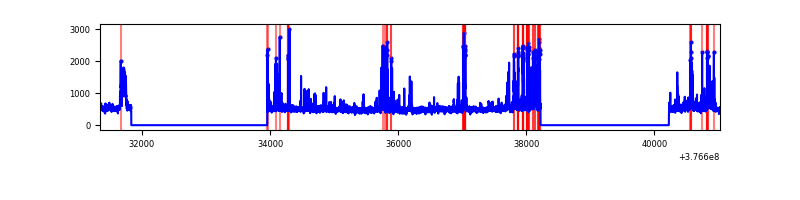 |
| C | 9679 | 5554 | 76 | 76 | 0.79% | 1.37% | 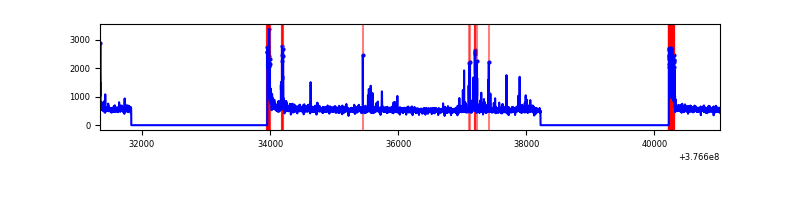 |
| D | 9679 | 5554 | 91 | 91 | 0.94% | 1.64% | 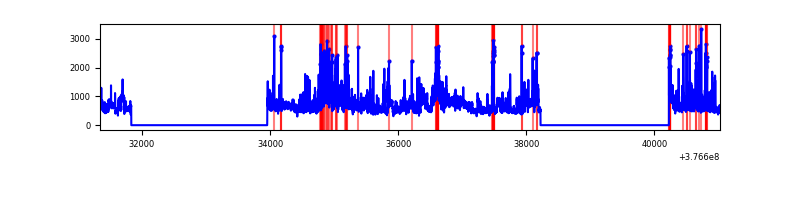 |
Top three noisy pixels from each quadrant. If the there are fewer than three noisy pixels in the level2.evt file, extra rows are filled as -1
| Pixel properties | Quadrant properties | ||||||
|---|---|---|---|---|---|---|---|
| Quadrant | DetID | PixID | Counts | Sigma | Mean | Median | Sigma |
| A | 13 | 254 | 7895 | 53.14 | 680 | 668 | 136.0 |
| A | 3 | 137 | 6600 | 43.62 | 680 | 668 | 136.0 |
| A | 10 | 83 | 5721 | 37.16 | 680 | 668 | 136.0 |
| B | 5 | 172 | 527102 | 4064.76 | 675 | 658 | 129.5 |
| B | 5 | 255 | 152686 | 1173.83 | 675 | 658 | 129.5 |
| B | 12 | 111 | 15785 | 116.8 | 675 | 658 | 129.5 |
| C | 0 | 10 | 237998 | 1538.72 | 664 | 671 | 154.2 |
| C | 15 | 214 | 236689 | 1530.23 | 664 | 671 | 154.2 |
| C | 1 | 23 | 125027 | 806.27 | 664 | 671 | 154.2 |
| D | 8 | 195 | 739427 | 4566.55 | 661 | 642 | 161.8 |
| D | 2 | 249 | 351771 | 2170.39 | 661 | 642 | 161.8 |
| D | 2 | 120 | 148465 | 913.72 | 661 | 642 | 161.8 |
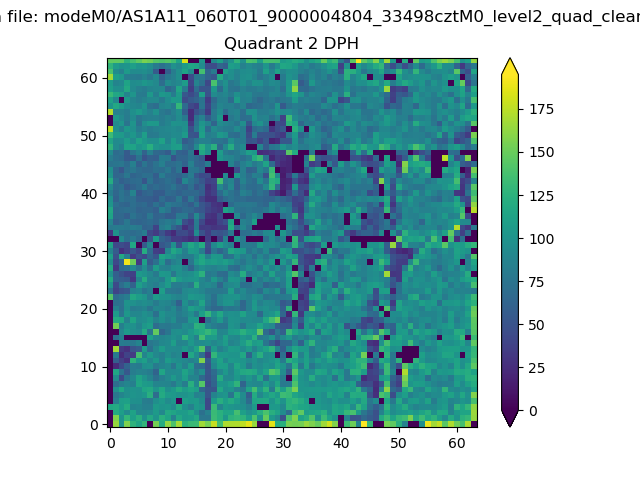
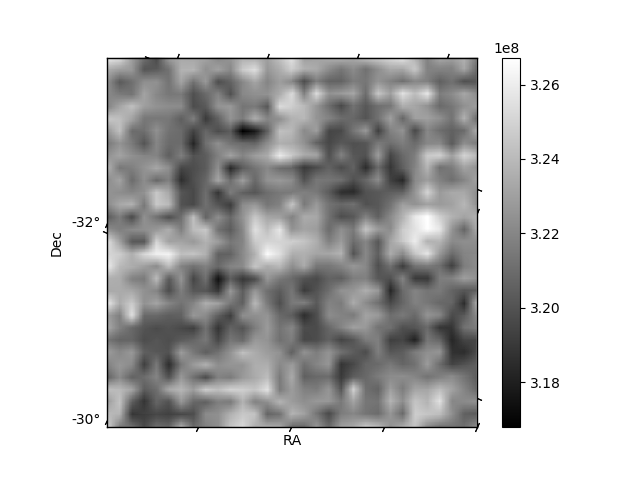
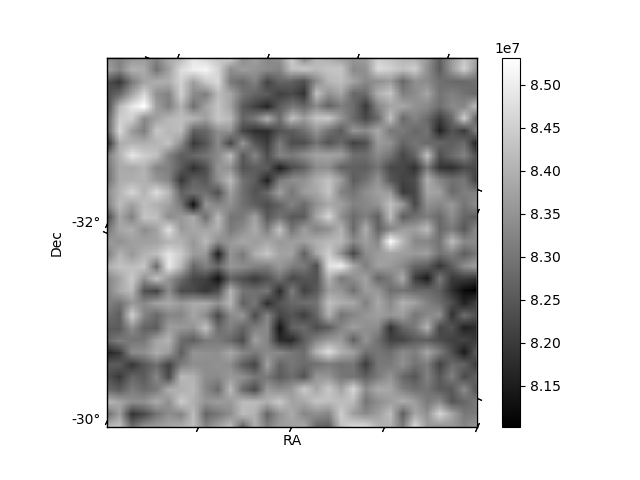
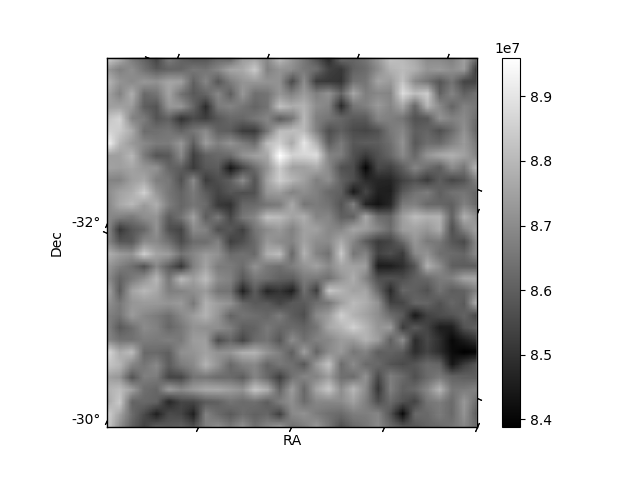
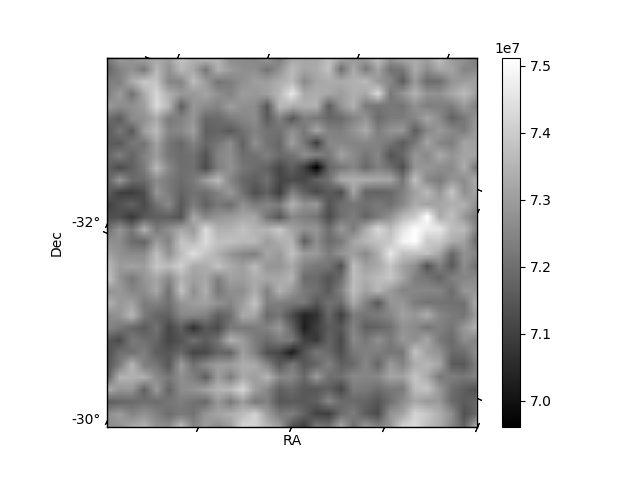
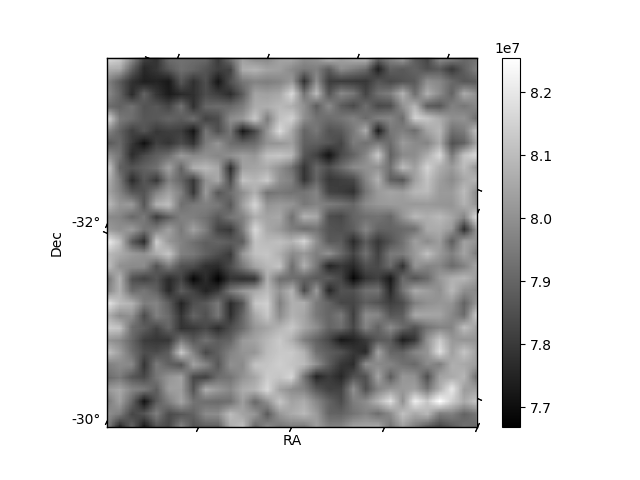
Histogram calculated using DETX and DETY for each event in the final _common_clean file
| Quadrant A | 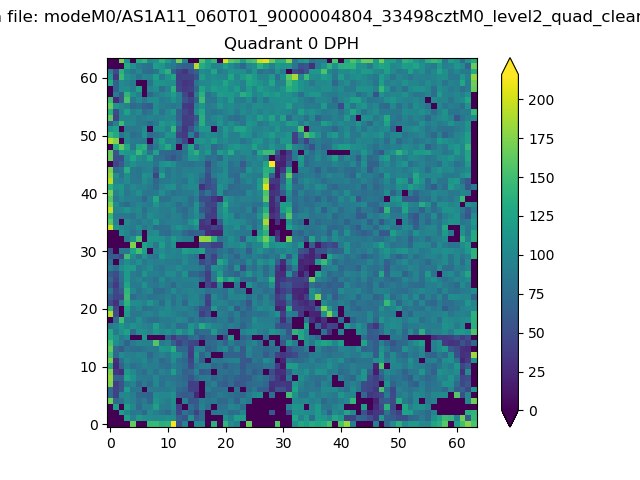 |
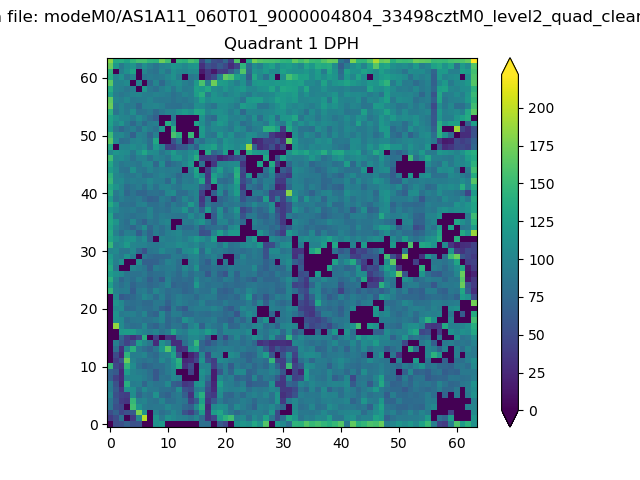 |
Quadrant B |
|---|---|---|---|
| Quadrant D | 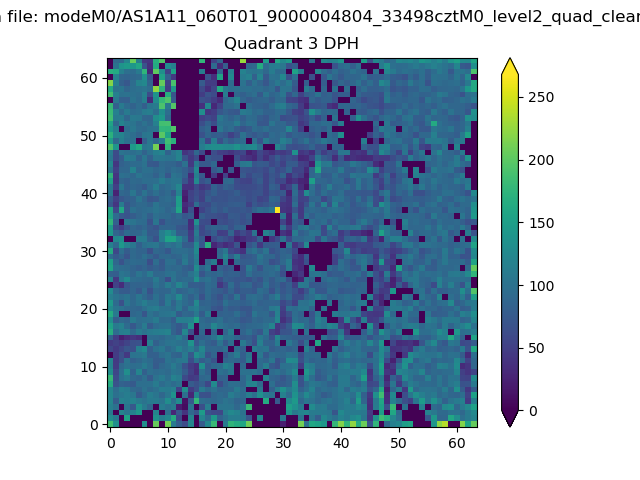 |
 |
Quadrant C |
| Plot type | Count rate plots | Images |
|---|---|---|
| Comparison with Poisson distribution Blue bars denote a histogram of data divided into 1 sec bins. Red curve is a Poisson curve with rate = median count rate of data. |
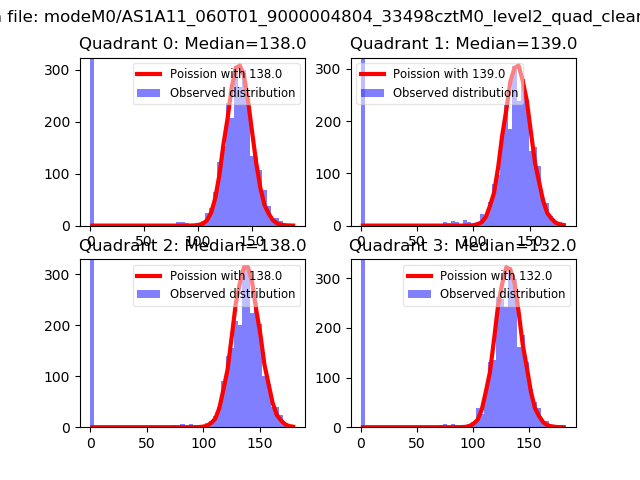 |
 |
| Quadrant-wise count rates Data is divided into 100 sec bins |
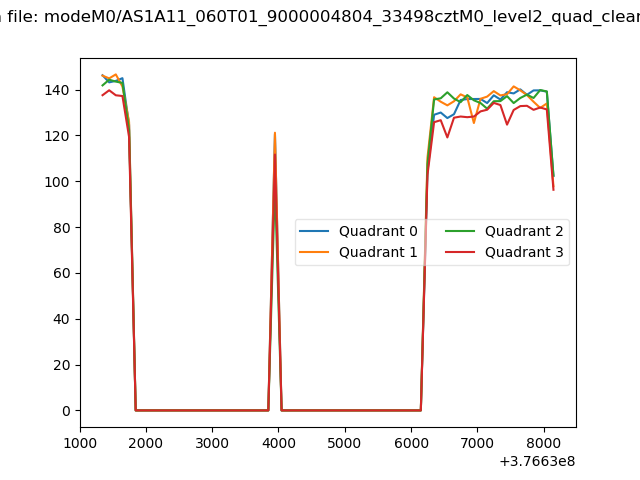 |
|
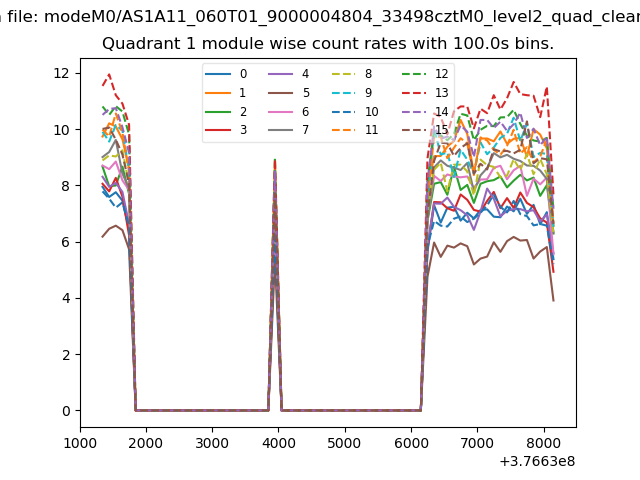
| Module-wise count rates for Quadrant A Data is divided into 100 sec bins |
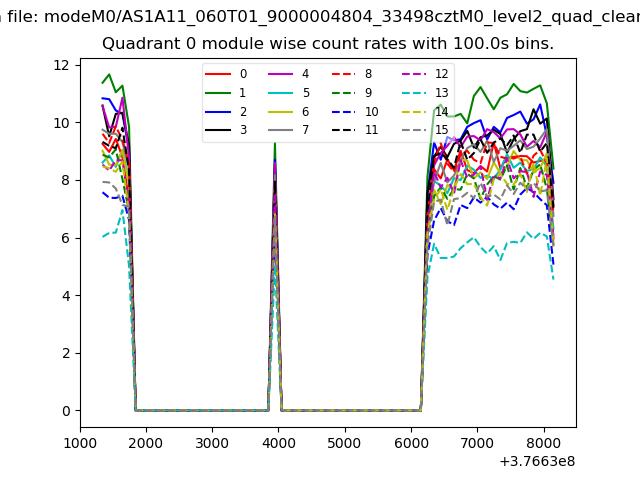 |
 |
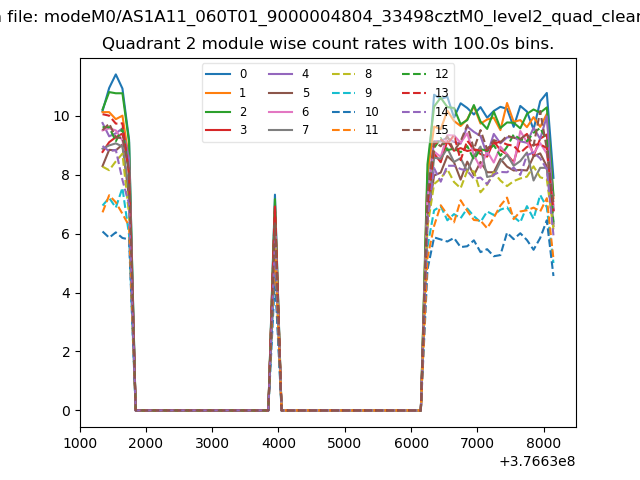
| Module-wise count rates for Quadrant B Data is divided into 100 sec bins |
 |
 |
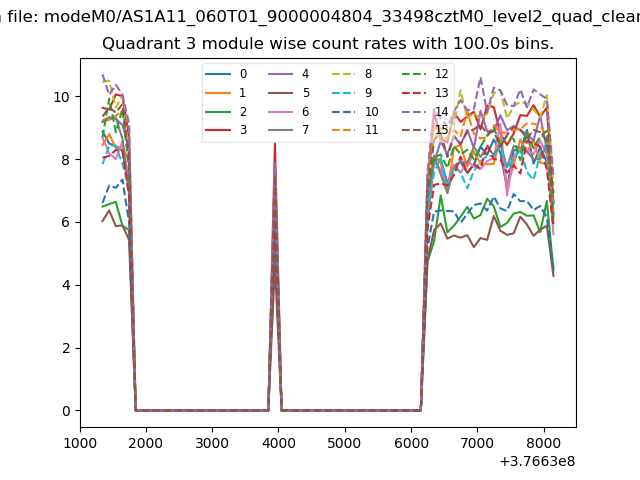
| Module-wise count rates for Quadrant C Data is divided into 100 sec bins |
 |
 |
| Module-wise count rates for Quadrant D Data is divided into 100 sec bins |
 |
 |
| Parameter | Plot |
|---|---|
| CZT HV Monitor | 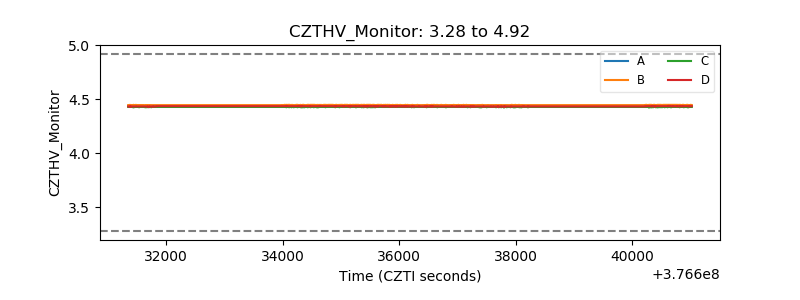 |
| D_VDD | 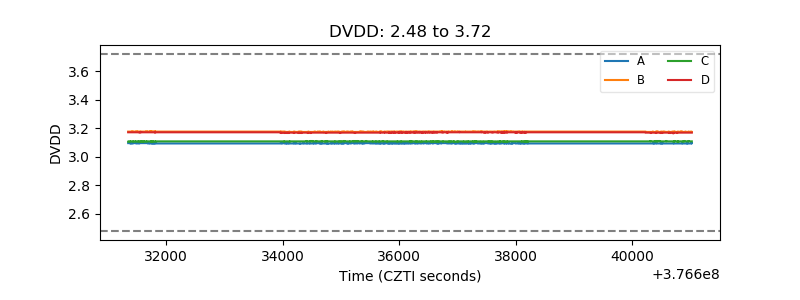 |
| Temperature 1 | 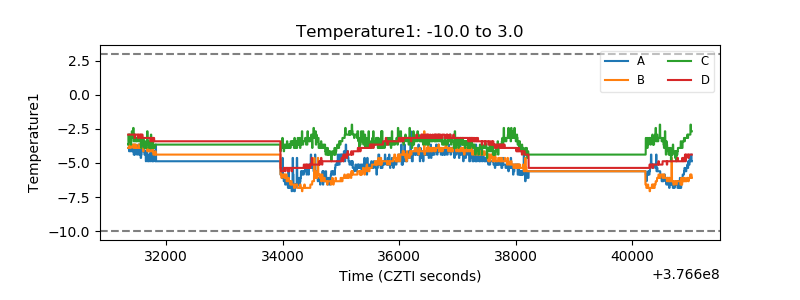 |
| Veto HV Monitor | 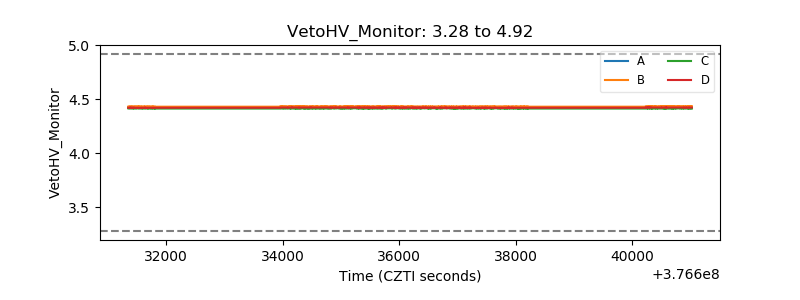 |
| Veto LLD | 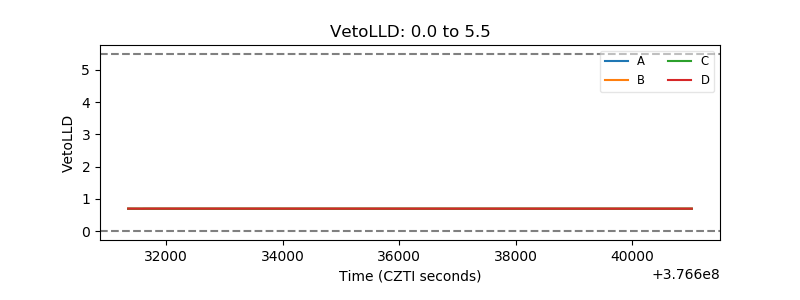 |
| Alpha Counter | 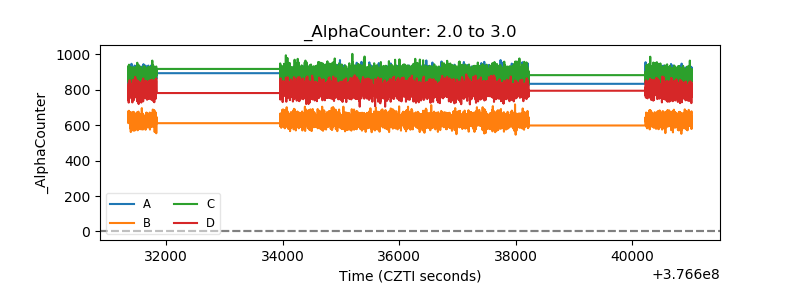 |
| _CPM_Rate | 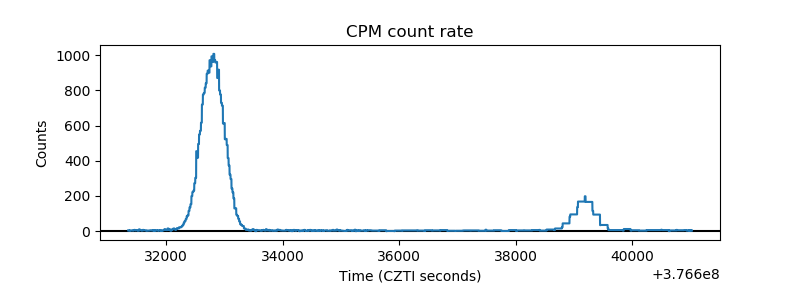 |
| CZT Counter | 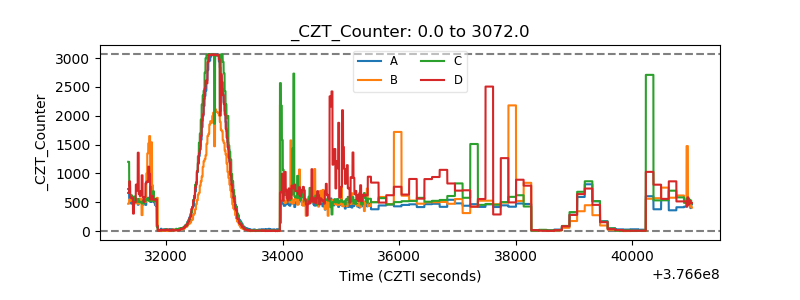 |
| +2.5 Volts monitor |  |
| +5 Volts monitor |  |
| _ROLL_ROT | 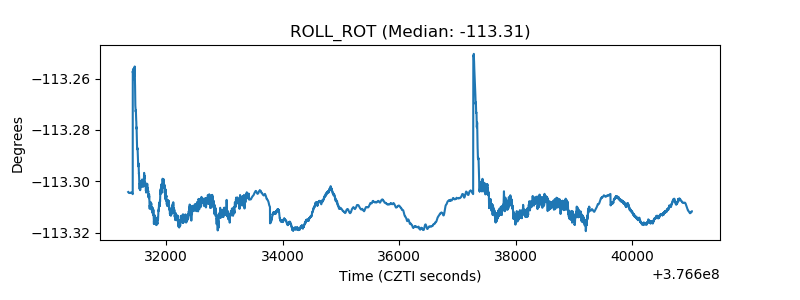 |
| _Roll_DEC | 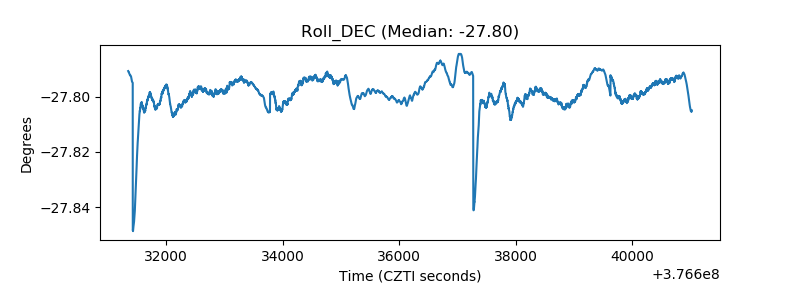 |
| _Roll_RA | 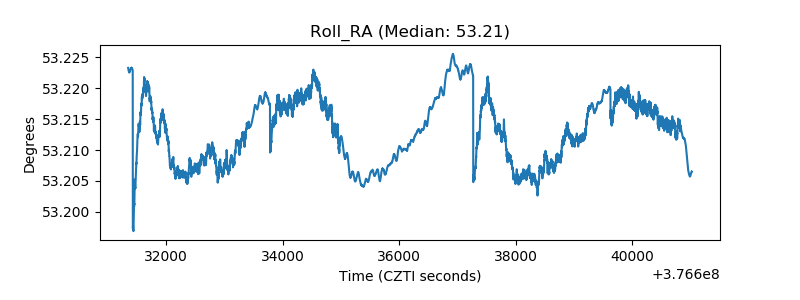 |
| Veto Counter | 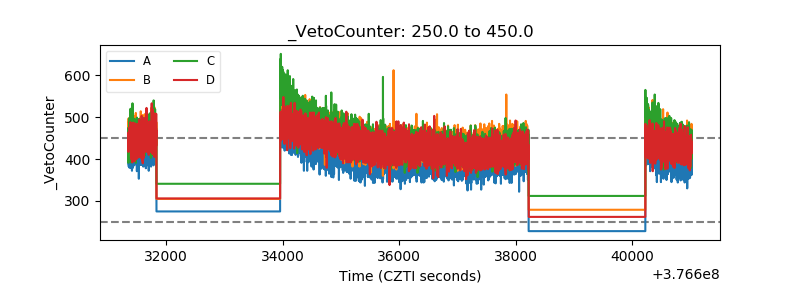 |