| Param | Original file | Final file |
|---|---|---|
| Filename | modeM0/AS1A11_060T01_9000004804_33499cztM0_level2.evt | modeM0/AS1A11_060T01_9000004804_33499cztM0_level2_quad_clean.evt |
| Size (bytes) | 443,180,160 | 58,694,400 |
| Size | 422.6 MB | 56.0 MB |
| Events in quadrant A | 2,482,903 | 353,211 |
| Events in quadrant B | 3,341,203 | 351,667 |
| Events in quadrant C | 3,155,379 | 354,342 |
| Events in quadrant D | 4,074,652 | 338,593 |
| Mode M9 | |||
|---|---|---|---|
| Quadrant | BADHDUFLAG | Total packets | Discarded packets |
| A | 0 | 29 | 0 |
| B | 0 | 29 | 0 |
| C | 0 | 29 | 0 |
| D | 0 | 30 | 0 |
| Mode M0 | |||
|---|---|---|---|
| Quadrant | BADHDUFLAG | Total packets | Discarded packets |
| A | 0 | 10882 | 2 |
| B | 0 | 13318 | 1 |
| C | 0 | 12376 | 1 |
| D | 0 | 15812 | 1 |
| Mode SS | |||
|---|---|---|---|
| Quadrant | BADHDUFLAG | Total packets | Discarded packets |
| A | 0 | 108 | 0 |
| B | 0 | 108 | 0 |
| C | 0 | 108 | 0 |
| D | 0 | 108 | 0 |
| Quadrant | Total seconds | Saturated seconds | Saturation percentage |
|---|---|---|---|
| A | 5424 | 6 | 0.110619% |
| B | 5424 | 166 | 3.060472% |
| C | 5424 | 90 | 1.659292% |
| D | 5424 | 101 | 1.862094% |
Noise dominated data is calculated using 1-second bins in cleaned event files. If a bin has >2000 counts, and if more than 50% of those come from <1% of pixels, then it is considered to be noise-dominated and hence unusable.
| Quadrant | # 1 sec bins | Bins with >0 counts | Bins with >2000 counts | High rate bins dominated by noise | Noise dominated (total time) | Noise dominated (detector-on time) | Marked lightcurve |
|---|---|---|---|---|---|---|---|
| A | 7098 | 5425 | 0 | 0 | 0.00% | 0.00% | 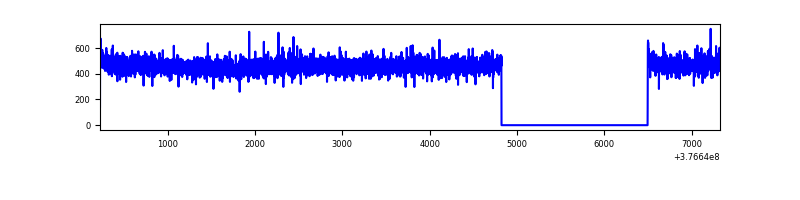 |
| B | 7098 | 5425 | 109 | 109 | 1.54% | 2.01% | 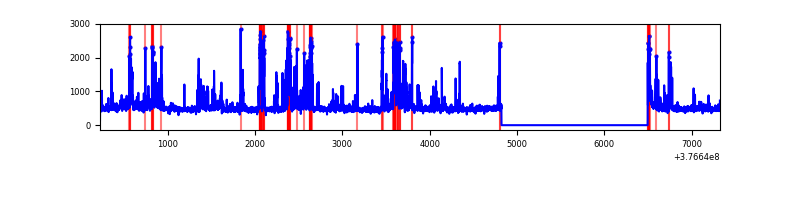 |
| C | 7098 | 5425 | 72 | 72 | 1.01% | 1.33% | 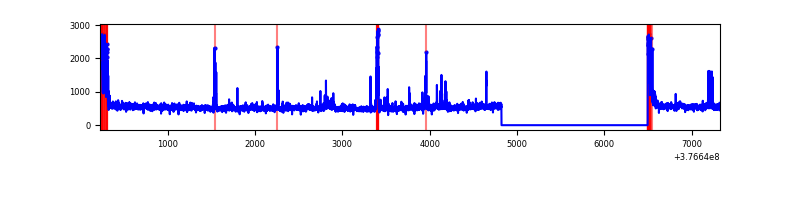 |
| D | 7098 | 5425 | 89 | 89 | 1.25% | 1.64% | 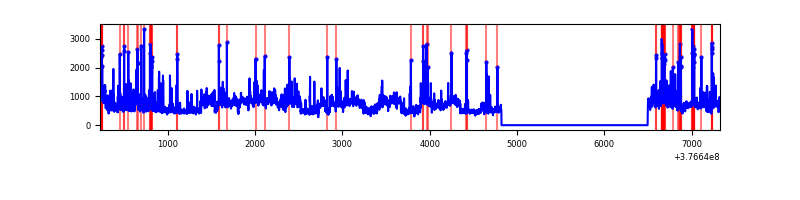 |
Top three noisy pixels from each quadrant. If the there are fewer than three noisy pixels in the level2.evt file, extra rows are filled as -1
| Pixel properties | Quadrant properties | ||||||
|---|---|---|---|---|---|---|---|
| Quadrant | DetID | PixID | Counts | Sigma | Mean | Median | Sigma |
| A | 13 | 254 | 8228 | 59.06 | 641 | 630 | 128.7 |
| A | 3 | 137 | 6469 | 45.39 | 641 | 630 | 128.7 |
| A | 10 | 83 | 5715 | 39.52 | 641 | 630 | 128.7 |
| B | 5 | 172 | 600164 | 4905.35 | 635 | 618 | 122.2 |
| B | 5 | 255 | 207561 | 1693.16 | 635 | 618 | 122.2 |
| B | 4 | 170 | 16871 | 132.98 | 635 | 618 | 122.2 |
| C | 0 | 10 | 245693 | 1688.53 | 627 | 633 | 145.1 |
| C | 15 | 214 | 232612 | 1598.4 | 627 | 633 | 145.1 |
| C | 4 | 254 | 83810 | 573.11 | 627 | 633 | 145.1 |
| D | 8 | 195 | 1053644 | 6910.09 | 622 | 605 | 152.4 |
| D | 2 | 250 | 312730 | 2048.18 | 622 | 605 | 152.4 |
| D | 2 | 249 | 83856 | 546.29 | 622 | 605 | 152.4 |
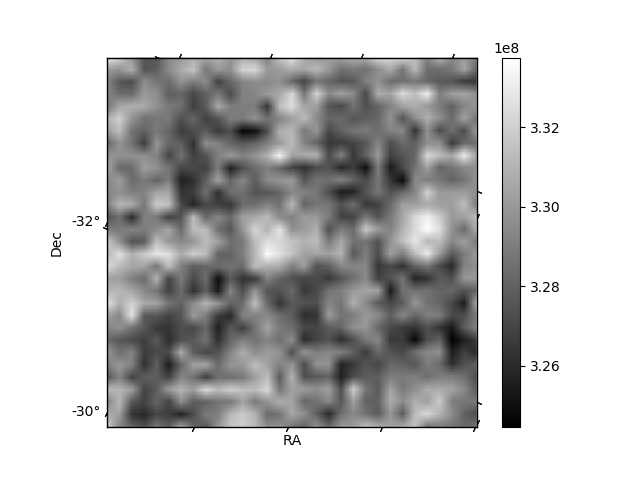
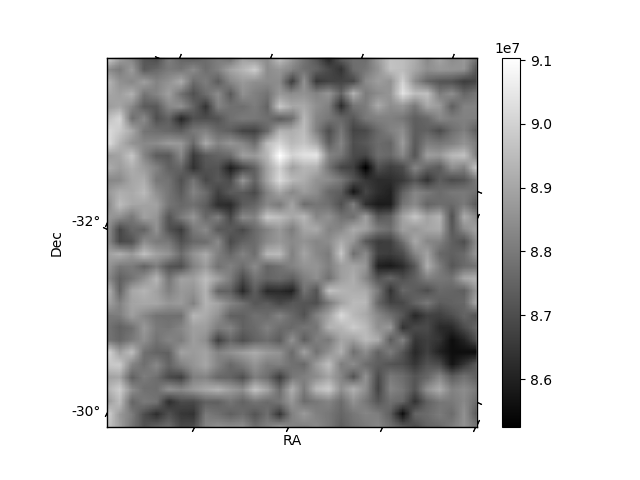
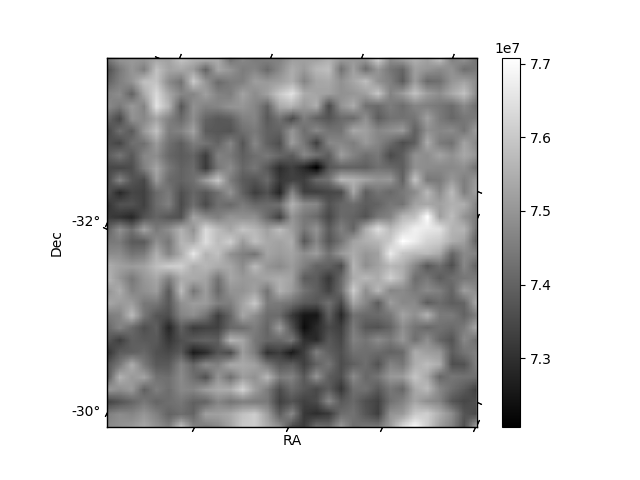
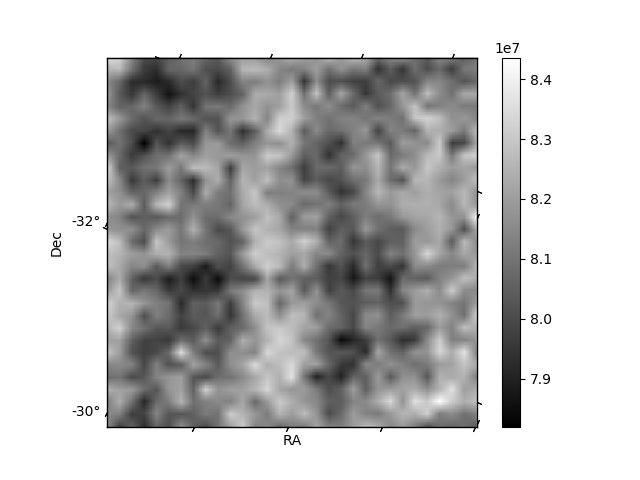
Histogram calculated using DETX and DETY for each event in the final _common_clean file
| Quadrant A | 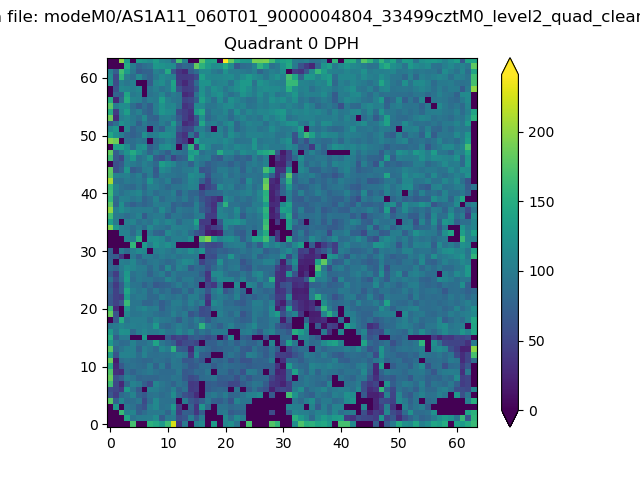 |
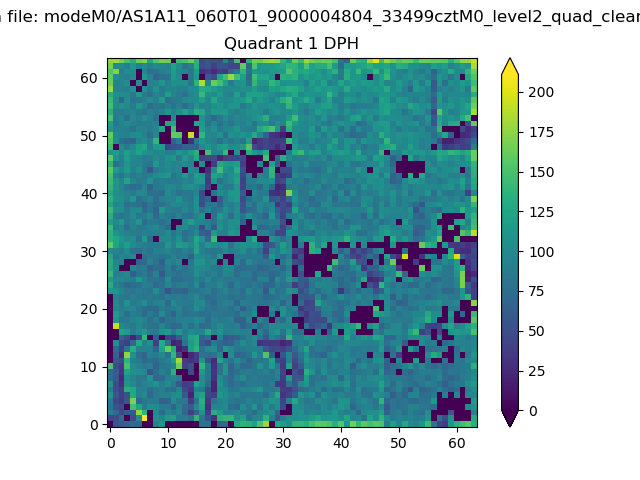 |
Quadrant B |
|---|---|---|---|
| Quadrant D |  |
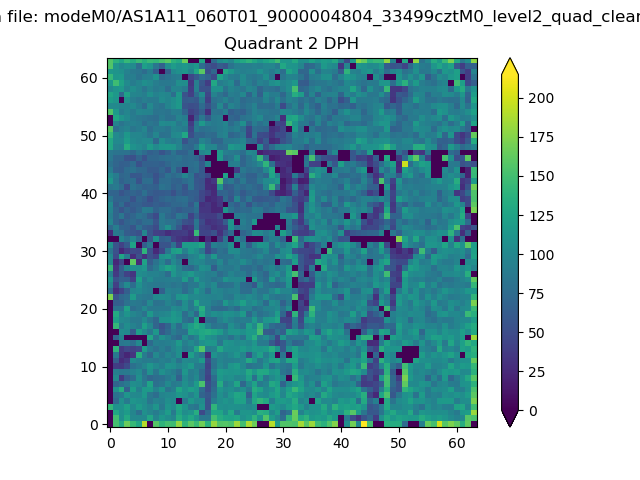 |
Quadrant C |
| Plot type | Count rate plots | Images |
|---|---|---|
| Comparison with Poisson distribution Blue bars denote a histogram of data divided into 1 sec bins. Red curve is a Poisson curve with rate = median count rate of data. |
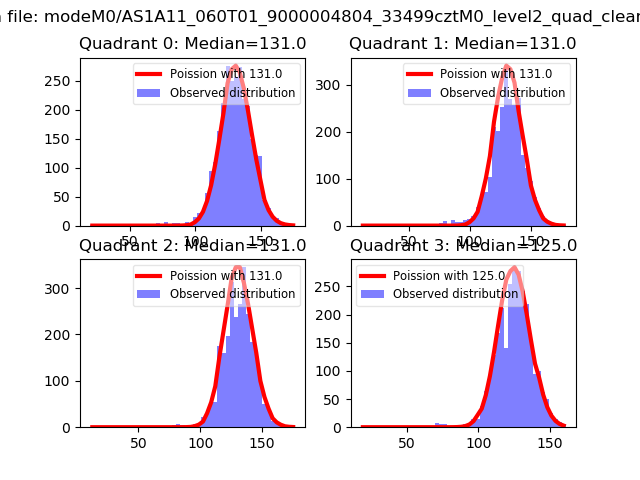 |
 |
| Quadrant-wise count rates Data is divided into 100 sec bins |
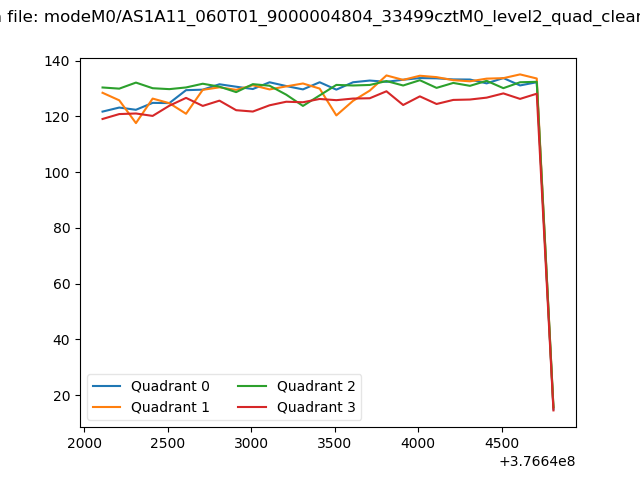 |
|
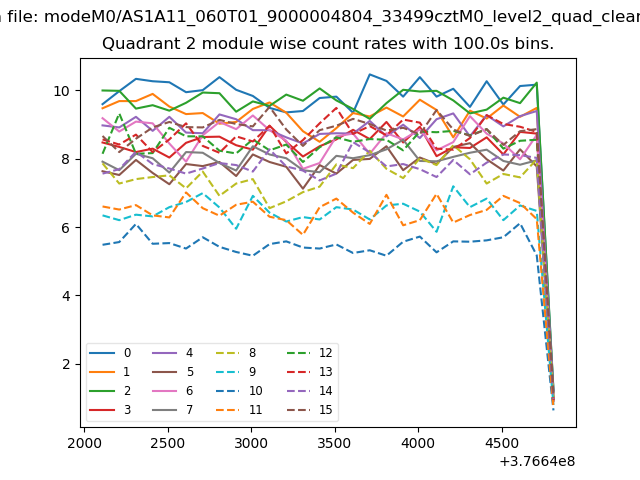
| Module-wise count rates for Quadrant A Data is divided into 100 sec bins |
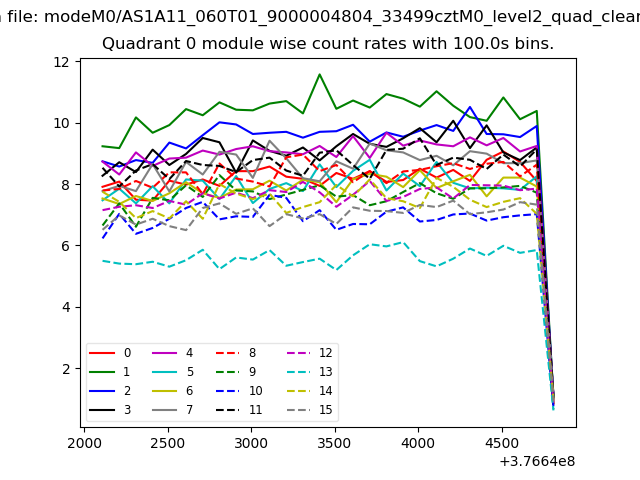 |
 |
| Module-wise count rates for Quadrant B Data is divided into 100 sec bins |
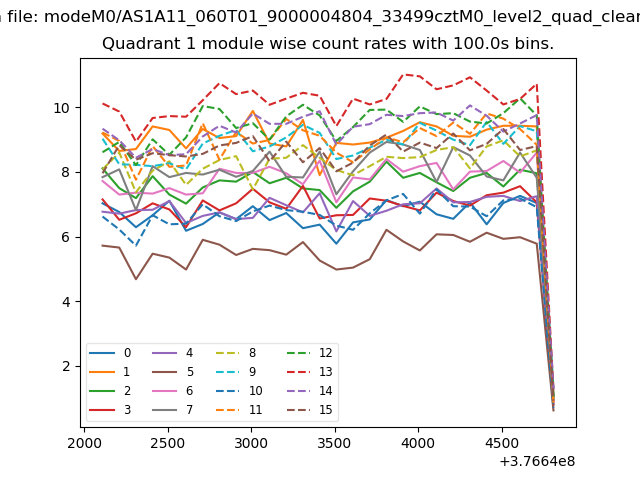 |
 |
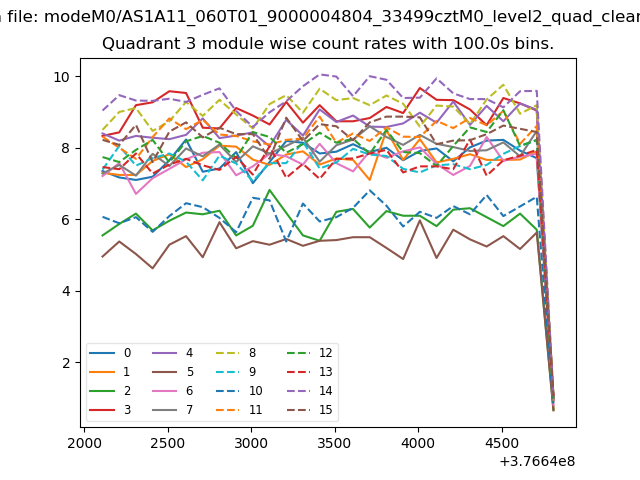
| Module-wise count rates for Quadrant C Data is divided into 100 sec bins |
 |
 |
| Module-wise count rates for Quadrant D Data is divided into 100 sec bins |
 |
 |
| Parameter | Plot |
|---|---|
| CZT HV Monitor | 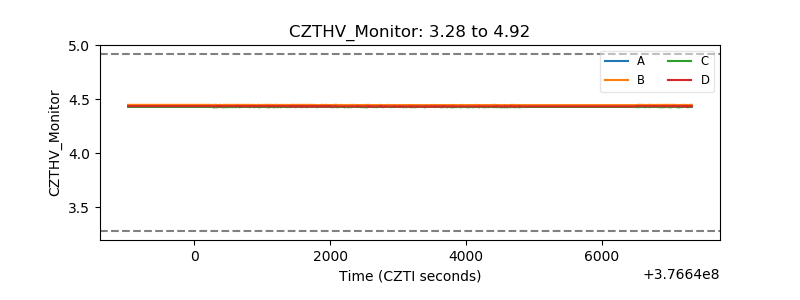 |
| D_VDD | 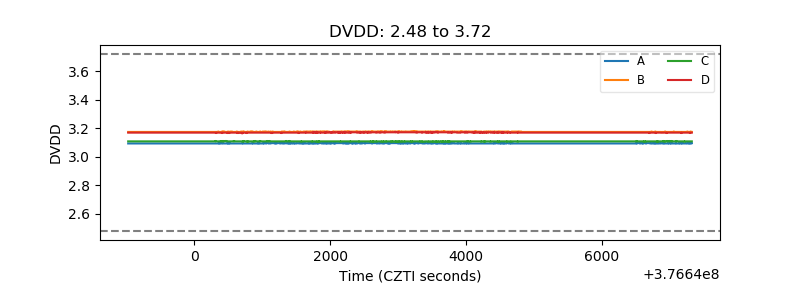 |
| Temperature 1 | 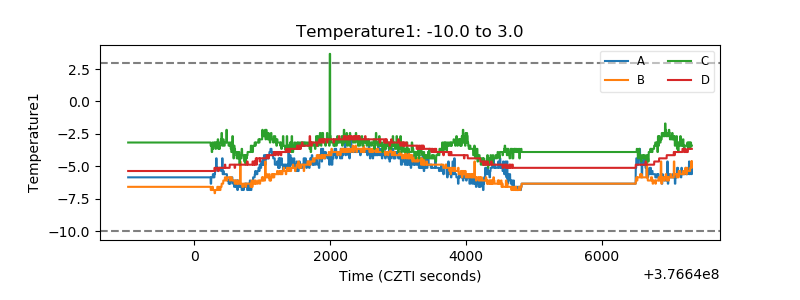 |
| Veto HV Monitor | 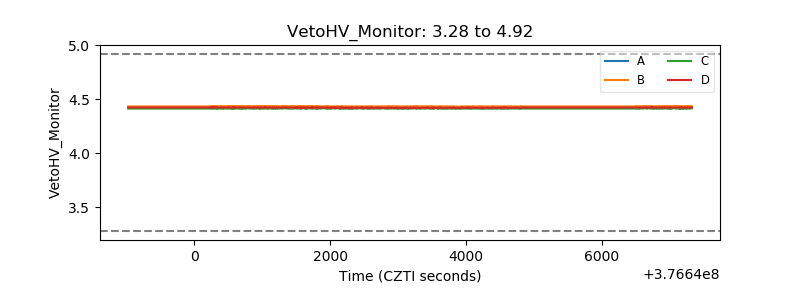 |
| Veto LLD | 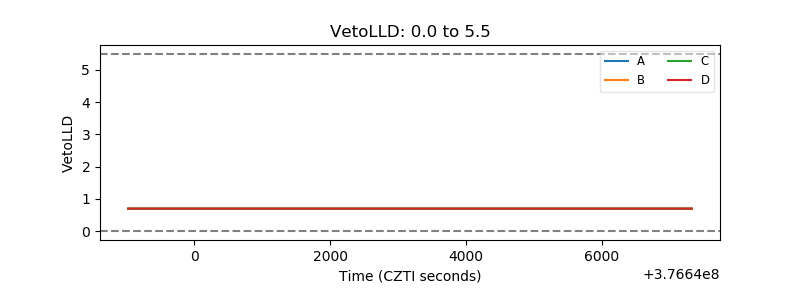 |
| Alpha Counter | 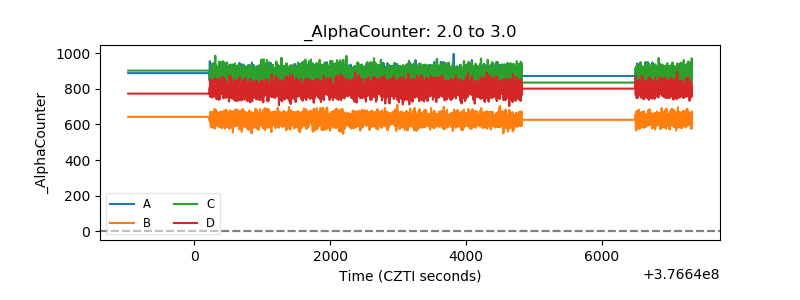 |
| _CPM_Rate | 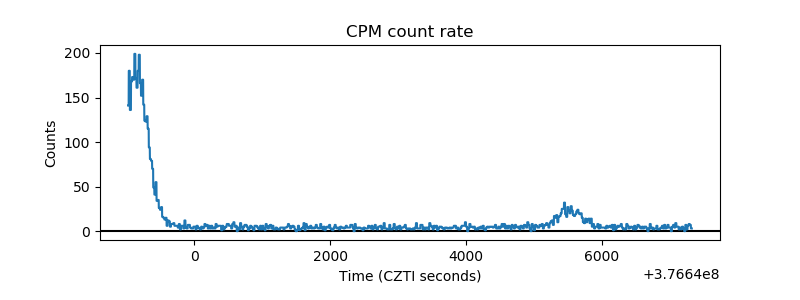 |
| CZT Counter | 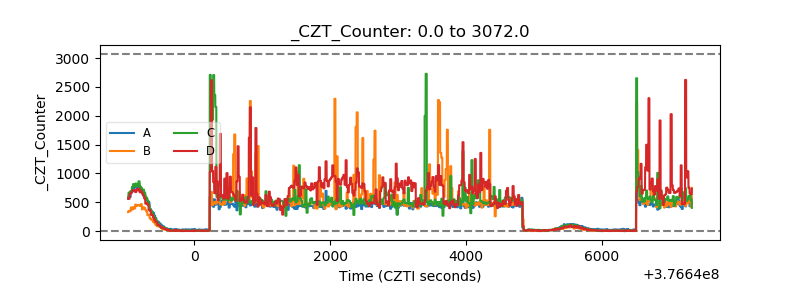 |
| +2.5 Volts monitor |  |
| +5 Volts monitor |  |
| _ROLL_ROT | 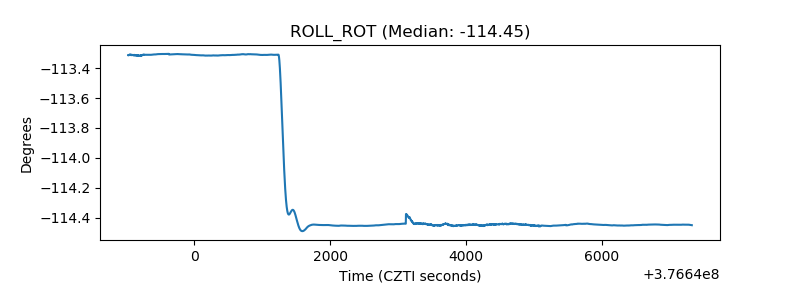 |
| _Roll_DEC | 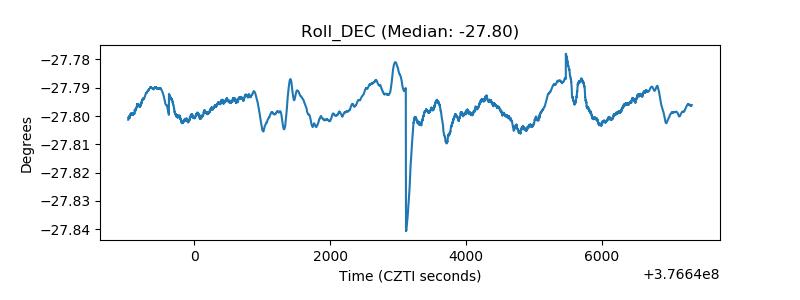 |
| _Roll_RA | 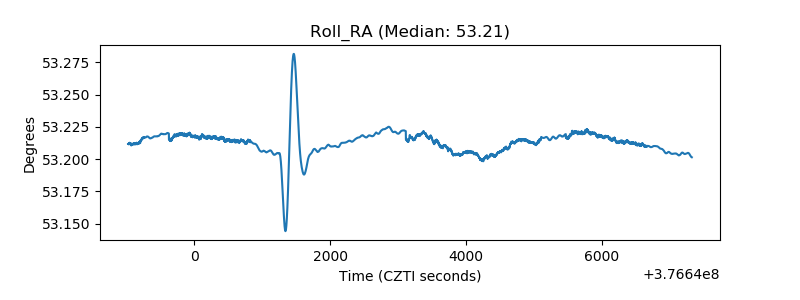 |
| Veto Counter | 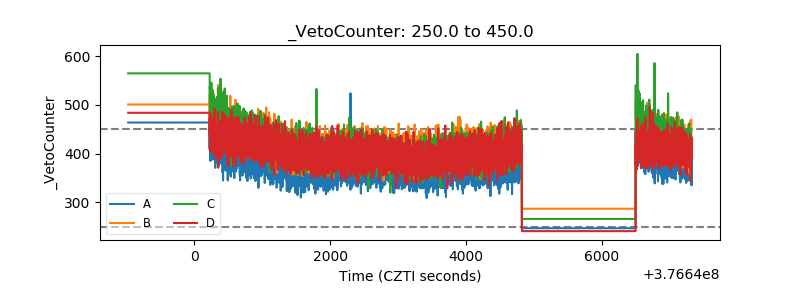 |