| Param | Original file | Final file |
|---|---|---|
| Filename | modeM0/AS1A11_060T01_9000004804_33500cztM0_level2.evt | modeM0/AS1A11_060T01_9000004804_33500cztM0_level2_quad_clean.evt |
| Size (bytes) | 570,755,520 | 74,278,080 |
| Size | 544.3 MB | 70.8 MB |
| Events in quadrant A | 2,729,028 | 471,011 |
| Events in quadrant B | 3,575,481 | 468,038 |
| Events in quadrant C | 6,358,451 | 443,690 |
| Events in quadrant D | 4,216,596 | 447,196 |
| Mode M9 | |||
|---|---|---|---|
| Quadrant | BADHDUFLAG | Total packets | Discarded packets |
| A | 0 | 31 | 0 |
| B | 0 | 31 | 0 |
| C | 0 | 31 | 0 |
| D | 0 | 31 | 0 |
| Mode M0 | |||
|---|---|---|---|
| Quadrant | BADHDUFLAG | Total packets | Discarded packets |
| A | 0 | 12033 | 3 |
| B | 0 | 14355 | 2 |
| C | 0 | 22974 | 2 |
| D | 0 | 16850 | 2 |
| Mode SS | |||
|---|---|---|---|
| Quadrant | BADHDUFLAG | Total packets | Discarded packets |
| A | 0 | 124 | 0 |
| B | 0 | 124 | 0 |
| C | 0 | 124 | 0 |
| D | 0 | 124 | 0 |
| Quadrant | Total seconds | Saturated seconds | Saturation percentage |
|---|---|---|---|
| A | 6000 | 6 | 0.100000% |
| B | 6000 | 174 | 2.900000% |
| C | 6000 | 416 | 6.933333% |
| D | 6000 | 116 | 1.933333% |
Noise dominated data is calculated using 1-second bins in cleaned event files. If a bin has >2000 counts, and if more than 50% of those come from <1% of pixels, then it is considered to be noise-dominated and hence unusable.
| Quadrant | # 1 sec bins | Bins with >0 counts | Bins with >2000 counts | High rate bins dominated by noise | Noise dominated (total time) | Noise dominated (detector-on time) | Marked lightcurve |
|---|---|---|---|---|---|---|---|
| A | 9077 | 6002 | 0 | 0 | 0.00% | 0.00% | 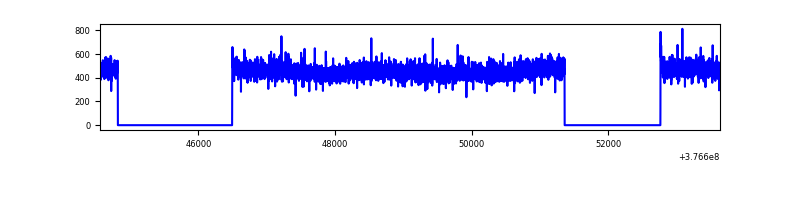 |
| B | 9077 | 6002 | 115 | 115 | 1.27% | 1.92% | 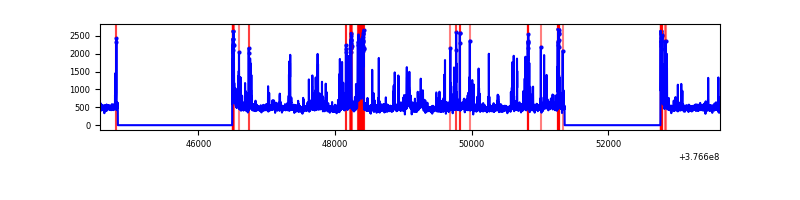 |
| C | 9076 | 6001 | 460 | 460 | 5.07% | 7.67% | 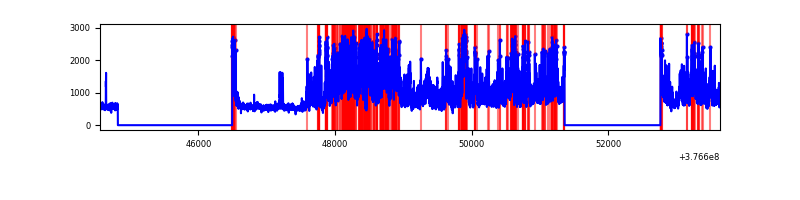 |
| D | 9077 | 6002 | 103 | 103 | 1.13% | 1.72% | 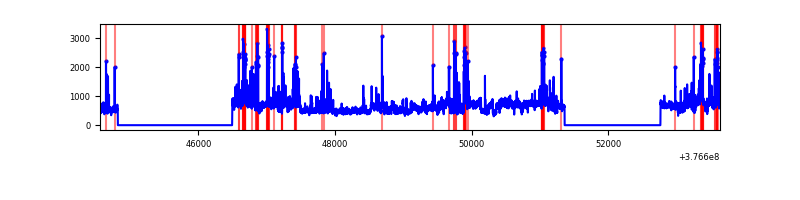 |
Top three noisy pixels from each quadrant. If the there are fewer than three noisy pixels in the level2.evt file, extra rows are filled as -1
| Pixel properties | Quadrant properties | ||||||
|---|---|---|---|---|---|---|---|
| Quadrant | DetID | PixID | Counts | Sigma | Mean | Median | Sigma |
| A | 13 | 254 | 10548 | 69.75 | 705 | 691 | 141.3 |
| A | 3 | 137 | 7296 | 46.74 | 705 | 691 | 141.3 |
| A | 0 | 226 | 5940 | 37.14 | 705 | 691 | 141.3 |
| B | 5 | 172 | 585213 | 4353.56 | 697 | 678 | 134.3 |
| B | 5 | 255 | 186930 | 1387.19 | 697 | 678 | 134.3 |
| B | 4 | 170 | 28521 | 207.37 | 697 | 678 | 134.3 |
| C | 4 | 254 | 3169114 | 20134.54 | 676 | 681 | 157.4 |
| C | 15 | 214 | 258540 | 1638.62 | 676 | 681 | 157.4 |
| C | 0 | 10 | 140347 | 887.54 | 676 | 681 | 157.4 |
| D | 8 | 195 | 976820 | 5831.41 | 682 | 663 | 167.4 |
| D | 2 | 250 | 248769 | 1482.15 | 682 | 663 | 167.4 |
| D | 13 | 249 | 143368 | 852.5 | 682 | 663 | 167.4 |
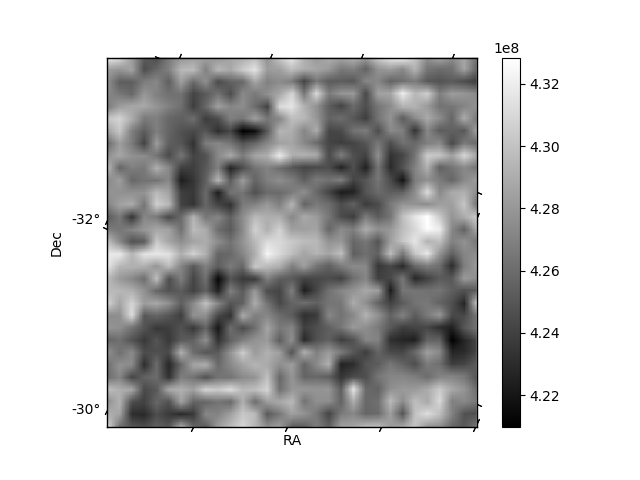
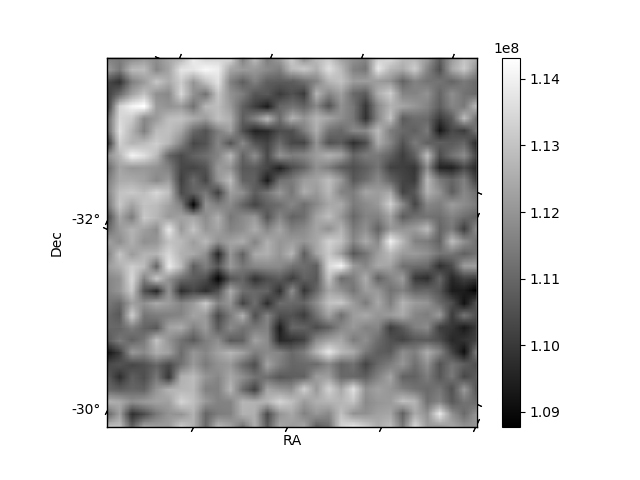
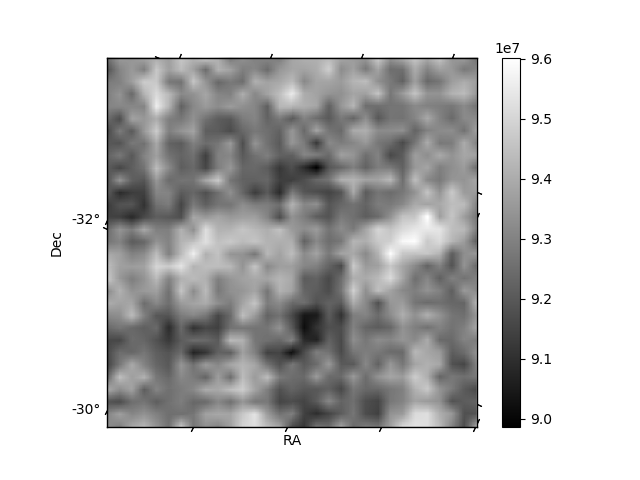
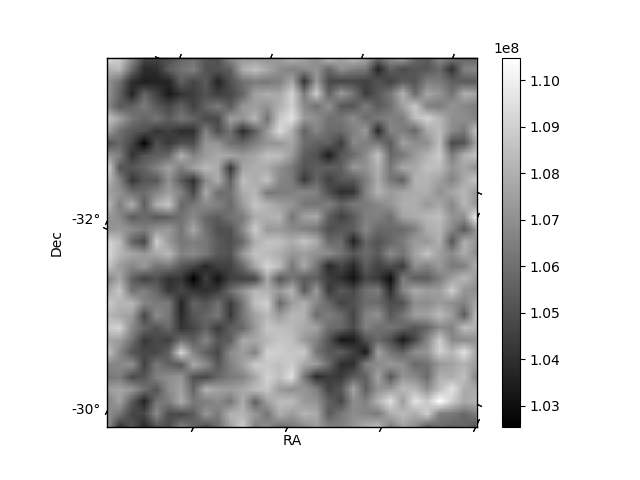
Histogram calculated using DETX and DETY for each event in the final _common_clean file
| Quadrant A | 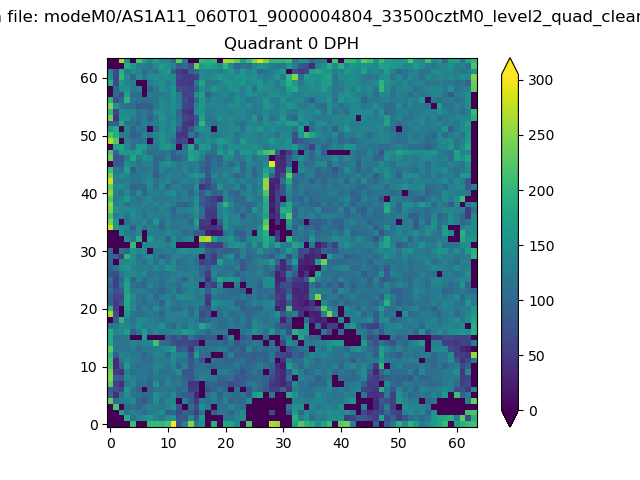 |
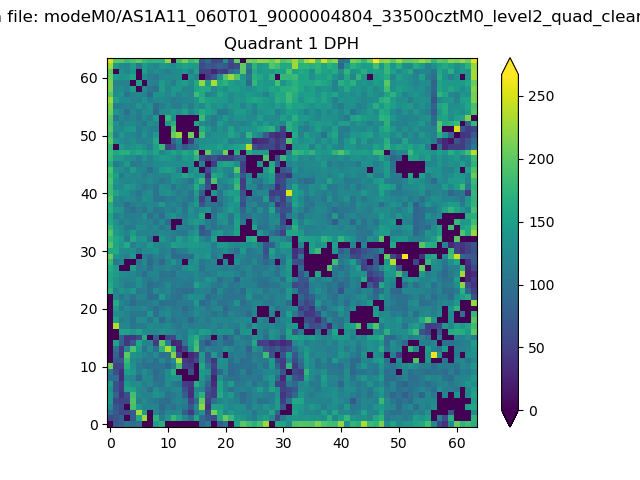 |
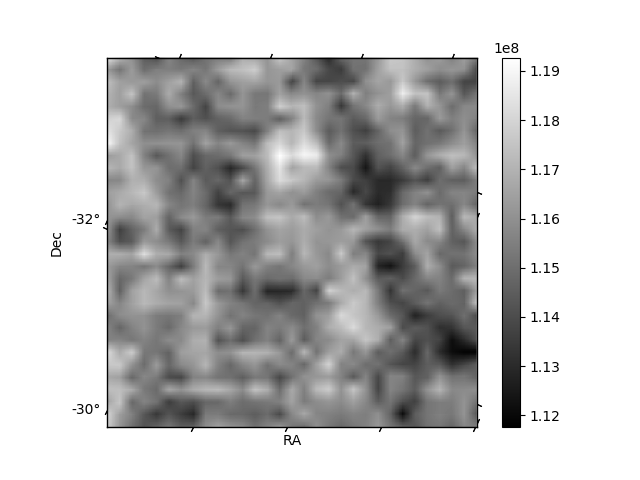
Quadrant B |
|---|---|---|---|
| Quadrant D | 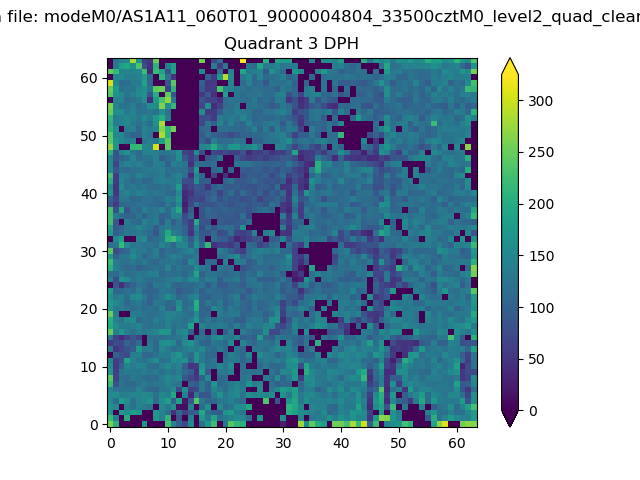 |
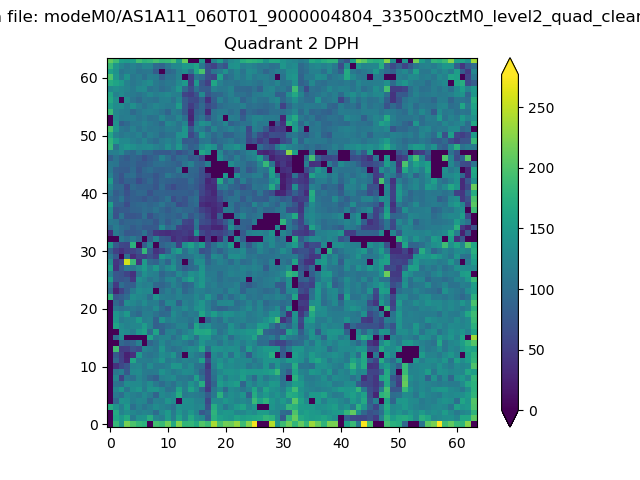 |
Quadrant C |
| Plot type | Count rate plots | Images |
|---|---|---|
| Comparison with Poisson distribution Blue bars denote a histogram of data divided into 1 sec bins. Red curve is a Poisson curve with rate = median count rate of data. |
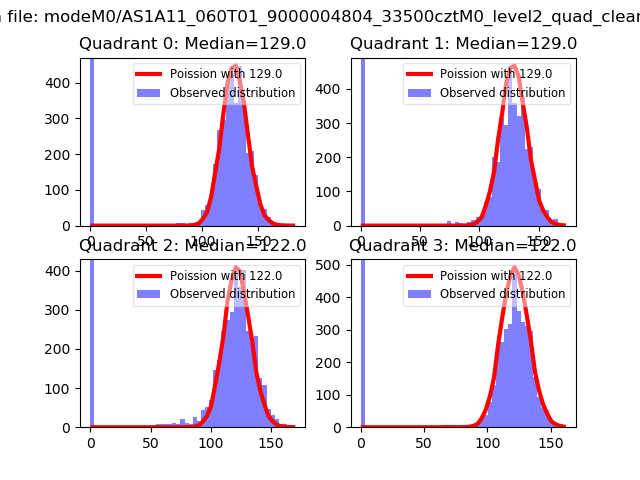 |
 |
| Quadrant-wise count rates Data is divided into 100 sec bins |
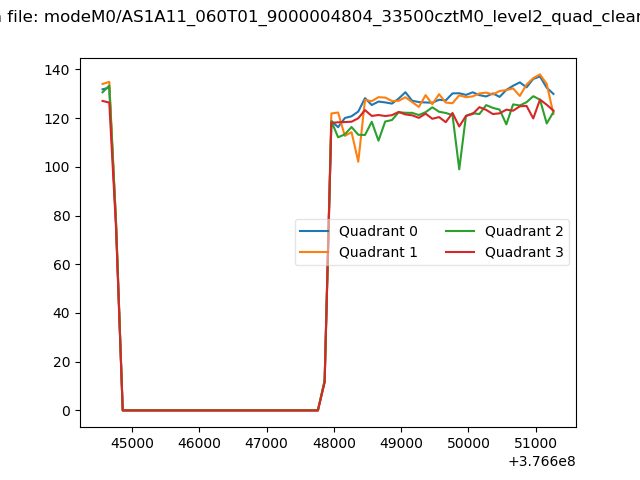 |
|
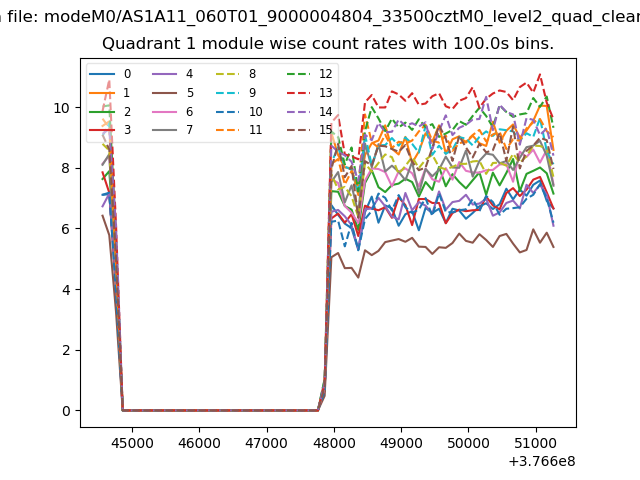
| Module-wise count rates for Quadrant A Data is divided into 100 sec bins |
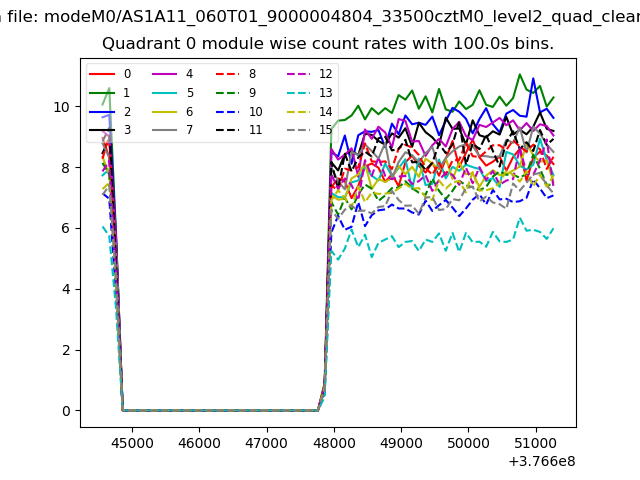 |
 |
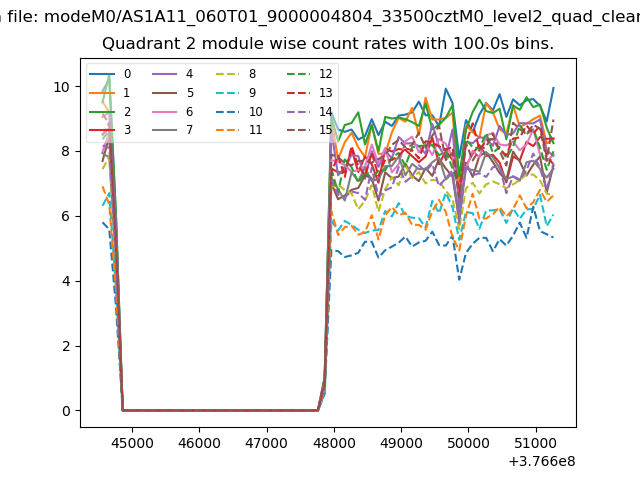
| Module-wise count rates for Quadrant B Data is divided into 100 sec bins |
 |
 |
| Module-wise count rates for Quadrant C Data is divided into 100 sec bins |
 |
 |
| Module-wise count rates for Quadrant D Data is divided into 100 sec bins |
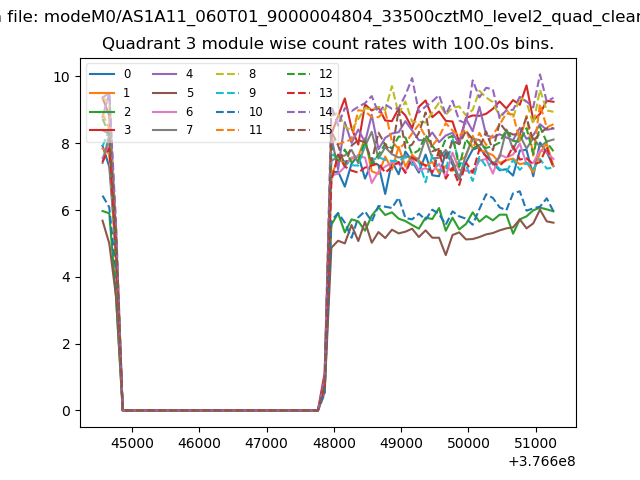 |
 |
| Parameter | Plot |
|---|---|
| CZT HV Monitor | 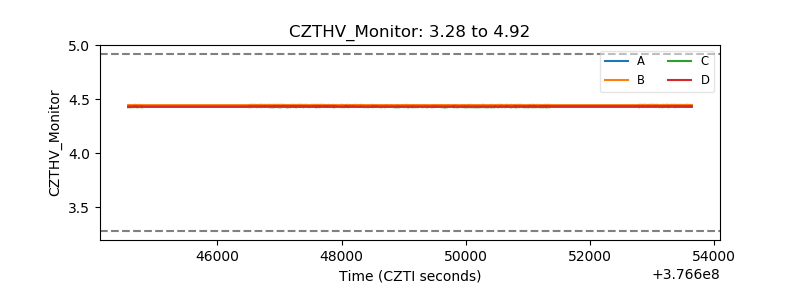 |
| D_VDD | 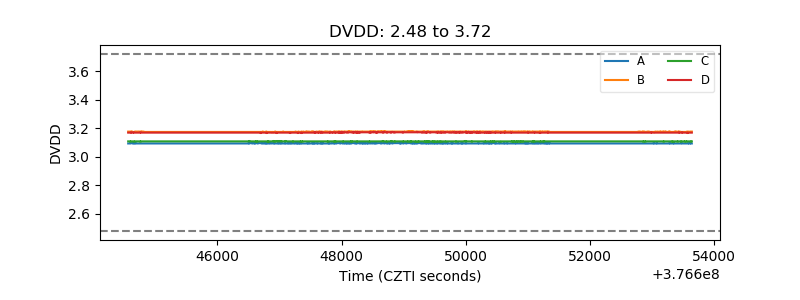 |
| Temperature 1 | 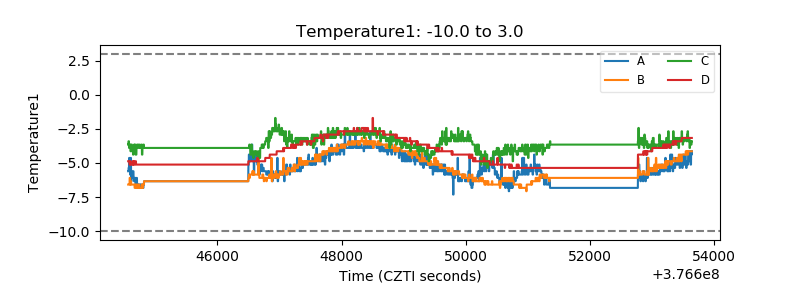 |
| Veto HV Monitor | 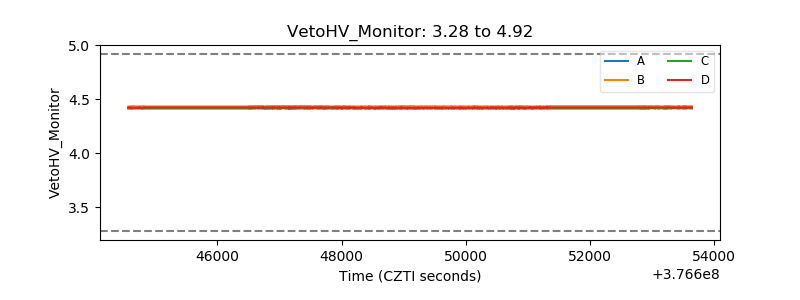 |
| Veto LLD | 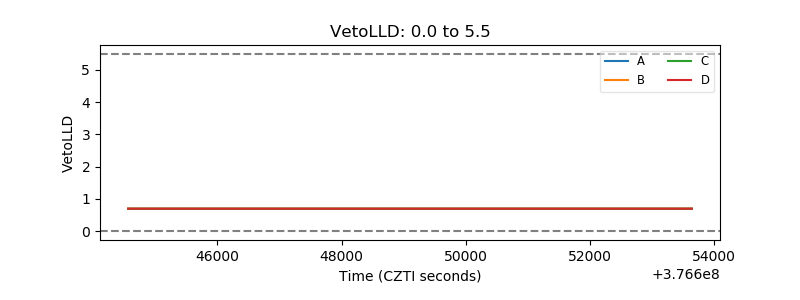 |
| Alpha Counter | 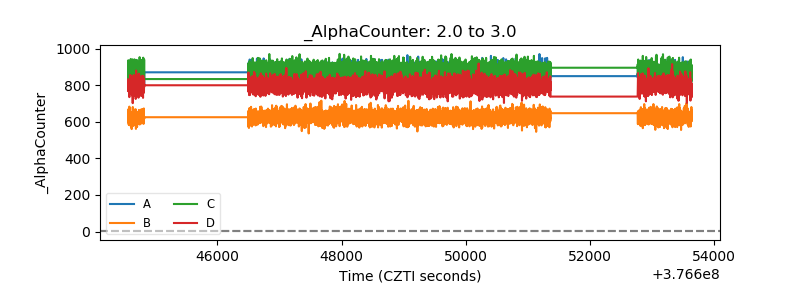 |
| _CPM_Rate | 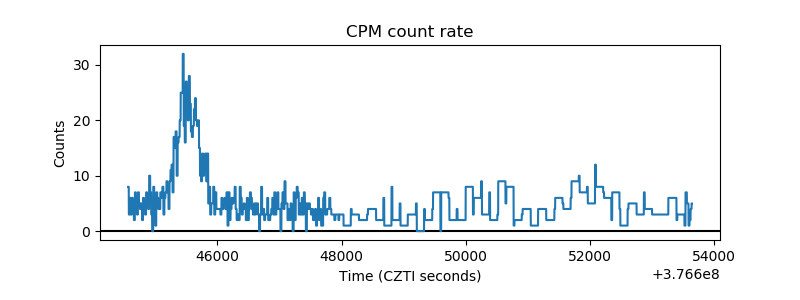 |
| CZT Counter | 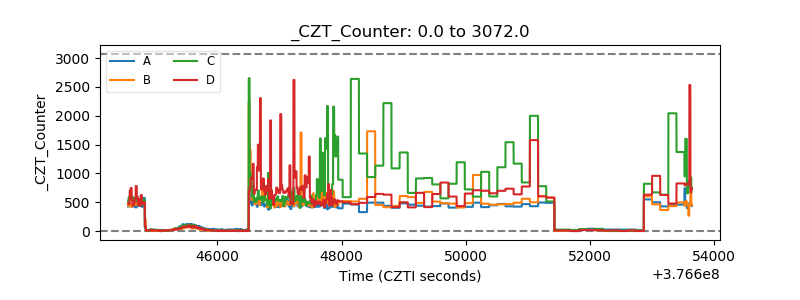 |
| +2.5 Volts monitor |  |
| +5 Volts monitor |  |
| _ROLL_ROT | 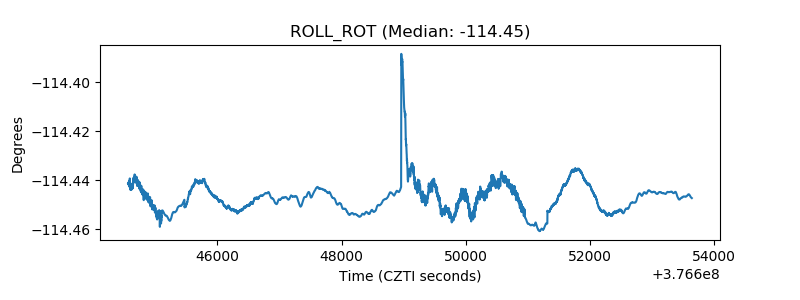 |
| _Roll_DEC | 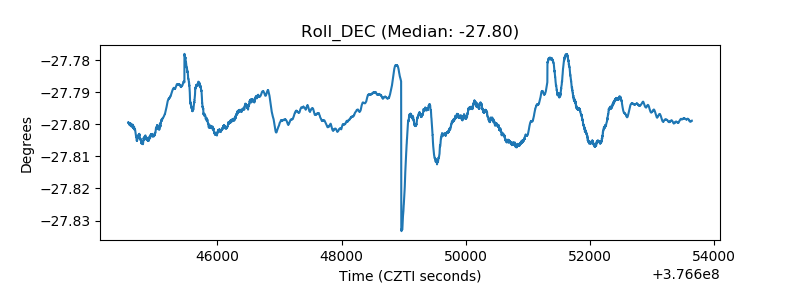 |
| _Roll_RA | 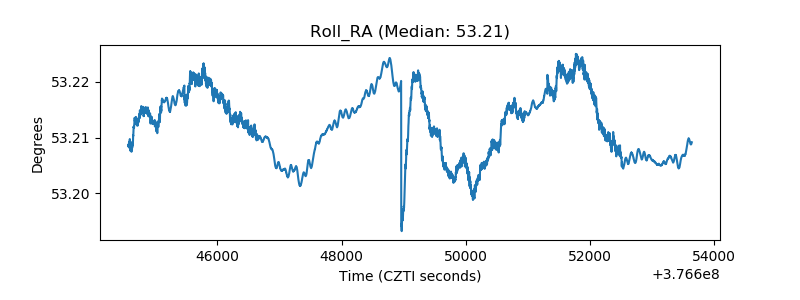 |
| Veto Counter | 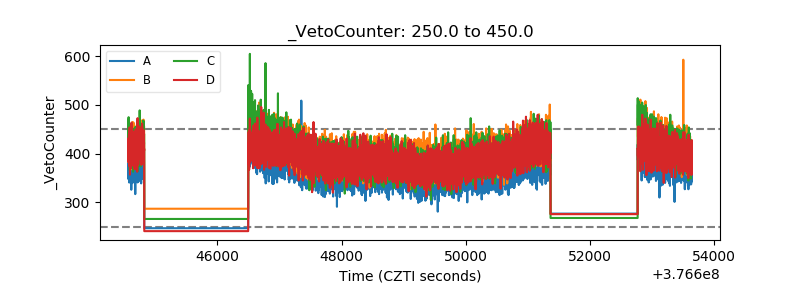 |