| Param | Original file | Final file |
|---|---|---|
| Filename | modeM0/AS1A11_060T01_9000004804_33501cztM0_level2.evt | modeM0/AS1A11_060T01_9000004804_33501cztM0_level2_quad_clean.evt |
| Size (bytes) | 535,726,080 | 78,356,160 |
| Size | 510.9 MB | 74.7 MB |
| Events in quadrant A | 2,717,588 | 501,586 |
| Events in quadrant B | 3,428,679 | 495,323 |
| Events in quadrant C | 5,437,675 | 484,700 |
| Events in quadrant D | 4,237,547 | 475,284 |
| Mode M9 | |||
|---|---|---|---|
| Quadrant | BADHDUFLAG | Total packets | Discarded packets |
| A | 0 | 24 | 0 |
| B | 0 | 24 | 0 |
| C | 0 | 24 | 0 |
| D | 0 | 25 | 0 |
| Mode M0 | |||
|---|---|---|---|
| Quadrant | BADHDUFLAG | Total packets | Discarded packets |
| A | 0 | 11962 | 3 |
| B | 0 | 13966 | 2 |
| C | 0 | 20262 | 2 |
| D | 0 | 16665 | 2 |
| Mode SS | |||
|---|---|---|---|
| Quadrant | BADHDUFLAG | Total packets | Discarded packets |
| A | 0 | 120 | 0 |
| B | 0 | 120 | 0 |
| C | 0 | 120 | 0 |
| D | 0 | 120 | 0 |
| Quadrant | Total seconds | Saturated seconds | Saturation percentage |
|---|---|---|---|
| A | 5957 | 6 | 0.100722% |
| B | 5957 | 172 | 2.887359% |
| C | 5957 | 257 | 4.314252% |
| D | 5957 | 100 | 1.678697% |
Noise dominated data is calculated using 1-second bins in cleaned event files. If a bin has >2000 counts, and if more than 50% of those come from <1% of pixels, then it is considered to be noise-dominated and hence unusable.
| Quadrant | # 1 sec bins | Bins with >0 counts | Bins with >2000 counts | High rate bins dominated by noise | Noise dominated (total time) | Noise dominated (detector-on time) | Marked lightcurve |
|---|---|---|---|---|---|---|---|
| A | 7239 | 5958 | 0 | 0 | 0.00% | 0.00% |  |
| B | 7239 | 5958 | 124 | 124 | 1.71% | 2.08% | 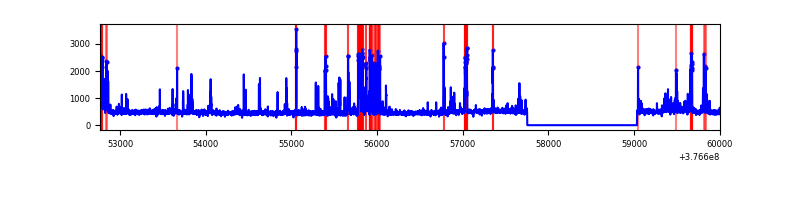 |
| C | 7239 | 5957 | 247 | 247 | 3.41% | 4.15% | 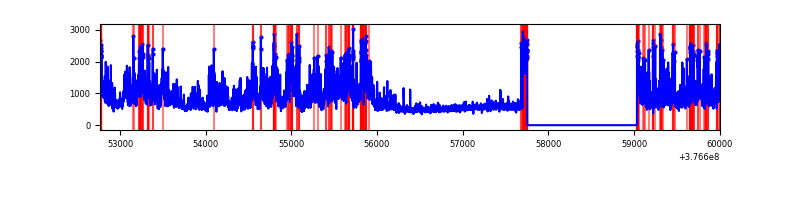 |
| D | 7239 | 5958 | 88 | 88 | 1.22% | 1.48% |  |
Top three noisy pixels from each quadrant. If the there are fewer than three noisy pixels in the level2.evt file, extra rows are filled as -1
| Pixel properties | Quadrant properties | ||||||
|---|---|---|---|---|---|---|---|
| Quadrant | DetID | PixID | Counts | Sigma | Mean | Median | Sigma |
| A | 13 | 6 | 10330 | 68.77 | 700 | 686 | 140.2 |
| A | 13 | 254 | 8956 | 58.97 | 700 | 686 | 140.2 |
| A | 3 | 137 | 7173 | 46.26 | 700 | 686 | 140.2 |
| B | 5 | 172 | 515260 | 3812.63 | 690 | 671 | 135.0 |
| B | 5 | 255 | 154858 | 1142.38 | 690 | 671 | 135.0 |
| B | 4 | 251 | 26065 | 188.15 | 690 | 671 | 135.0 |
| C | 4 | 254 | 2109992 | 13419.18 | 672 | 677 | 157.2 |
| C | 15 | 214 | 257337 | 1632.84 | 672 | 677 | 157.2 |
| C | 3 | 233 | 203812 | 1292.32 | 672 | 677 | 157.2 |
| D | 8 | 195 | 1015807 | 6064.07 | 678 | 659 | 167.4 |
| D | 2 | 250 | 269146 | 1603.83 | 678 | 659 | 167.4 |
| D | 13 | 249 | 158783 | 944.57 | 678 | 659 | 167.4 |
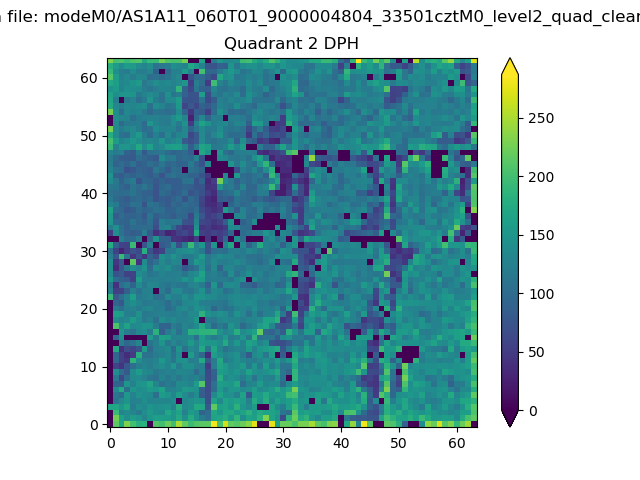
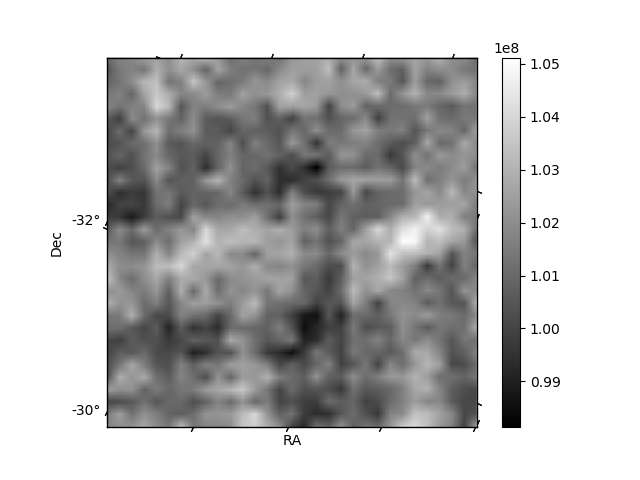
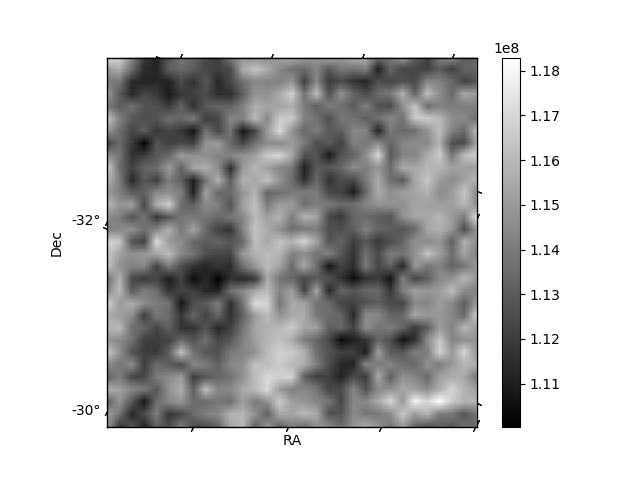
Histogram calculated using DETX and DETY for each event in the final _common_clean file
| Quadrant A | 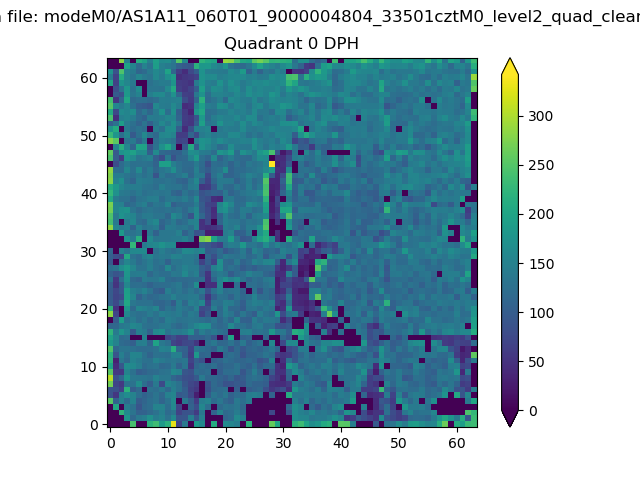 |
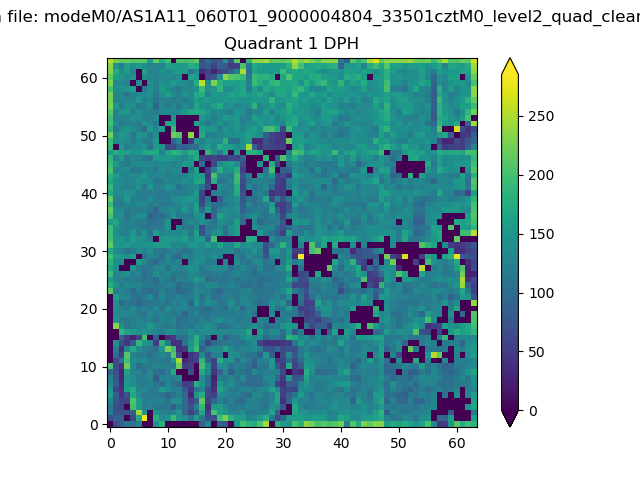 |
Quadrant B |
|---|---|---|---|
| Quadrant D | 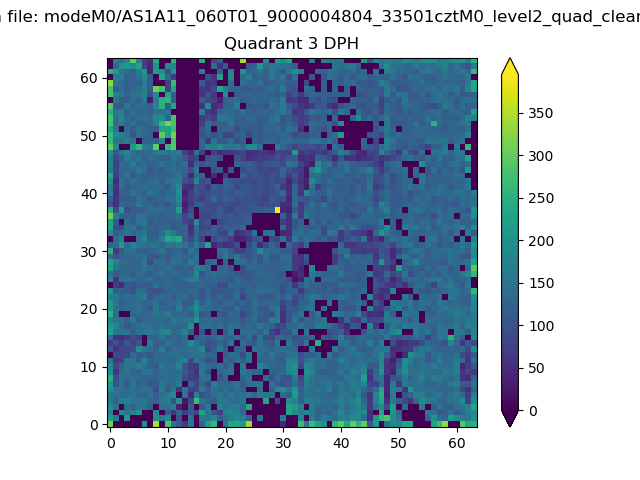 |
 |
Quadrant C |
| Plot type | Count rate plots | Images |
|---|---|---|
| Comparison with Poisson distribution Blue bars denote a histogram of data divided into 1 sec bins. Red curve is a Poisson curve with rate = median count rate of data. |
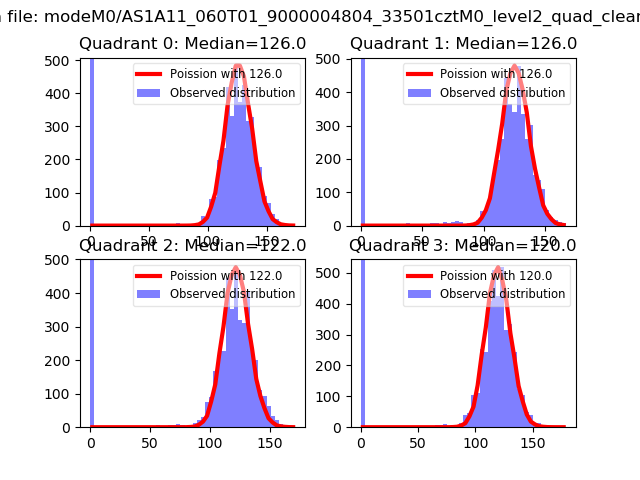 |
 |
| Quadrant-wise count rates Data is divided into 100 sec bins |
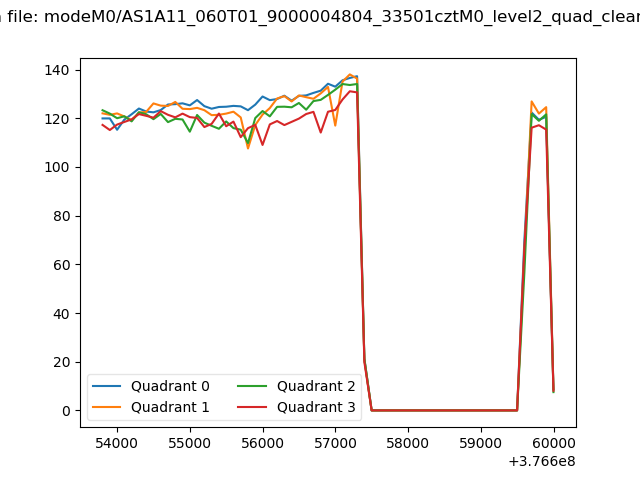 |
|
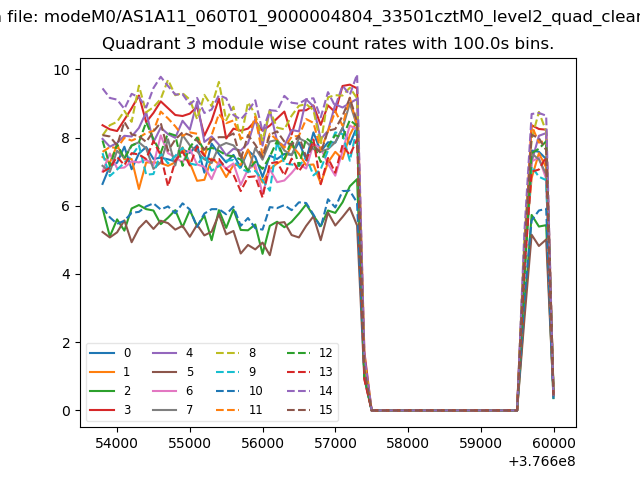
| Module-wise count rates for Quadrant A Data is divided into 100 sec bins |
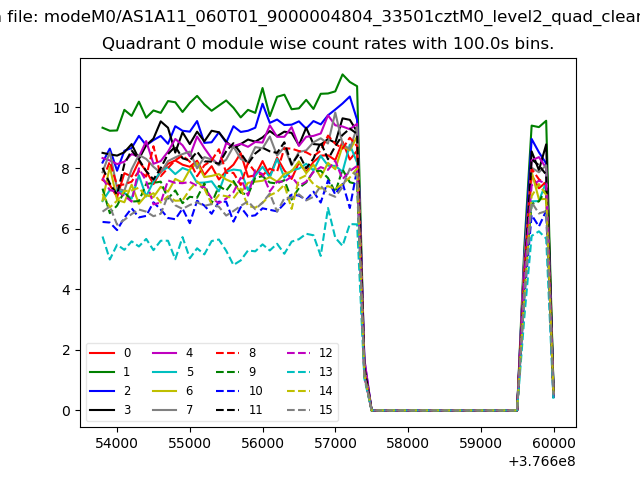 |
 |
| Module-wise count rates for Quadrant B Data is divided into 100 sec bins |
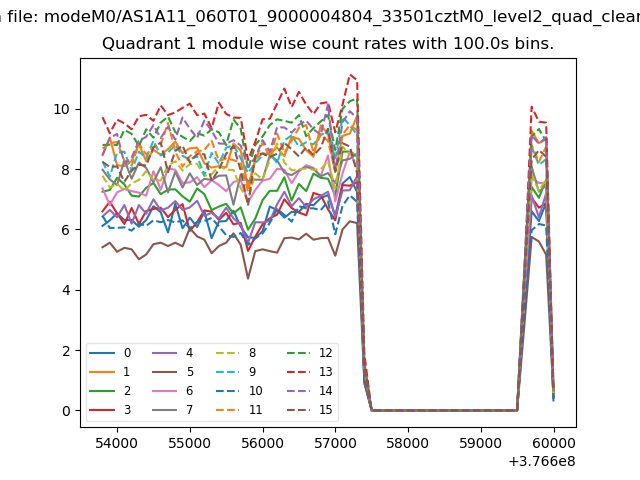 |
 |
| Module-wise count rates for Quadrant C Data is divided into 100 sec bins |
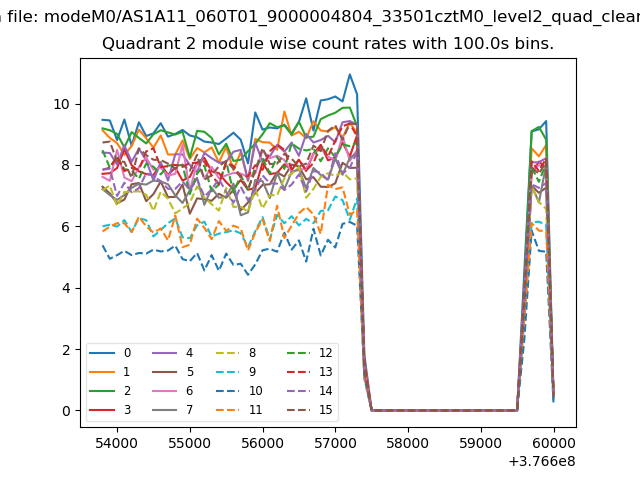 |
 |
| Module-wise count rates for Quadrant D Data is divided into 100 sec bins |
 |
 |
| Parameter | Plot |
|---|---|
| CZT HV Monitor | 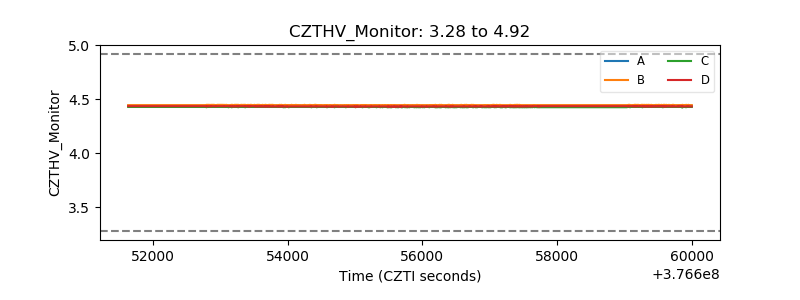 |
| D_VDD |  |
| Temperature 1 | 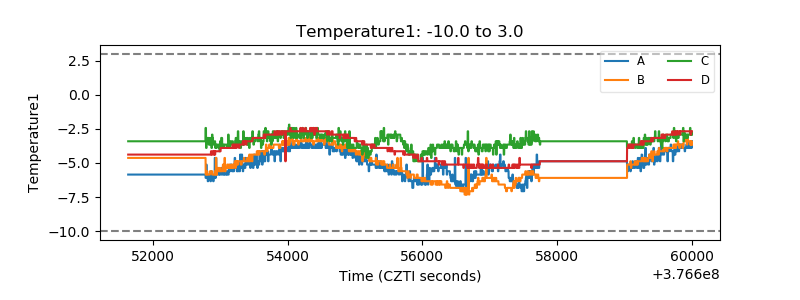 |
| Veto HV Monitor |  |
| Veto LLD | 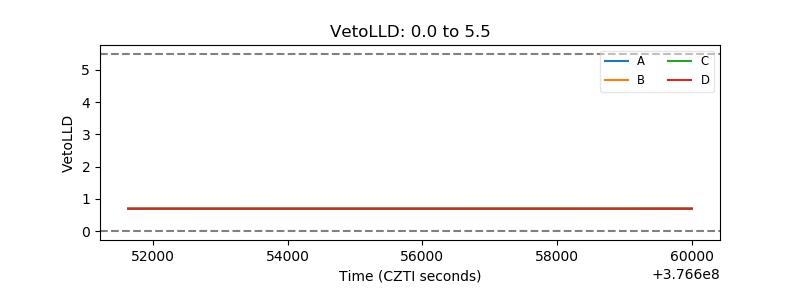 |
| Alpha Counter | 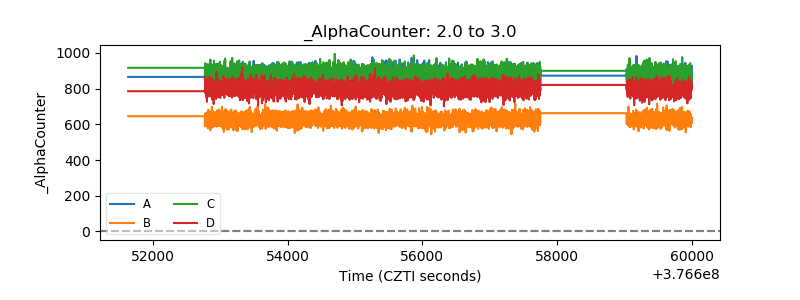 |
| _CPM_Rate | 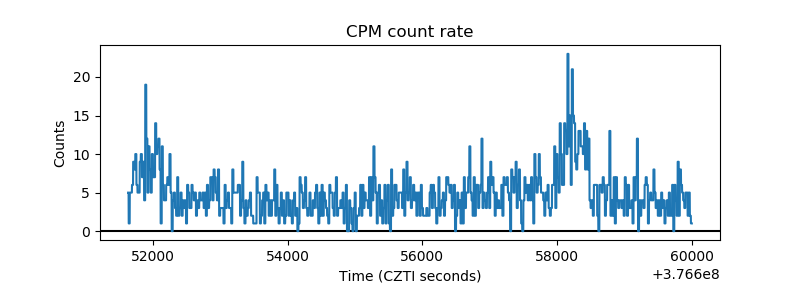 |
| CZT Counter | 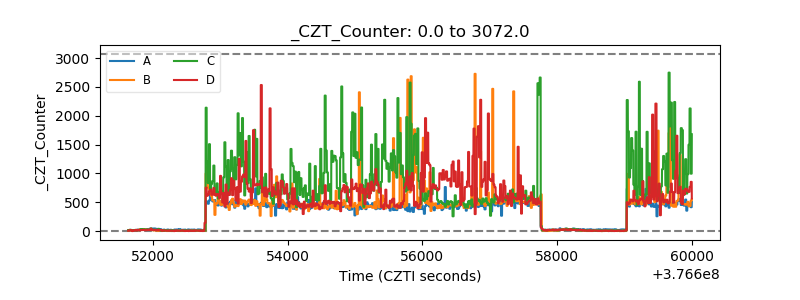 |
| +2.5 Volts monitor |  |
| +5 Volts monitor | 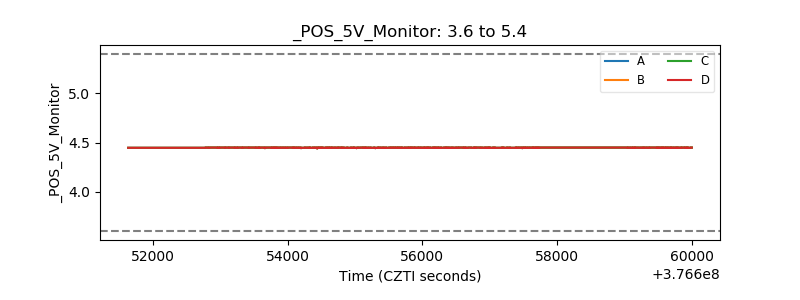 |
| _ROLL_ROT | 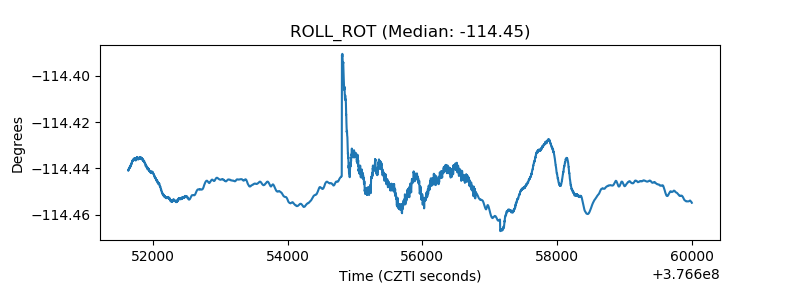 |
| _Roll_DEC | 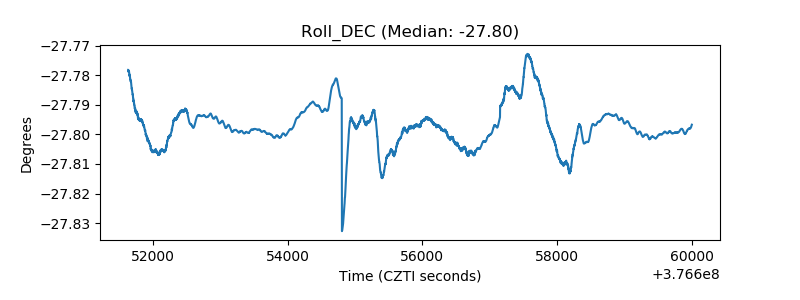 |
| _Roll_RA | 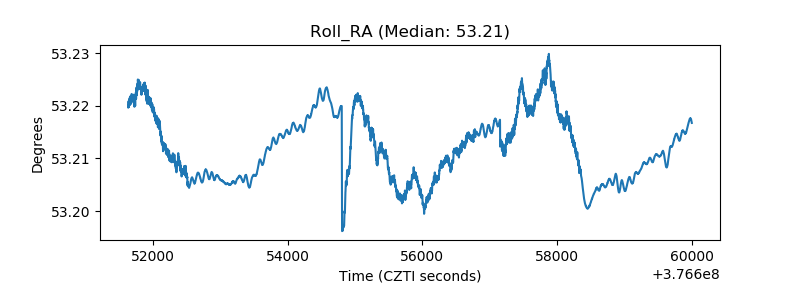 |
| Veto Counter | 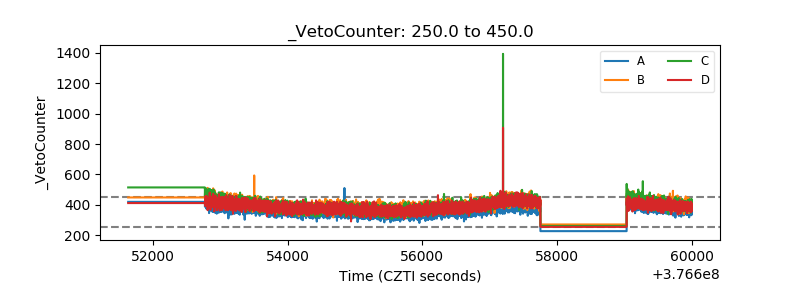 |