| Param | Original file | Final file |
|---|---|---|
| Filename | modeM0/AS1A11_060T01_9000004804_33504cztM0_level2.evt | modeM0/AS1A11_060T01_9000004804_33504cztM0_level2_quad_clean.evt |
| Size (bytes) | 1,303,084,800 | 227,367,360 |
| Size | 1.2 GB | 216.8 MB |
| Events in quadrant A | 7,377,493 | 1,481,490 |
| Events in quadrant B | 9,048,768 | 1,467,626 |
| Events in quadrant C | 10,745,599 | 1,434,838 |
| Events in quadrant D | 11,198,169 | 1,384,038 |
| Mode M9 | |||
|---|---|---|---|
| Quadrant | BADHDUFLAG | Total packets | Discarded packets |
| A | 0 | 55 | 0 |
| B | 0 | 55 | 0 |
| C | 0 | 55 | 0 |
| D | 0 | 55 | 0 |
| Mode M0 | |||
|---|---|---|---|
| Quadrant | BADHDUFLAG | Total packets | Discarded packets |
| A | 0 | 32636 | 5 |
| B | 0 | 37413 | 4 |
| C | 0 | 42347 | 4 |
| D | 0 | 44199 | 4 |
| Mode SS | |||
|---|---|---|---|
| Quadrant | BADHDUFLAG | Total packets | Discarded packets |
| A | 0 | 332 | 0 |
| B | 0 | 332 | 0 |
| C | 0 | 332 | 0 |
| D | 0 | 332 | 0 |
| Quadrant | Total seconds | Saturated seconds | Saturation percentage |
|---|---|---|---|
| A | 16220 | 20 | 0.123305% |
| B | 16220 | 330 | 2.034525% |
| C | 16220 | 371 | 2.287300% |
| D | 16220 | 246 | 1.516646% |
Noise dominated data is calculated using 1-second bins in cleaned event files. If a bin has >2000 counts, and if more than 50% of those come from <1% of pixels, then it is considered to be noise-dominated and hence unusable.
| Quadrant | # 1 sec bins | Bins with >0 counts | Bins with >2000 counts | High rate bins dominated by noise | Noise dominated (total time) | Noise dominated (detector-on time) | Marked lightcurve |
|---|---|---|---|---|---|---|---|
| A | 21711 | 16224 | 0 | 0 | 0.00% | 0.00% | 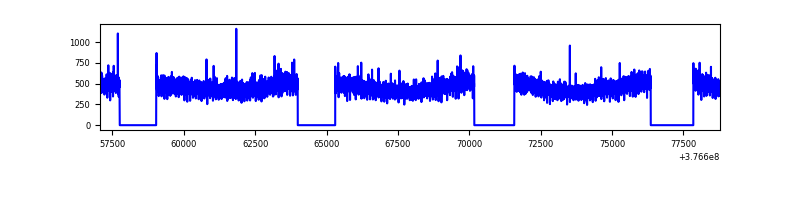 |
| B | 21711 | 16224 | 229 | 229 | 1.05% | 1.41% | 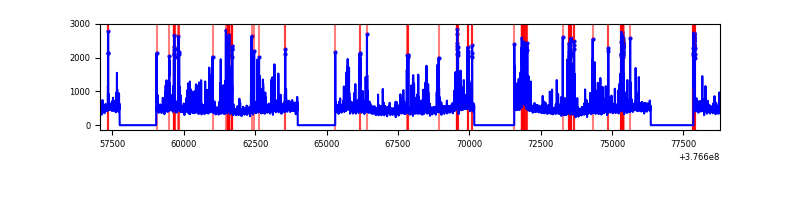 |
| C | 21711 | 16223 | 363 | 363 | 1.67% | 2.24% | 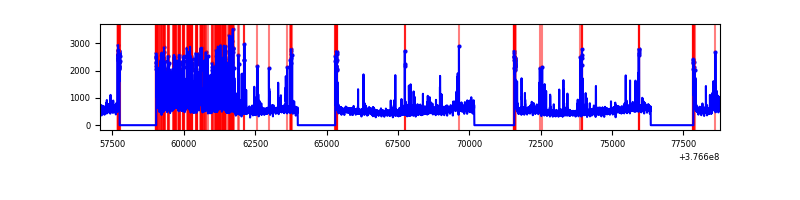 |
| D | 21711 | 16224 | 216 | 216 | 0.99% | 1.33% | 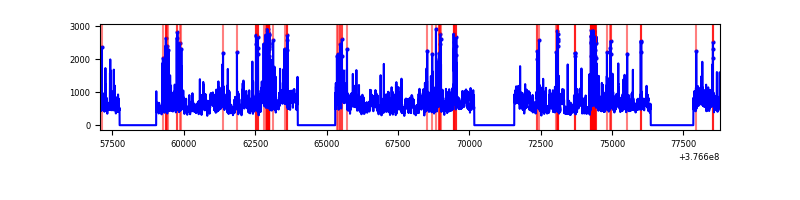 |
Top three noisy pixels from each quadrant. If the there are fewer than three noisy pixels in the level2.evt file, extra rows are filled as -1
| Pixel properties | Quadrant properties | ||||||
|---|---|---|---|---|---|---|---|
| Quadrant | DetID | PixID | Counts | Sigma | Mean | Median | Sigma |
| A | 13 | 254 | 24964 | 60.79 | 1903 | 1869 | 379.9 |
| A | 13 | 6 | 22613 | 54.6 | 1903 | 1869 | 379.9 |
| A | 3 | 137 | 19559 | 46.56 | 1903 | 1869 | 379.9 |
| B | 5 | 172 | 955816 | 2644.17 | 1880 | 1829 | 360.8 |
| B | 5 | 255 | 439838 | 1214.03 | 1880 | 1829 | 360.8 |
| B | 4 | 170 | 207950 | 571.31 | 1880 | 1829 | 360.8 |
| C | 4 | 254 | 1130617 | 2668.2 | 1834 | 1848 | 423.0 |
| C | 15 | 214 | 691412 | 1630.0 | 1834 | 1848 | 423.0 |
| C | 3 | 233 | 397173 | 934.48 | 1834 | 1848 | 423.0 |
| D | 8 | 195 | 2801348 | 6221.29 | 1836 | 1786 | 450.0 |
| D | 2 | 250 | 522415 | 1156.96 | 1836 | 1786 | 450.0 |
| D | 13 | 249 | 458001 | 1013.82 | 1836 | 1786 | 450.0 |
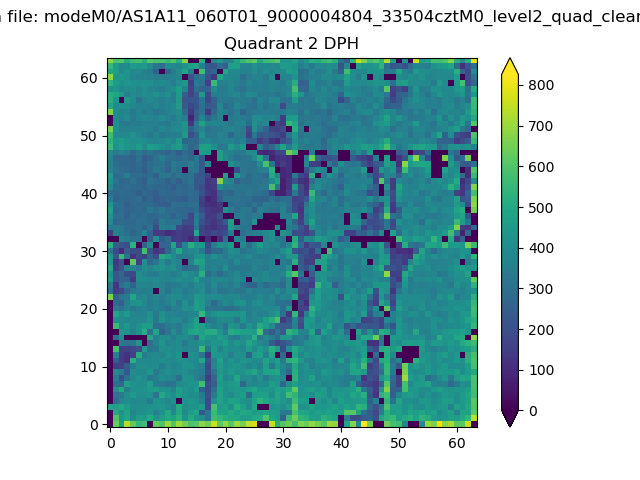
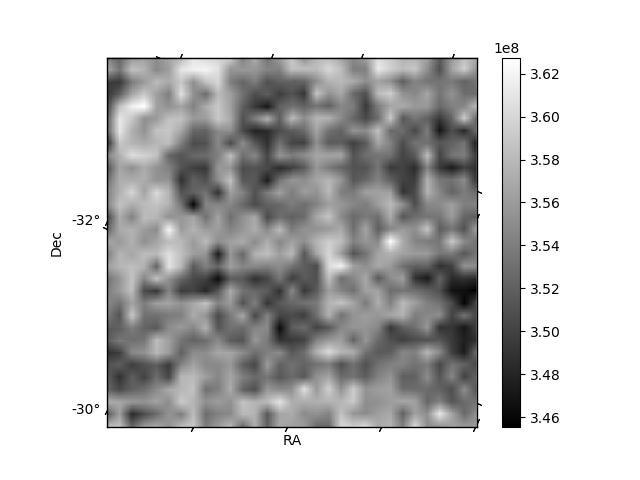
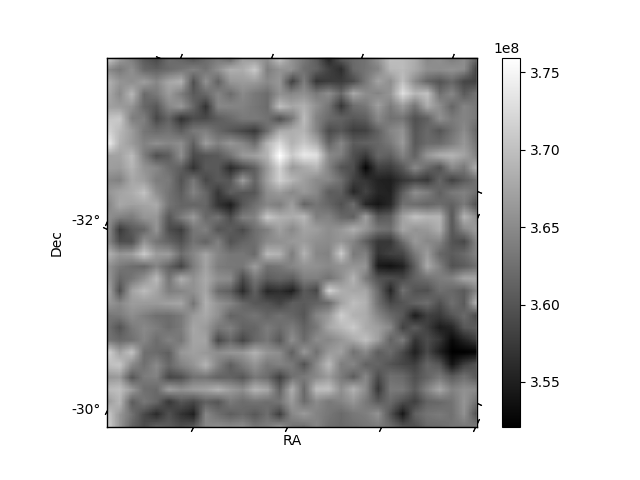
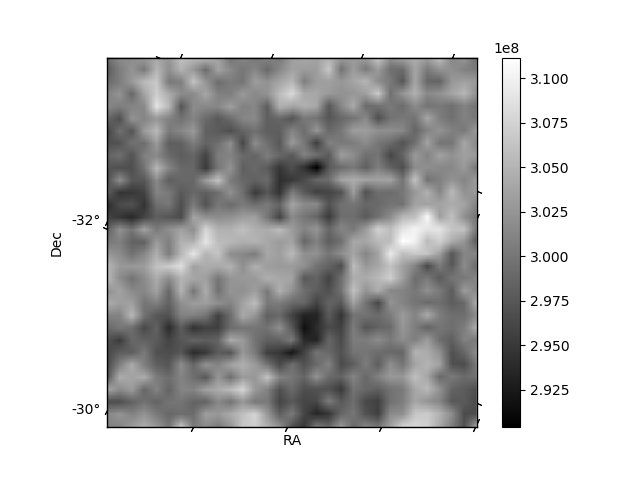
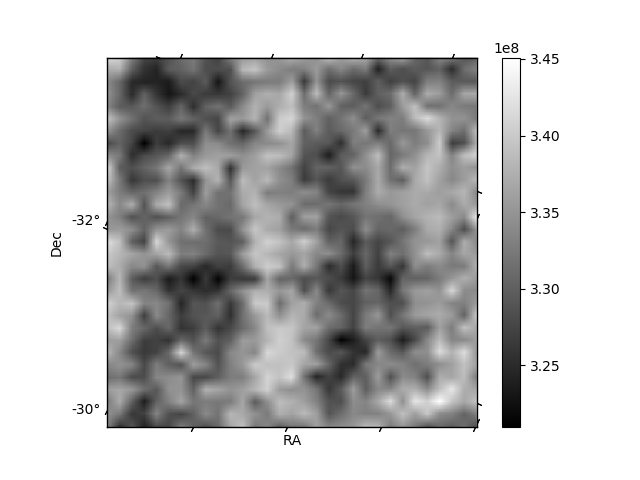
Histogram calculated using DETX and DETY for each event in the final _common_clean file
| Quadrant A |  |
 |
Quadrant B |
|---|---|---|---|
| Quadrant D |  |
 |
Quadrant C |
| Plot type | Count rate plots | Images |
|---|---|---|
| Comparison with Poisson distribution Blue bars denote a histogram of data divided into 1 sec bins. Red curve is a Poisson curve with rate = median count rate of data. |
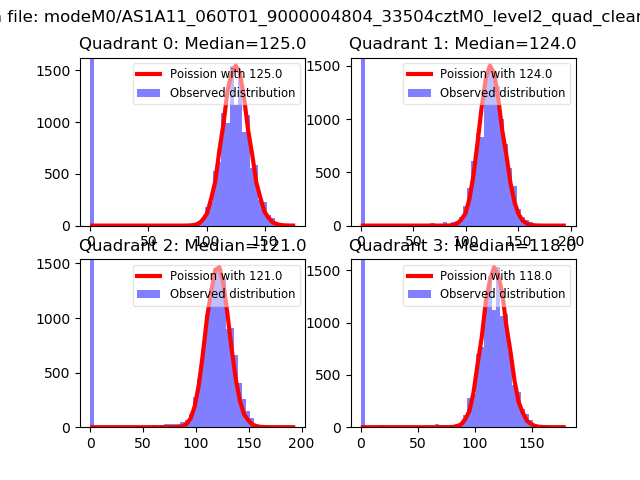 |
 |
| Quadrant-wise count rates Data is divided into 100 sec bins |
 |
|
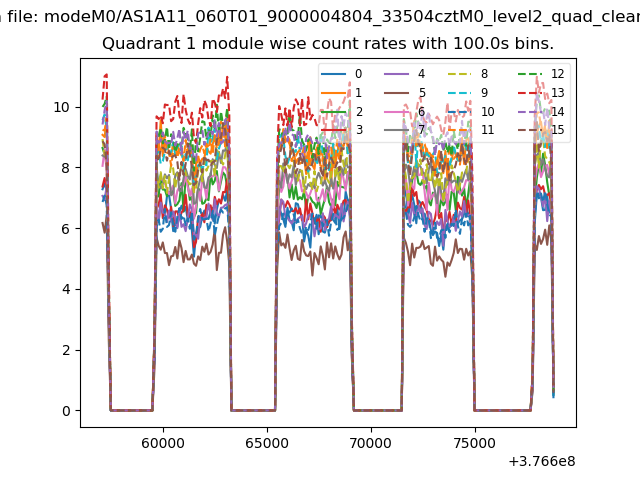
| Module-wise count rates for Quadrant A Data is divided into 100 sec bins |
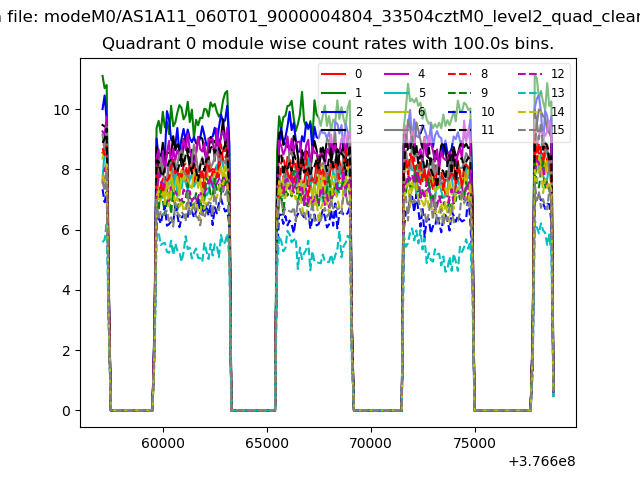 |
 |
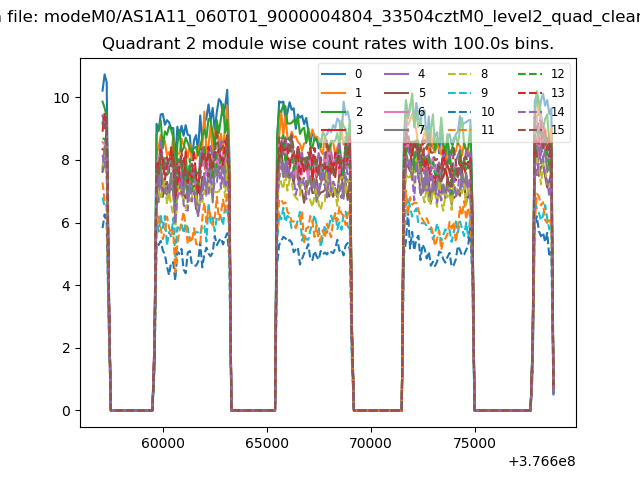
| Module-wise count rates for Quadrant B Data is divided into 100 sec bins |
 |
 |
| Module-wise count rates for Quadrant C Data is divided into 100 sec bins |
 |
 |
| Module-wise count rates for Quadrant D Data is divided into 100 sec bins |
 |
 |
| Parameter | Plot |
|---|---|
| CZT HV Monitor |  |
| D_VDD | 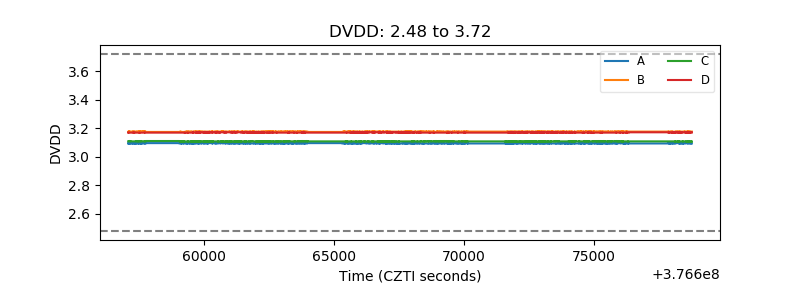 |
| Temperature 1 | 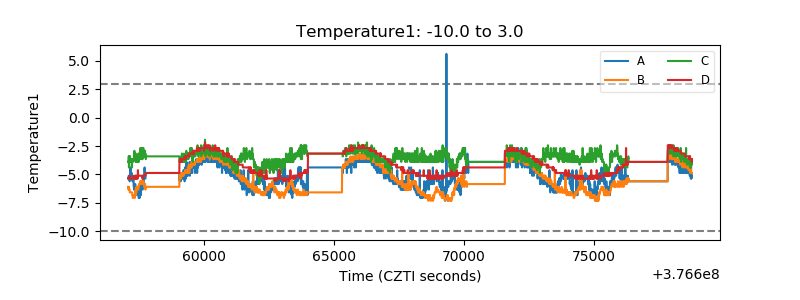 |
| Veto HV Monitor | 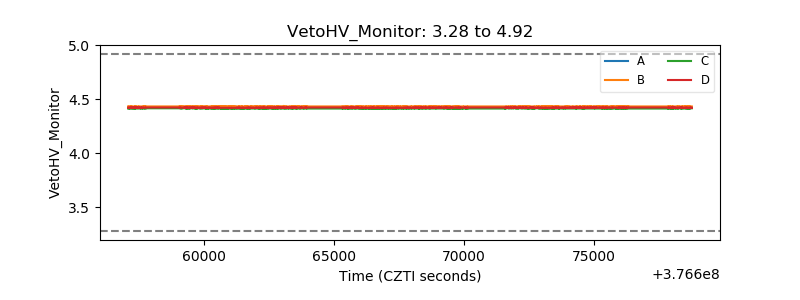 |
| Veto LLD | 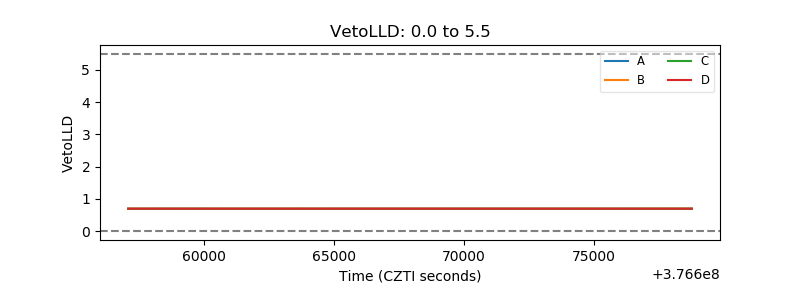 |
| Alpha Counter | 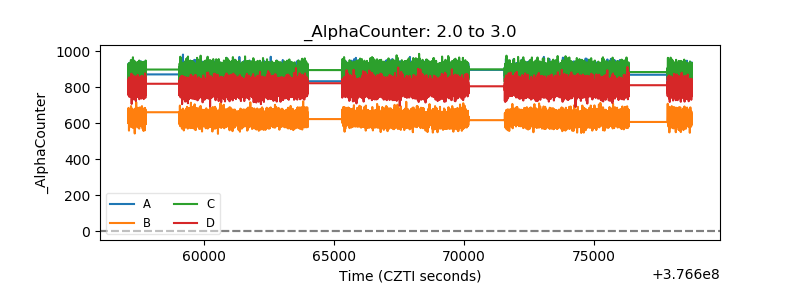 |
| _CPM_Rate | 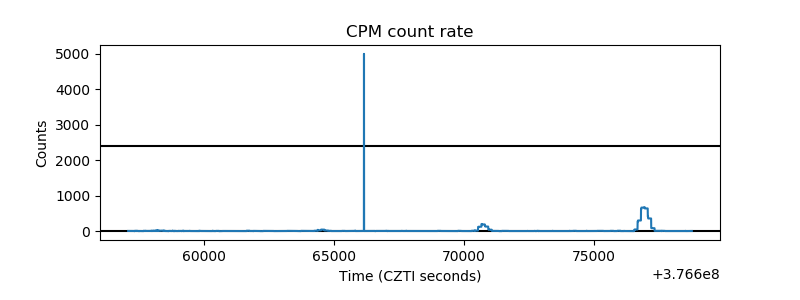 |
| CZT Counter | 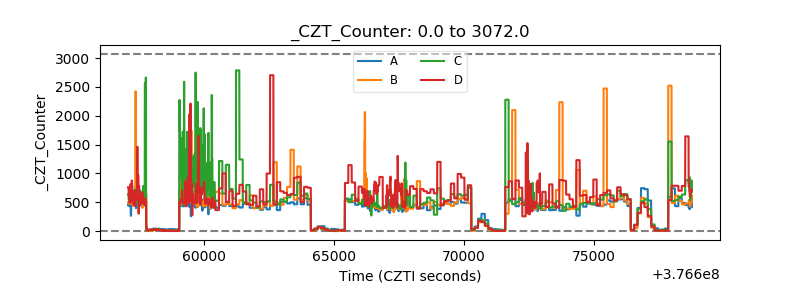 |
| +2.5 Volts monitor |  |
| +5 Volts monitor | 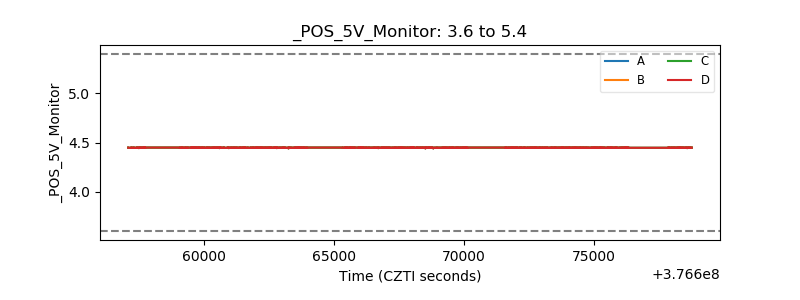 |
| _ROLL_ROT |  |
| _Roll_DEC | 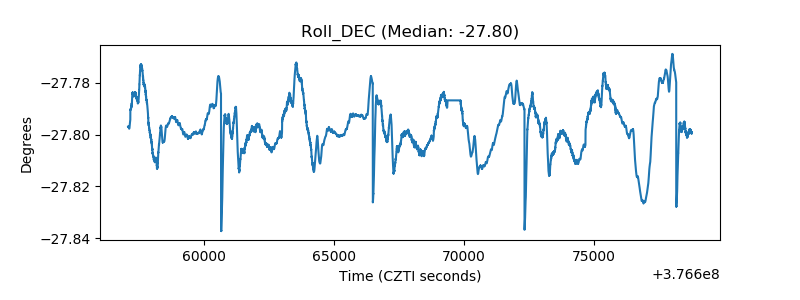 |
| _Roll_RA | 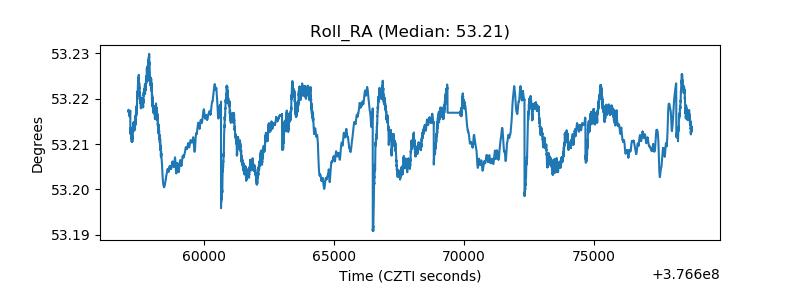 |
| Veto Counter | 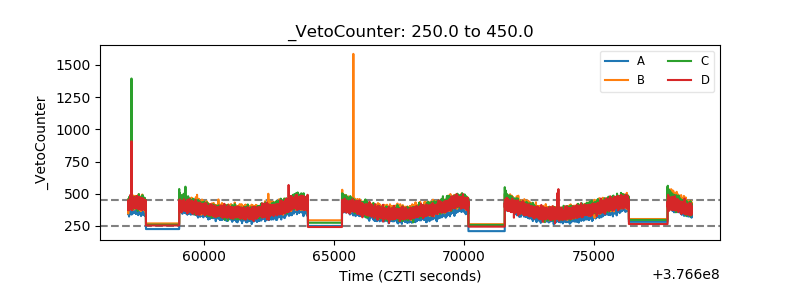 |