| Param | Original file | Final file |
|---|---|---|
| Filename | modeM0/AS1A11_060T01_9000004804_33505cztM0_level2.evt | modeM0/AS1A11_060T01_9000004804_33505cztM0_level2_quad_clean.evt |
| Size (bytes) | 483,952,320 | 75,752,640 |
| Size | 461.5 MB | 72.2 MB |
| Events in quadrant A | 2,542,980 | 494,098 |
| Events in quadrant B | 3,649,657 | 487,196 |
| Events in quadrant C | 4,343,257 | 466,379 |
| Events in quadrant D | 3,744,535 | 458,175 |
| Mode M9 | |||
|---|---|---|---|
| Quadrant | BADHDUFLAG | Total packets | Discarded packets |
| A | 0 | 20 | 0 |
| B | 0 | 20 | 0 |
| C | 0 | 20 | 0 |
| D | 0 | 21 | 0 |
| Mode M0 | |||
|---|---|---|---|
| Quadrant | BADHDUFLAG | Total packets | Discarded packets |
| A | 0 | 11230 | 3 |
| B | 0 | 14488 | 2 |
| C | 0 | 16659 | 2 |
| D | 0 | 14892 | 2 |
| Mode SS | |||
|---|---|---|---|
| Quadrant | BADHDUFLAG | Total packets | Discarded packets |
| A | 0 | 112 | 0 |
| B | 0 | 112 | 0 |
| C | 0 | 112 | 0 |
| D | 0 | 112 | 0 |
| Quadrant | Total seconds | Saturated seconds | Saturation percentage |
|---|---|---|---|
| A | 5550 | 9 | 0.162162% |
| B | 5550 | 406 | 7.315315% |
| C | 5550 | 117 | 2.108108% |
| D | 5550 | 47 | 0.846847% |
Noise dominated data is calculated using 1-second bins in cleaned event files. If a bin has >2000 counts, and if more than 50% of those come from <1% of pixels, then it is considered to be noise-dominated and hence unusable.
| Quadrant | # 1 sec bins | Bins with >0 counts | Bins with >2000 counts | High rate bins dominated by noise | Noise dominated (total time) | Noise dominated (detector-on time) | Marked lightcurve |
|---|---|---|---|---|---|---|---|
| A | 7162 | 5551 | 1 | 1 | 0.01% | 0.02% | 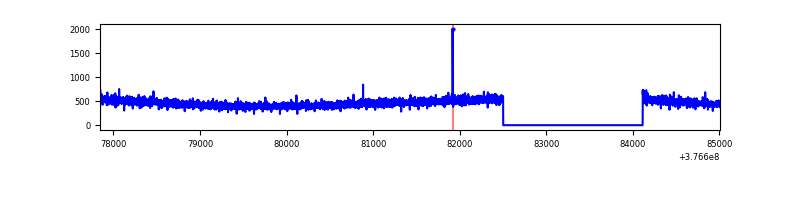 |
| B | 7162 | 5550 | 300 | 300 | 4.19% | 5.41% | 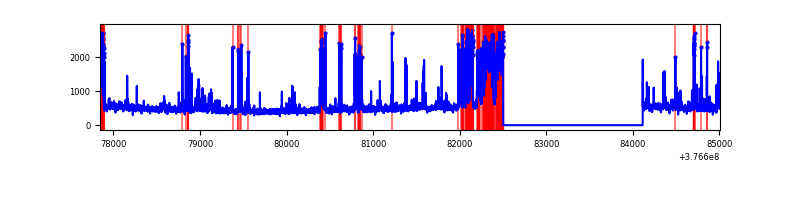 |
| C | 7162 | 5551 | 117 | 117 | 1.63% | 2.11% | 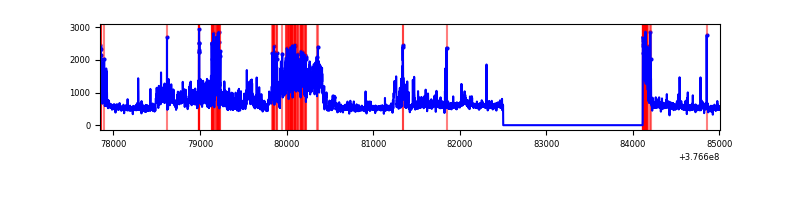 |
| D | 7162 | 5551 | 49 | 49 | 0.68% | 0.88% | 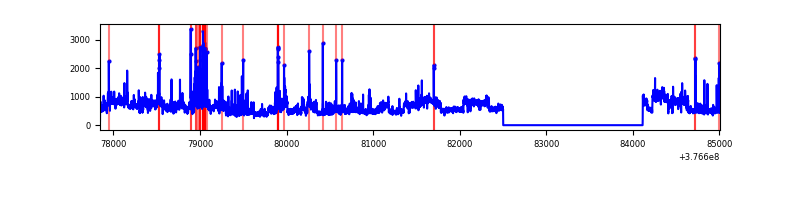 |
Top three noisy pixels from each quadrant. If the there are fewer than three noisy pixels in the level2.evt file, extra rows are filled as -1
| Pixel properties | Quadrant properties | ||||||
|---|---|---|---|---|---|---|---|
| Quadrant | DetID | PixID | Counts | Sigma | Mean | Median | Sigma |
| A | 13 | 254 | 9861 | 70.37 | 654 | 643 | 131.0 |
| A | 3 | 137 | 6679 | 46.08 | 654 | 643 | 131.0 |
| A | 13 | 6 | 6305 | 43.22 | 654 | 643 | 131.0 |
| B | 5 | 172 | 933344 | 7566.3 | 631 | 615 | 123.3 |
| B | 5 | 255 | 220472 | 1783.48 | 631 | 615 | 123.3 |
| B | 12 | 111 | 14929 | 116.12 | 631 | 615 | 123.3 |
| C | 10 | 49 | 1007839 | 6922.17 | 627 | 631 | 145.5 |
| C | 0 | 10 | 284632 | 1951.84 | 627 | 631 | 145.5 |
| C | 15 | 214 | 241118 | 1652.78 | 627 | 631 | 145.5 |
| D | 8 | 195 | 948268 | 6153.54 | 627 | 608 | 154.0 |
| D | 1 | 47 | 134421 | 868.9 | 627 | 608 | 154.0 |
| D | 13 | 249 | 92474 | 596.52 | 627 | 608 | 154.0 |
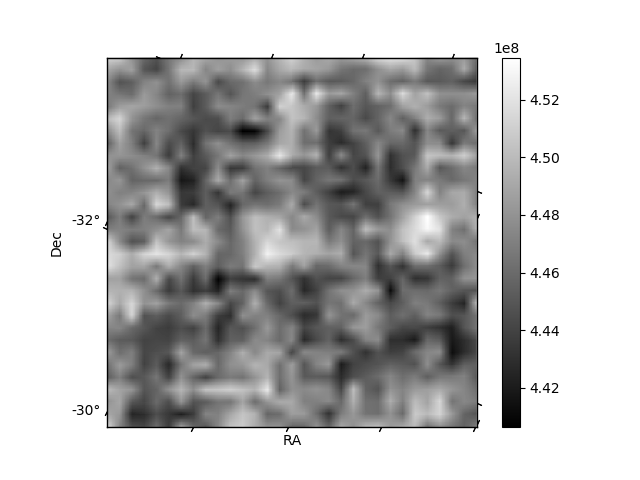
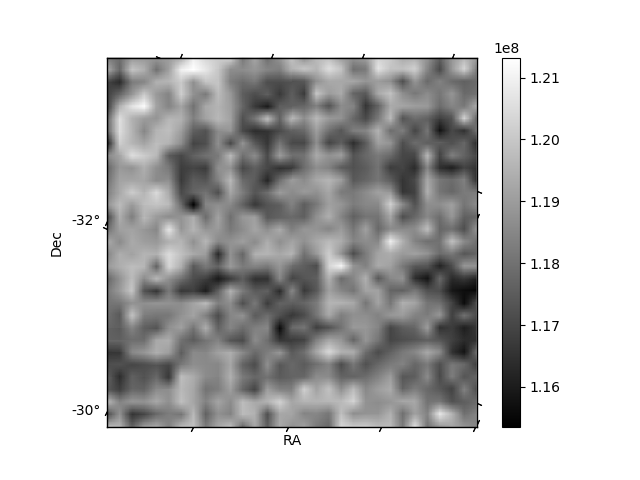
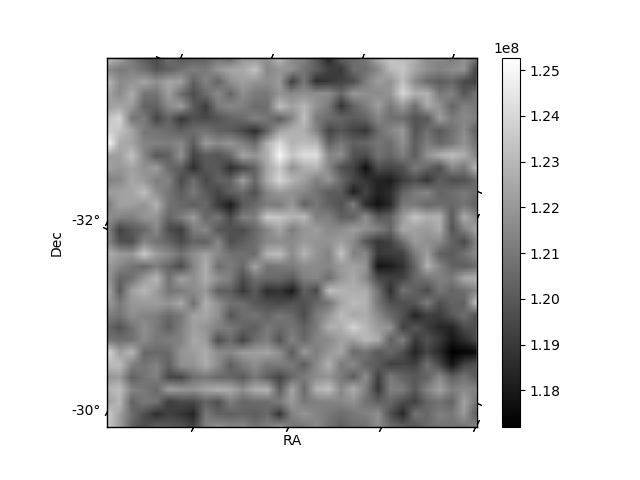
Histogram calculated using DETX and DETY for each event in the final _common_clean file
| Quadrant A | 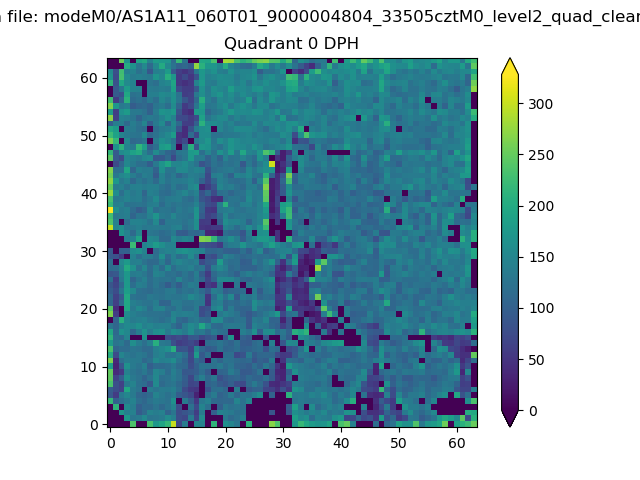 |
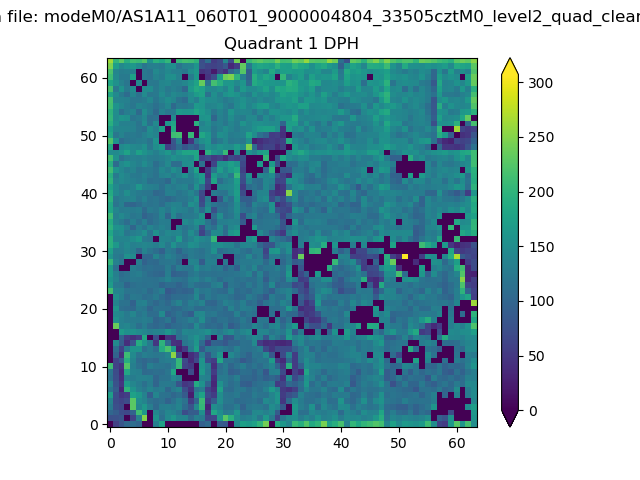 |
Quadrant B |
|---|---|---|---|
| Quadrant D | 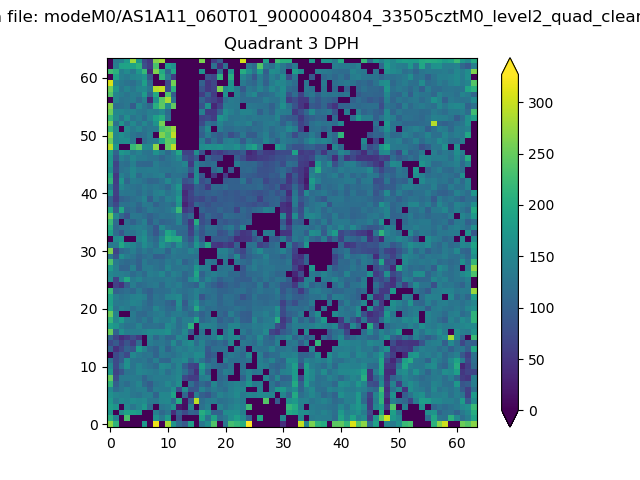 |
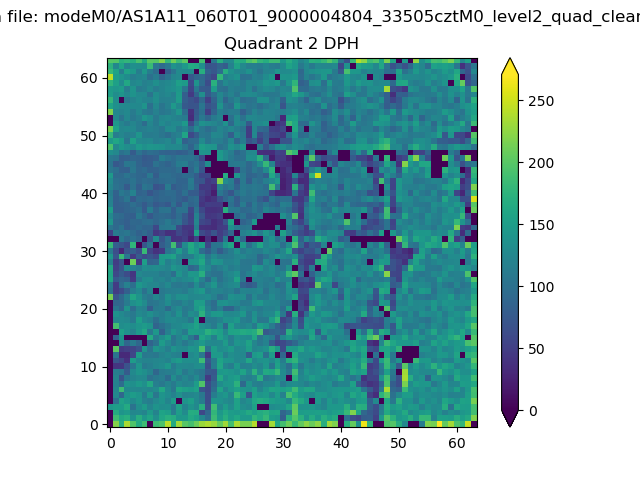 |
Quadrant C |
| Plot type | Count rate plots | Images |
|---|---|---|
| Comparison with Poisson distribution Blue bars denote a histogram of data divided into 1 sec bins. Red curve is a Poisson curve with rate = median count rate of data. |
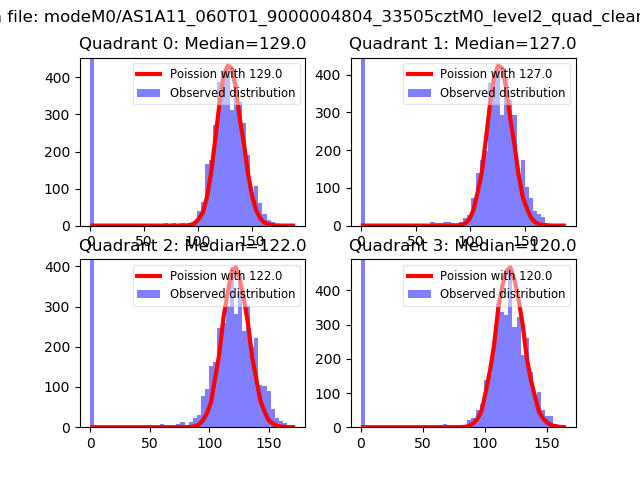 |
 |
| Quadrant-wise count rates Data is divided into 100 sec bins |
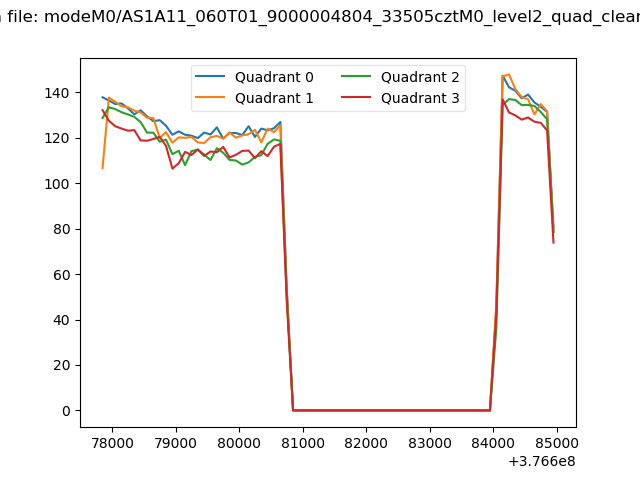 |
|
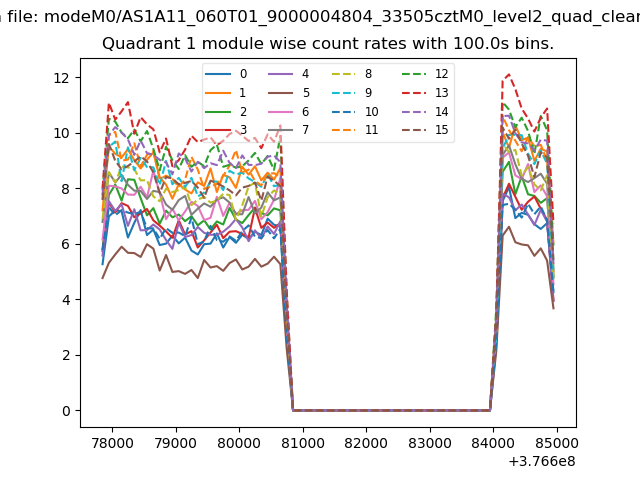
| Module-wise count rates for Quadrant A Data is divided into 100 sec bins |
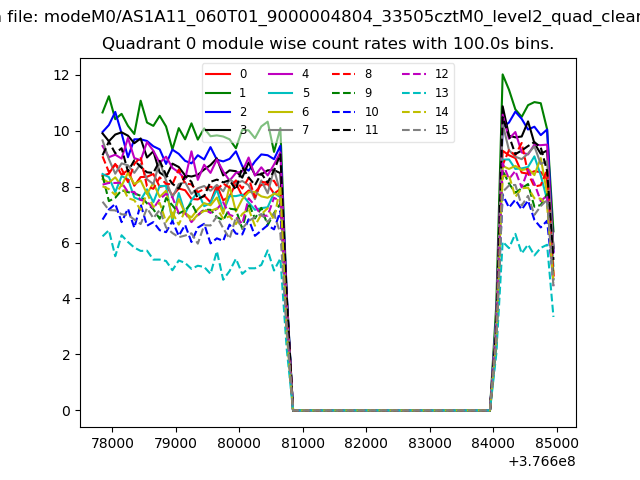 |
 |
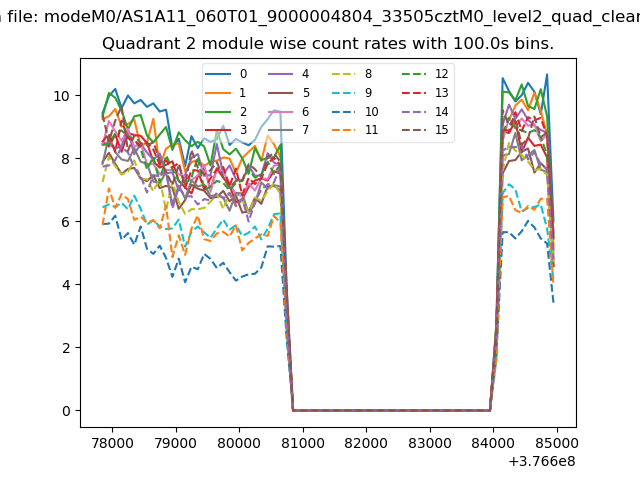
| Module-wise count rates for Quadrant B Data is divided into 100 sec bins |
 |
 |
| Module-wise count rates for Quadrant C Data is divided into 100 sec bins |
 |
 |
| Module-wise count rates for Quadrant D Data is divided into 100 sec bins |
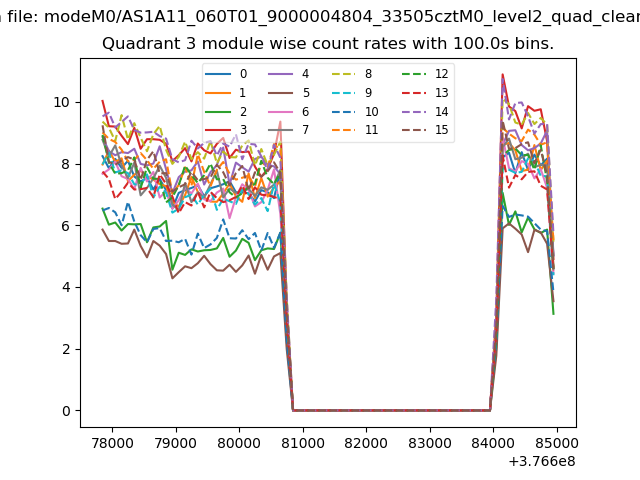 |
 |
| Parameter | Plot |
|---|---|
| CZT HV Monitor | 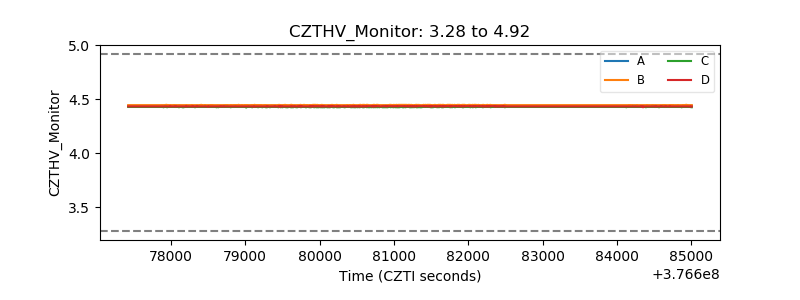 |
| D_VDD |  |
| Temperature 1 | 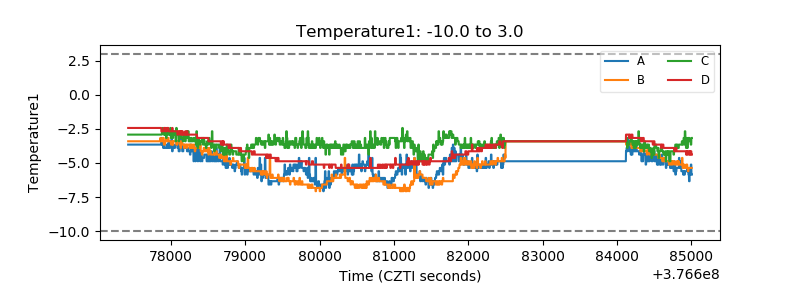 |
| Veto HV Monitor | 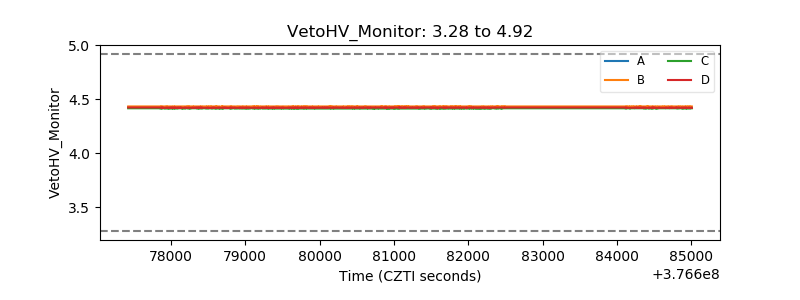 |
| Veto LLD | 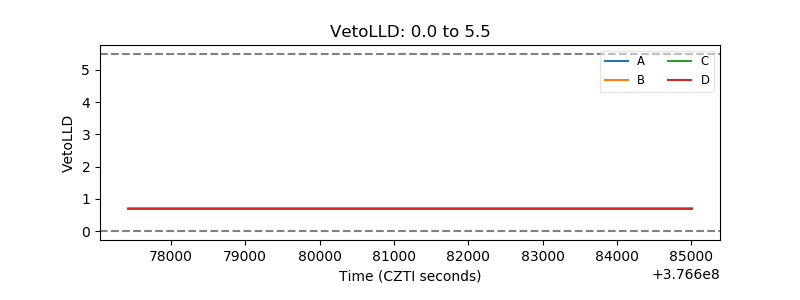 |
| Alpha Counter | 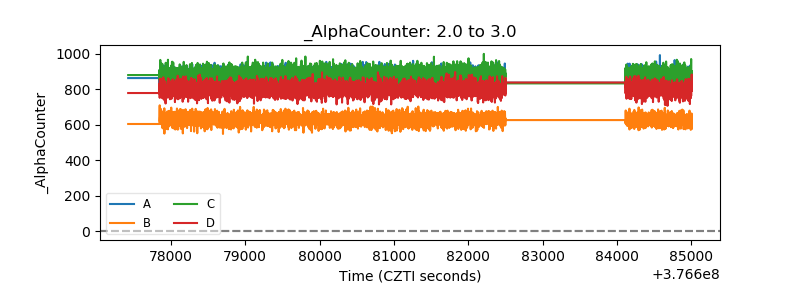 |
| _CPM_Rate | 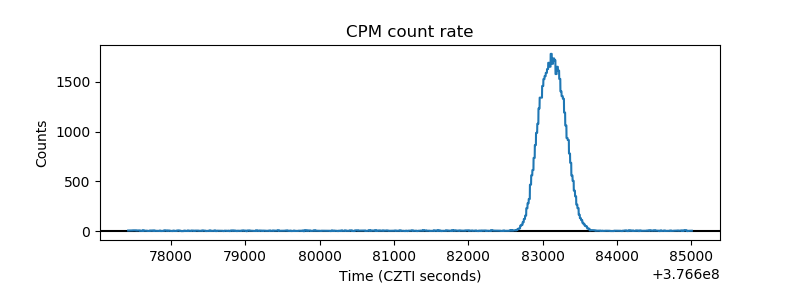 |
| CZT Counter | 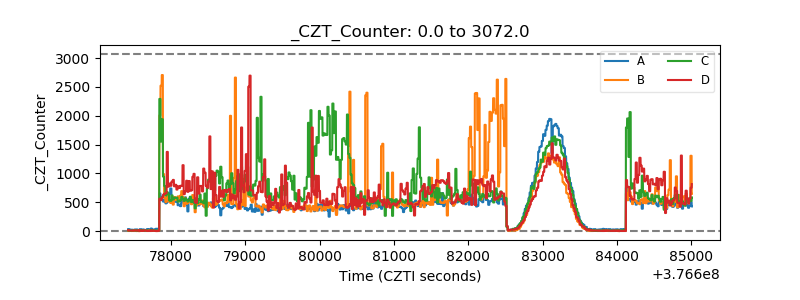 |
| +2.5 Volts monitor |  |
| +5 Volts monitor |  |
| _ROLL_ROT | 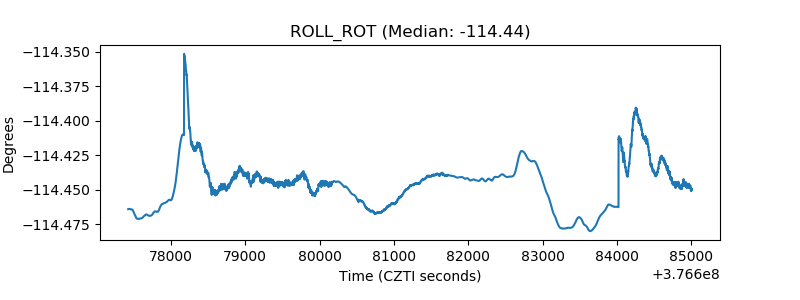 |
| _Roll_DEC | 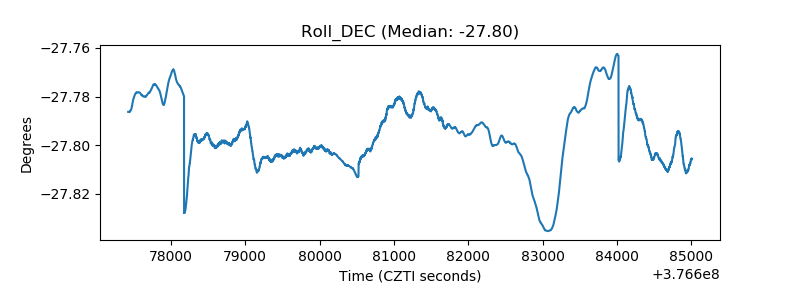 |
| _Roll_RA |  |
| Veto Counter | 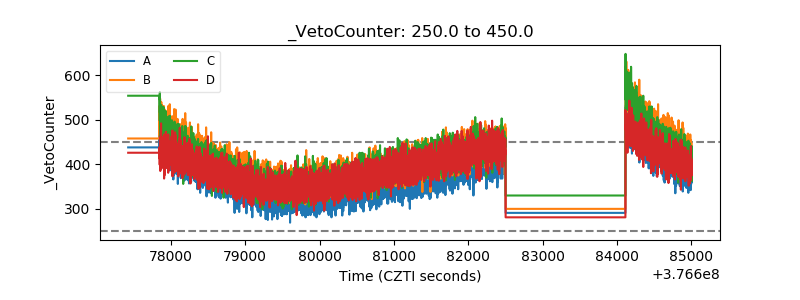 |